KUB vs TRX: Dijital Varlık Ekosisteminde Öne Çıkan İki Kripto Paranın Karşılaştırılması


Giriş: KUB ve TRX Yatırım Karşılaştırması
Kripto para piyasasında KUB ve TRX’in karşılaştırılması, yatırımcıların göz ardı edemeyeceği bir başlıktır. Bu iki varlık; piyasa değeri sıralaması, kullanım alanları ve fiyat performansı gibi konularda önemli farklılıklar taşırken, kripto varlıkların piyasadaki konumlanmasını da farklı şekillerde temsil eder.
Bitkub Coin (KUB): Lansmanından bu yana, Bitkub Chain ekosisteminde yakıt sağlama, operasyon ve yönetim gibi roller üstlenerek piyasa tarafından kabul görmüştür.
TRON (TRX): 2017’de piyasaya sürülmesinden beri, içerik paylaşımı ve eğlence alanında merkeziyetsiz bir platform olarak öne çıkmıştır. Aynı zamanda globalde en yüksek işlem hacmine ve piyasa değerine sahip kripto paralardan biridir.
Bu yazıda, KUB ve TRX’in yatırım değeri karşılaştırması tarihsel fiyat eğilimleri, arz mekanizmaları, kurumsal benimsenme, teknolojik ekosistemler ve gelecek öngörüleri üzerinden kapsamlı şekilde analiz edilerek, yatırımcıların en çok merak ettiği soruya yanıt aranacaktır:
"Hangi varlık şu anda daha iyi bir alım fırsatı sunuyor?"
I. Fiyat Geçmişi Karşılaştırması ve Güncel Piyasa Durumu
KUB (Coin A) ve TRX (Coin B) Tarihsel Fiyat Eğilimleri
- 2021: KUB, 28 Aralık 2021’de 17,24 $ ile tüm zamanların en yüksek değerini gördü.
- 2021: TRX, yıl boyunca güçlü bir büyüme sergiledi ve fiyatı belirgin şekilde arttı.
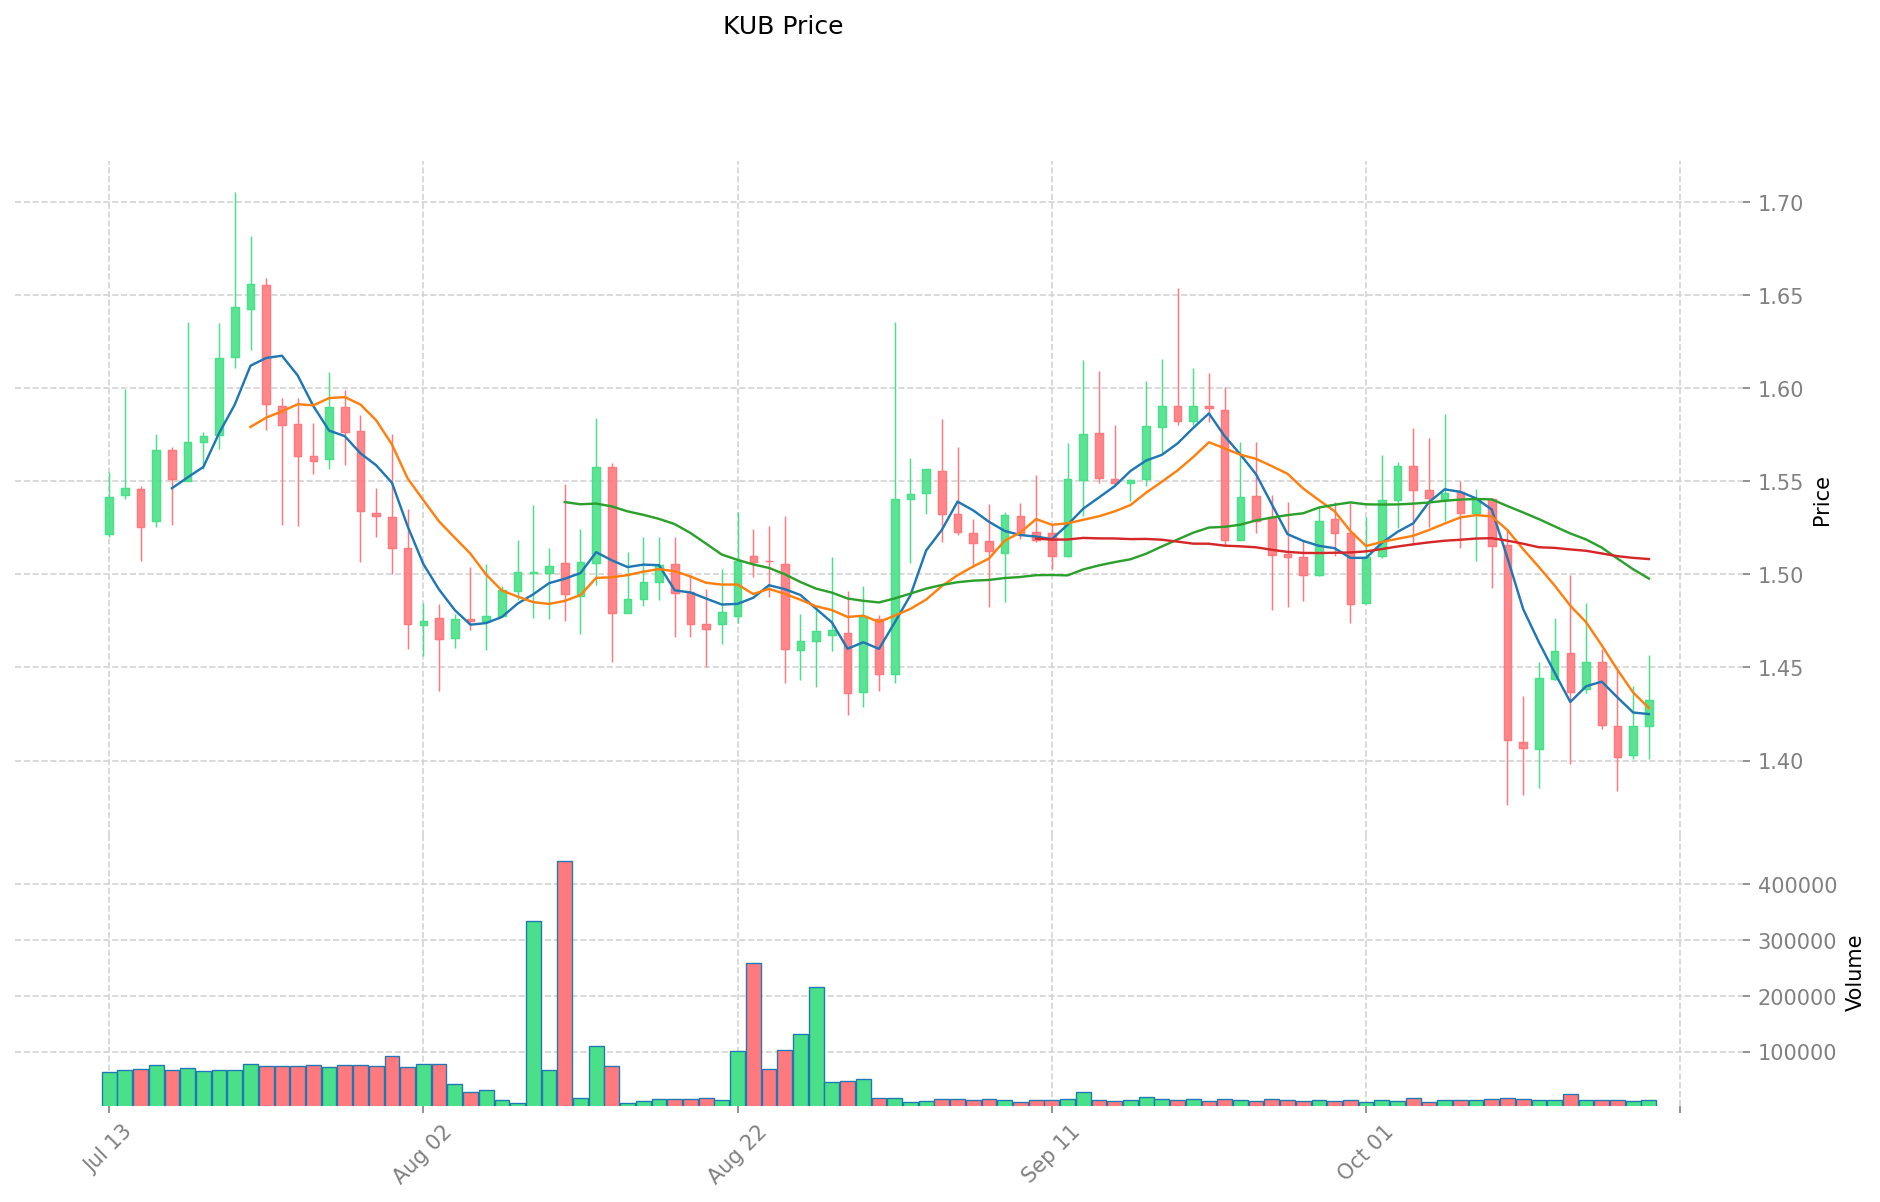
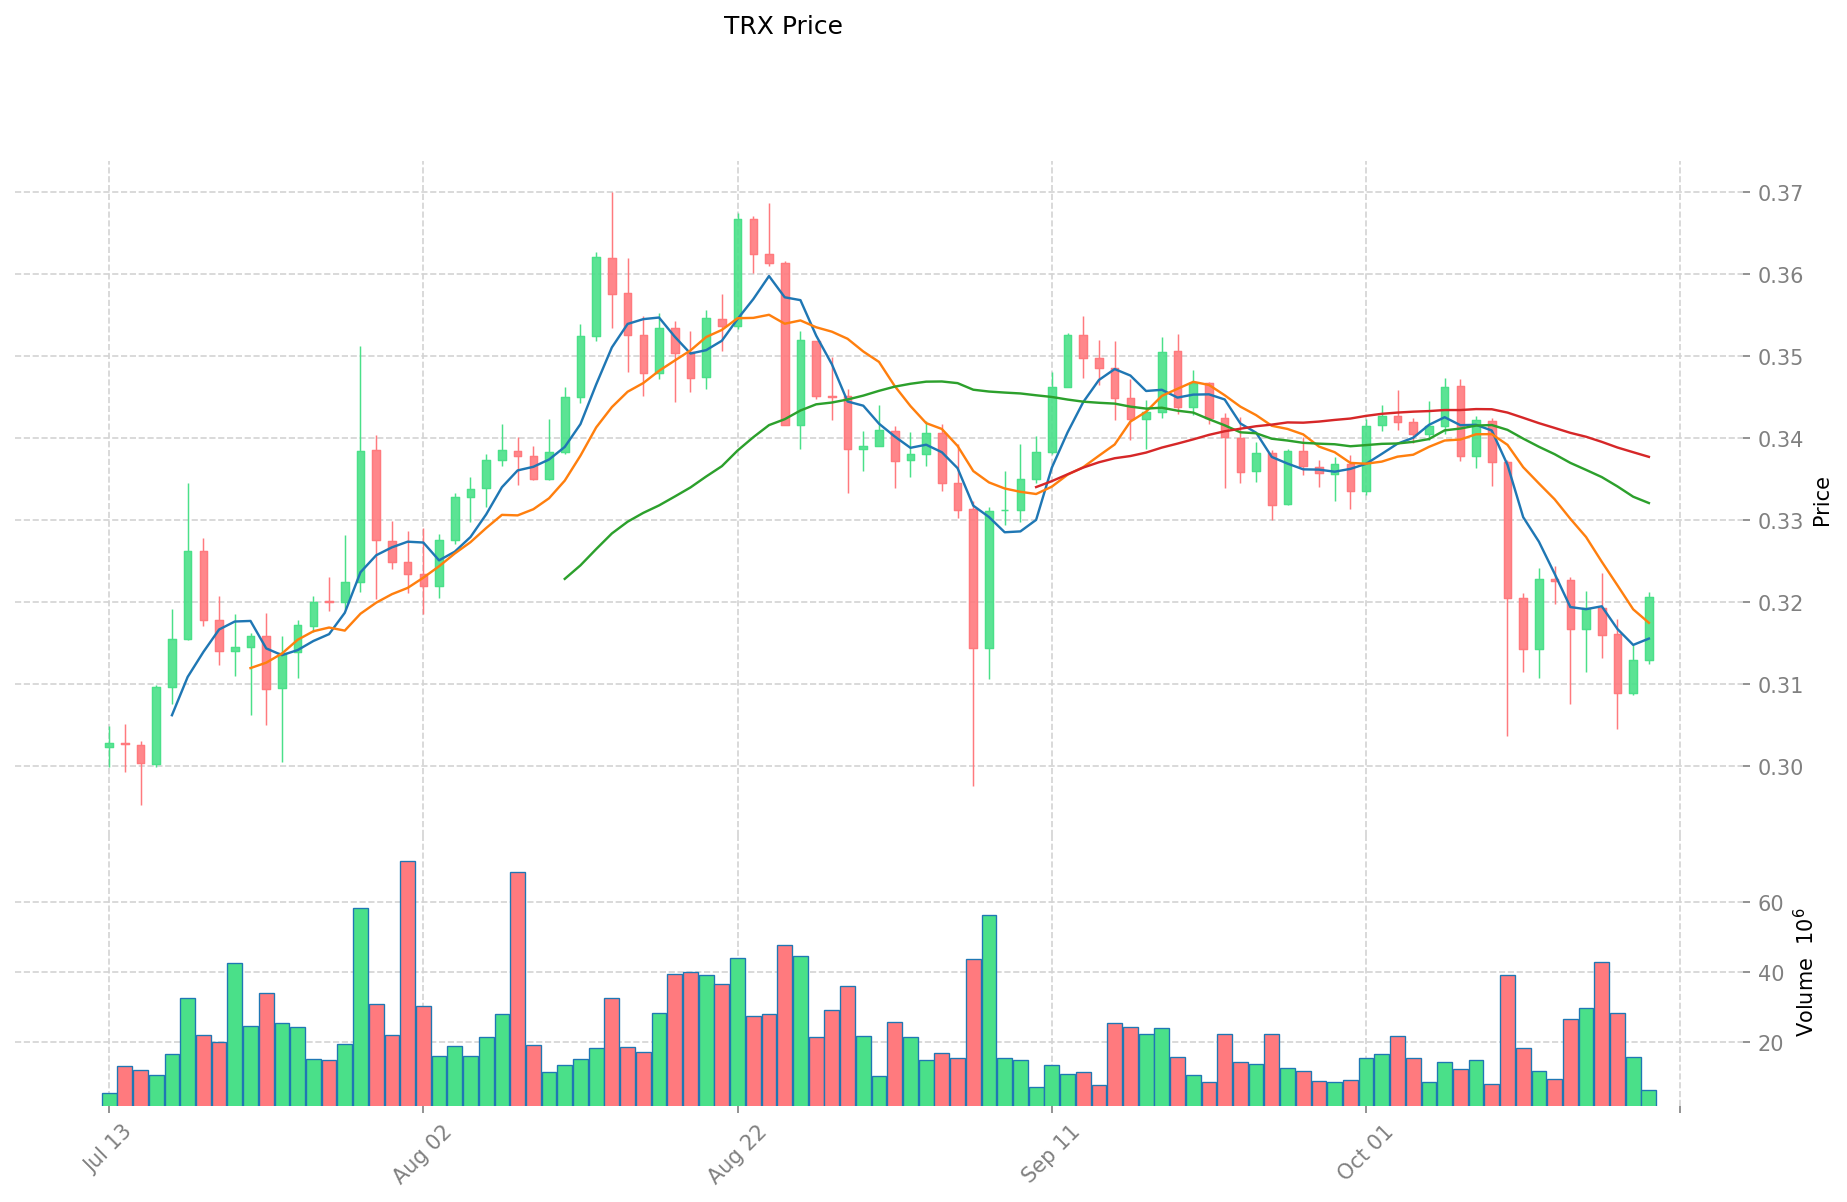
- Karşılaştırmalı analiz: KUB, 17,24 $’lık zirveden düşerek şu an 1,4324 $ seviyesinde işlem görürken; TRX daha istikrarlı bir performans sergileyerek 0,31985 $’dan işlem görüyor.
Güncel Piyasa Durumu (20 Ekim 2025)
- KUB güncel fiyatı: 1,4324 $
- TRX güncel fiyatı: 0,31985 $
- 24 saatlik işlem hacmi: KUB 20.008,09 $ / TRX 1.959.443,57 $
- Piyasa Duyarlılık Endeksi (Korku & Açgözlülük Endeksi): 29 (Korku)
Anlık fiyatları görmek için tıklayın:
- KUB güncel fiyatı Piyasa Fiyatı
- TRX güncel fiyatı Piyasa Fiyatı
II. KUB ve TRX’in Yatırım Değerini Belirleyen Temel Faktörler
Arz Mekanizmaları Karşılaştırması (Tokenomik)
- KUB: 1 milyar KUB token ile sınırlı arz; bunun %40’ı Kubcoin Foundation’a ekosistem geliştirme için ayrılmıştır
- TRX: Toplamda yaklaşık 100 milyar TRX arzı ve blok ödülleriyle enflasyonist bir model
Kurumsal Benimsenme ve Piyasa Uygulamaları
- Kurumsal Varlık: TRX, daha yüksek işlem hacmi ve piyasa görünürlüğü ile kurumsal benimsenmede önde
- Kurumsal Kullanım: TRON ekosistemi sayesinde TRX, sınır ötesi ödeme ve mutabakatlarda daha yaygın olarak kullanılıyor
- Ulusal Politikalar: TRX bazı ülkelerde düzenleyici denetim altında iken, KUB Tayland’da mevzuata uyum avantajına sahip
Teknolojik Gelişim ve Ekosistem Oluşumu
- KUB Teknik Güncellemeleri: Bitkub borsa ekosistemini desteklemek için ölçeklenebilirlik ve işlem işleme kapasitesini geliştirmeye odaklanıyor
- TRX Teknik Gelişim: TRON ağı sürekli gelişiyor; DeFi uygulamaları ve USDT entegrasyonu ön planda
- Ekosistem Karşılaştırması: TRX, geniş DeFi, NFT ve akıllı sözleşme uygulamalarıyla olgun bir ekosisteme sahipken; KUB daha çok Tayland pazarı ve Bitkub borsa hizmetlerine odaklanıyor
Makroekonomik ve Piyasa Döngüleri
- Enflasyonist Ortamlarda Performans: TRX, daha geniş çaplı benimsenmesi sayesinde enflasyon dönemlerinde daha dirençli
- Makroekonomik Para Politikası: Her iki token de faiz oranı değişiklikleri ve USD endeksi dalgalanmalarına duyarlı
- Jeopolitik Faktörler: TRX, küresel çapta sınır ötesi işlem talebinden faydalanırken; KUB, Güneydoğu Asya’daki bölgesel ekonomik koşullardan etkileniyor
III. 2025-2030 Fiyat Tahmini: KUB vs TRX
Kısa Vadeli Tahmin (2025)
- KUB: Muhafazakâr 0,96 $ - 1,43 $ | İyimser 1,43 $ - 1,82 $
- TRX: Muhafazakâr 0,20 $ - 0,32 $ | İyimser 0,32 $ - 0,42 $
Orta Vadeli Tahmin (2027)
- KUB, büyüme evresine geçebilir; tahmini fiyat aralığı 0,94 $ - 2,40 $
- TRX, istikrarlı büyüme dönemine girebilir; tahmini fiyat aralığı 0,26 $ - 0,46 $
- Önemli etkenler: Kurumsal sermaye girişi, ETF, ekosistem geliştirme
Uzun Vadeli Tahmin (2030)
- KUB: Temel senaryo 1,98 $ - 2,48 $ | İyimser senaryo 2,48 $ - 2,80 $
- TRX: Temel senaryo 0,51 $ - 0,60 $ | İyimser senaryo 0,60 $ - 0,64 $
Feragatname: Yukarıdaki tahminler, geçmiş veriler ve piyasa analizlerine dayanmaktadır. Kripto para piyasaları yüksek volatiliteye sahiptir ve sürekli değişir. Bu bilgiler yatırım tavsiyesi değildir. Yatırım kararlarınızı almadan önce mutlaka kendi araştırmanızı yapınız.
KUB:
| Yıl | Tahmini En Yüksek Fiyat | Tahmini Ortalama Fiyat | Tahmini En Düşük Fiyat | Artış Oranı (%) |
|---|---|---|---|---|
| 2025 | 1,819148 | 1,4324 | 0,959708 | 0 |
| 2026 | 1,85338236 | 1,625774 | 1,47945434 | 13 |
| 2027 | 2,4006178884 | 1,73957818 | 0,9393722172 | 21 |
| 2028 | 2,608323523092 | 2,0700980342 | 1,262759800862 | 44 |
| 2029 | 2,61991607208352 | 2,339210778646 | 1,5204870061199 | 63 |
| 2030 | 2,801906670662178 | 2,47956342536476 | 1,983650740291808 | 73 |
TRX:
| Yıl | Tahmini En Yüksek Fiyat | Tahmini Ortalama Fiyat | Tahmini En Düşük Fiyat | Artış Oranı (%) |
|---|---|---|---|---|
| 2025 | 0,4193834 | 0,32014 | 0,1984868 | 0 |
| 2026 | 0,384552168 | 0,3697617 | 0,325390296 | 15 |
| 2027 | 0,45635989014 | 0,377156934 | 0,25646671512 | 17 |
| 2028 | 0,5667914404152 | 0,41675841207 | 0,3584122343802 | 30 |
| 2029 | 0,71307364305177 | 0,4917749262426 | 0,265558460171004 | 53 |
| 2030 | 0,644593984572487 | 0,602424284647185 | 0,506036399103635 | 88 |
IV. Yatırım Stratejisi Karşılaştırması: KUB vs TRX
Uzun Vadeli vs Kısa Vadeli Yatırım Stratejileri
- KUB: Bölgesel borsa ekosistemi ve Tayland piyasasının büyümesinden yararlanmak isteyen yatırımcılar için uygundur
- TRX: Yaygın kabul görmüş, yerleşik DeFi altyapısı arayan yatırımcılar için uygundur
Risk Yönetimi ve Varlık Dağılımı
- Korunaklı yatırımcılar: KUB %20 / TRX %80
- Agresif yatırımcılar: KUB %40 / TRX %60
- Koruma araçları: Stablecoin tahsisi, opsiyonlar, çapraz döviz portföyleri
V. Potansiyel Risk Karşılaştırması
Piyasa Riski
- KUB: Tayland pazarında yoğunlaşma, sınırlı küresel erişim
- TRX: Daha geniş piyasa erişimi nedeniyle daha yüksek volatilite
Teknik Risk
- KUB: Ölçeklenebilirlik ve ağ istikrarı riskleri
- TRX: Madencilikte merkezileşme ve güvenlik açıkları
Düzenleyici Risk
- Küresel düzenleyici politikalar, her iki token üzerinde farklı etkiler yaratıyor
VI. Sonuç: Hangisi Daha İyi Alım Fırsatı?
📌 Yatırım Değeri Özeti:
- KUB avantajları: Güçlü bölgesel varlık, Güneydoğu Asya pazarında büyüme potansiyeli
- TRX avantajları: Yerleşik ekosistem, yaygın benimsenme, yüksek likidite
✅ Yatırım Tavsiyesi:
- Yeni yatırımcılar: Bölgesel maruziyet için KUB’a küçük, istikrar için TRX’e büyük pay ayırmayı değerlendirebilir
- Deneyimli yatırımcılar: Portföylerini iki token ile dengeleyip risk toleransına göre ayarlayabilirler
- Kurumsal yatırımcılar: Likidite ve yerleşik piyasa varlığı için TRX’e odaklanıp, çeşitlendirme için KUB’u portföye dahil edebilirler
⚠️ Risk Uyarısı: Kripto para piyasaları son derece dalgalıdır. Bu makale yatırım tavsiyesi niteliğinde değildir. None
VII. SSS
S1: KUB ve TRX arasındaki temel farklar nelerdir? C: KUB ağırlıklı olarak Tayland pazarı ve Bitkub borsa ekosistemine odaklanırken, arzı 1 milyar token ile sınırlıdır. TRX ise daha geniş küresel varlığa, enflasyonist modele ve gelişmiş bir ekosisteme sahiptir; DeFi, NFT ve akıllı sözleşmelerde kapsamlı uygulamalar sunar.
S2: Hangi kripto para daha fazla fiyat istikrarı göstermiştir? C: TRX, KUB’a göre daha fazla fiyat istikrarı ve büyüme sergilemiştir. KUB tüm zamanların en yüksek değerinden ciddi şekilde gerilemişken, TRX daha dirençli ve istikrarlı bir büyüme sunmuştur.
S3: KUB ve TRX’in ekosistemleri nasıl karşılaştırılabilir? C: TRX, çok sayıda DeFi uygulaması, NFT ve akıllı sözleşme işlevselliği ile daha gelişmiş bir ekosisteme sahiptir. KUB’un ekosistemi ise esas olarak Bitkub borsası ve Tayland piyasası hizmetlerine odaklanır.
S4: KUB ve TRX’in yatırım değerini etkileyen başlıca faktörler nelerdir? C: Temel faktörler; arz mekanizması, kurumsal benimsenme, teknik gelişim, ekosistem oluşumu, makroekonomik koşullar ve piyasa döngüleridir. TRX, daha yaygın benimsenme ve yerleşik varlığı sayesinde çoğu alanda avantajlıdır.
S5: KUB ve TRX’in uzun vadeli fiyat tahminleri nasıl karşılaştırılır? C: 2030 yılına kadar KUB için iyimser senaryoda 1,98 $ - 2,80 $; TRX için ise 0,51 $ - 0,64 $ seviyelerine ulaşması beklenmektedir. Bu tahminler piyasa volatilitesine tabidir ve yatırım tavsiyesi niteliği taşımaz.
S6: Farklı yatırımcı tipleri için hangi kripto para daha uygundur? C: Yeni yatırımcılar istikrar için TRX’e daha fazla, bölgesel maruziyet için KUB’a daha az pay ayırabilir. Deneyimli yatırımcılar portföylerini iki token ile dengeleyebilir. Kurumsal yatırımcılar likidite ve yerleşik piyasa varlığı nedeniyle TRX’e ağırlık verebilir.
S7: KUB ve TRX yatırımlarında başlıca riskler nelerdir? C: KUB için riskler; Tayland pazarında yoğunlaşma ve küresel erişimin sınırlı olmasıdır. TRX için riskler; daha yüksek volatilite ve madencilikte merkezileşme olasılığıdır. Her iki varlık da ülkeye göre değişen düzenleyici risklere açıktır.
Share
Content
Giriş: KUB ve TRX Yatırım Karşılaştırması
I. Fiyat Geçmişi Karşılaştırması ve Güncel Piyasa Durumu
II. KUB ve TRX’in Yatırım Değerini Belirleyen Temel Faktörler
III. 2025-2030 Fiyat Tahmini: KUB vs TRX
IV. Yatırım Stratejisi Karşılaştırması: KUB vs TRX
V. Potansiyel Risk Karşılaştırması
VI. Sonuç: Hangisi Daha İyi Alım Fırsatı?
VII. SSS
How to Buy Cryptocurrency


Trending Cryptocurrencies


2025 JST Fiyat Tahmini: JUST Token’ın Gelecekteki Piyasa Trendleri ve Büyüme Potansiyeli Analizi

2025 RSR Fiyat Tahmini: Piyasa Trendleri, Teknolojik Gelişmeler ve Regülasyonun RSR’nin Gelecekteki Değeri Üzerindeki Etkisi

OKB (OKB) iyi bir yatırım mı?: OKX borsa tokeninin potansiyeli ve risklerinin analizi

Polkadot (DOT) iyi bir yatırım mı?: Gelişen kripto dünyasında bu çoklu zincir ağının potansiyeli üzerine analiz

FST ve VET: Finansal Hizmet Teknolojileri ile Veterinerlik Eğitim ve Öğretim Sistemlerinin Karşılaştırmalı Analizi
Swarms (SWARMS) iyi bir yatırım mı?: 2023 yılında yükselen bu kripto varlığın potansiyeli ve risklerinin analizi

Dropee Günlük Kombinasyonu 9 Aralık 2025

Tomarket Günlük Kombinasyonu 9 Aralık 2025

Web3 Dünyasında Gerçek Varlıkların Tokenleştirilmesi Fırsatlarını Keşfedin

Lüks tutkunlarına özel, yat konseptli NFT koleksiyonlarını keşfedin
Verimli Kripto Musluk Yönetimi İçin En İyi Araçlar