KAVA vs DYDX: Comparing Two Major DeFi Platforms in the Crypto Ecosystem
Introduction: KAVA vs DYDX Investment Comparison
In the cryptocurrency market, the comparison between KAVA and DYDX has always been an unavoidable topic for investors. The two not only have significant differences in market cap ranking, application scenarios, and price performance, but also represent different positioning in the crypto asset space.
Kava (KAVA): Since its launch in 2019, it has gained market recognition for its cross-chain decentralized finance platform offering collateralized loans and stablecoin services.
dYdX (DYDX): Introduced in 2021, it has been hailed as a decentralized derivatives trading protocol, becoming one of the prominent players in the decentralized exchange space.
This article will comprehensively analyze the investment value comparison between KAVA and DYDX, focusing on historical price trends, supply mechanisms, institutional adoption, technological ecosystems, and future predictions, attempting to answer the question investors care about most:
"Which is the better buy right now?"
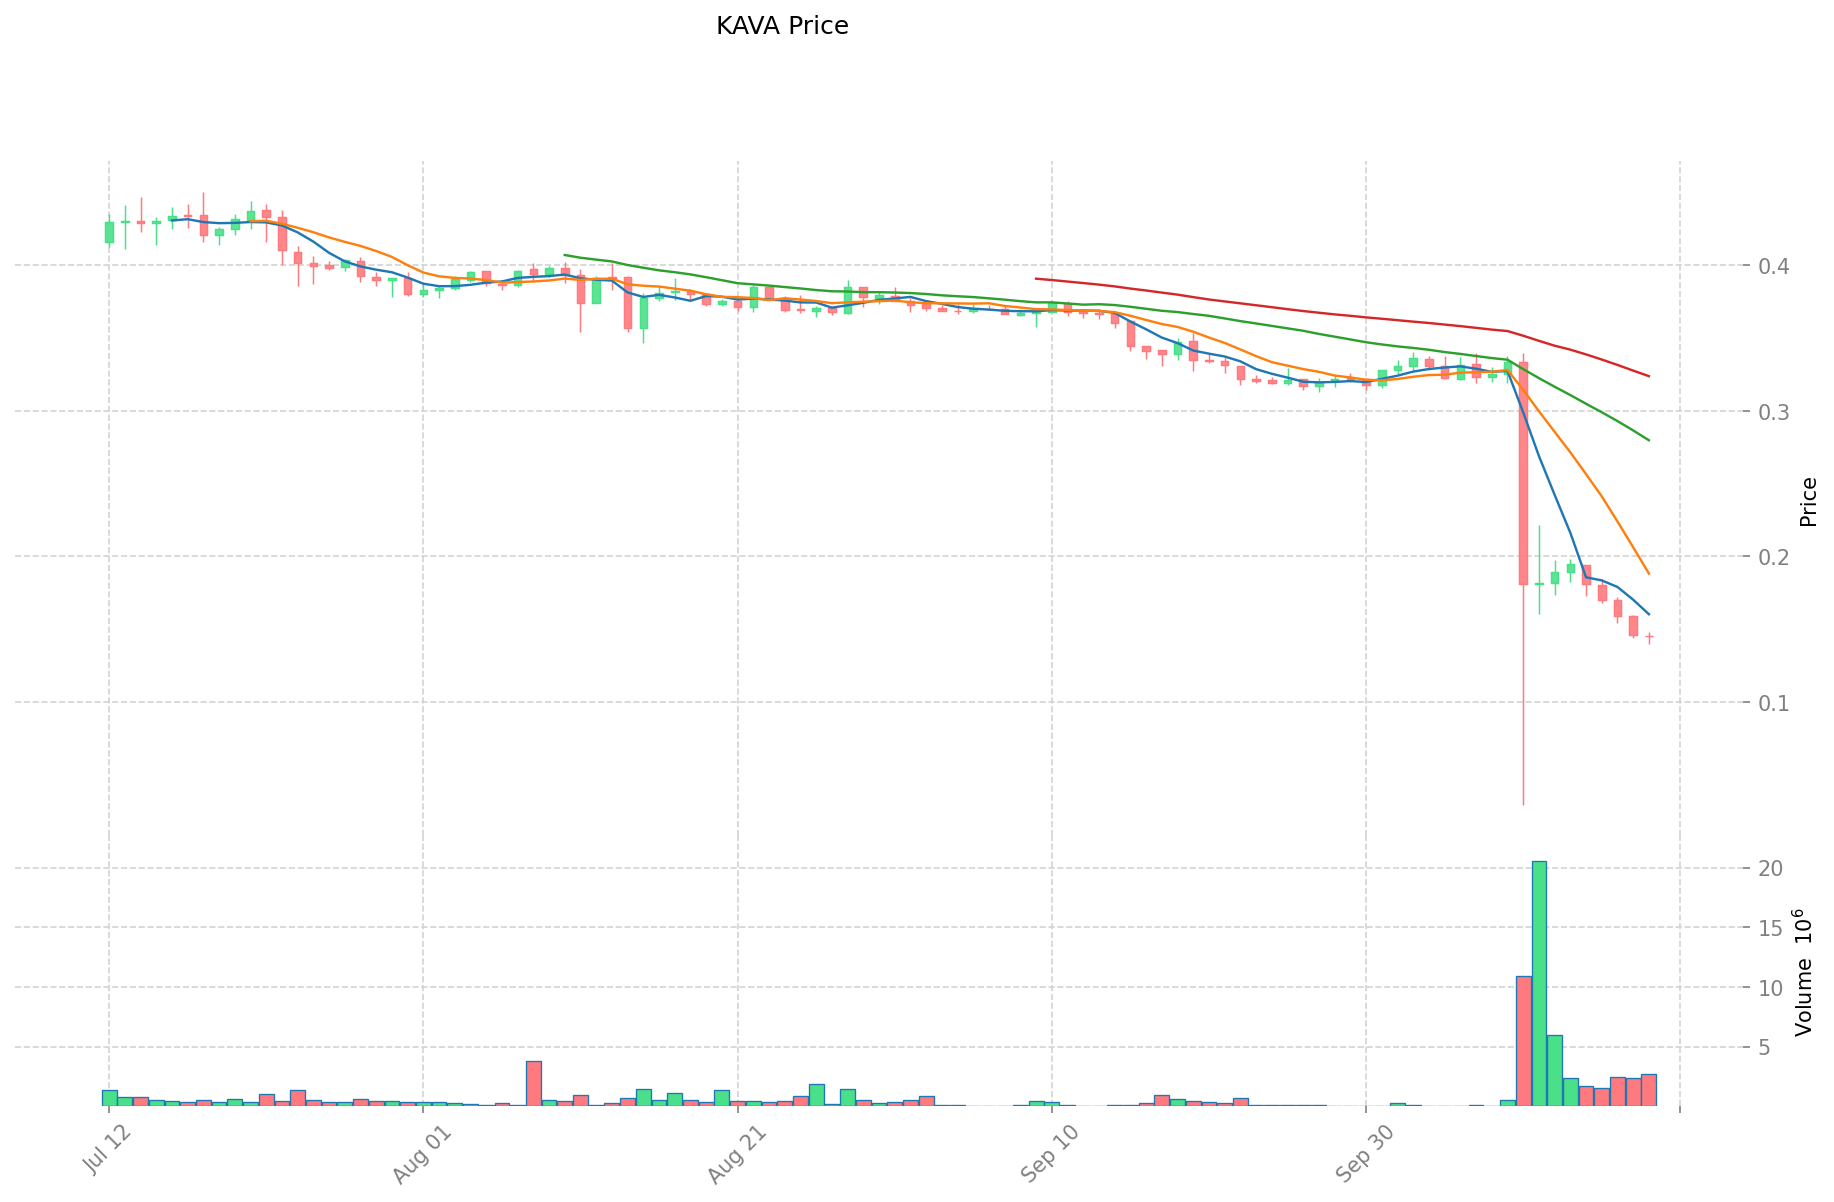
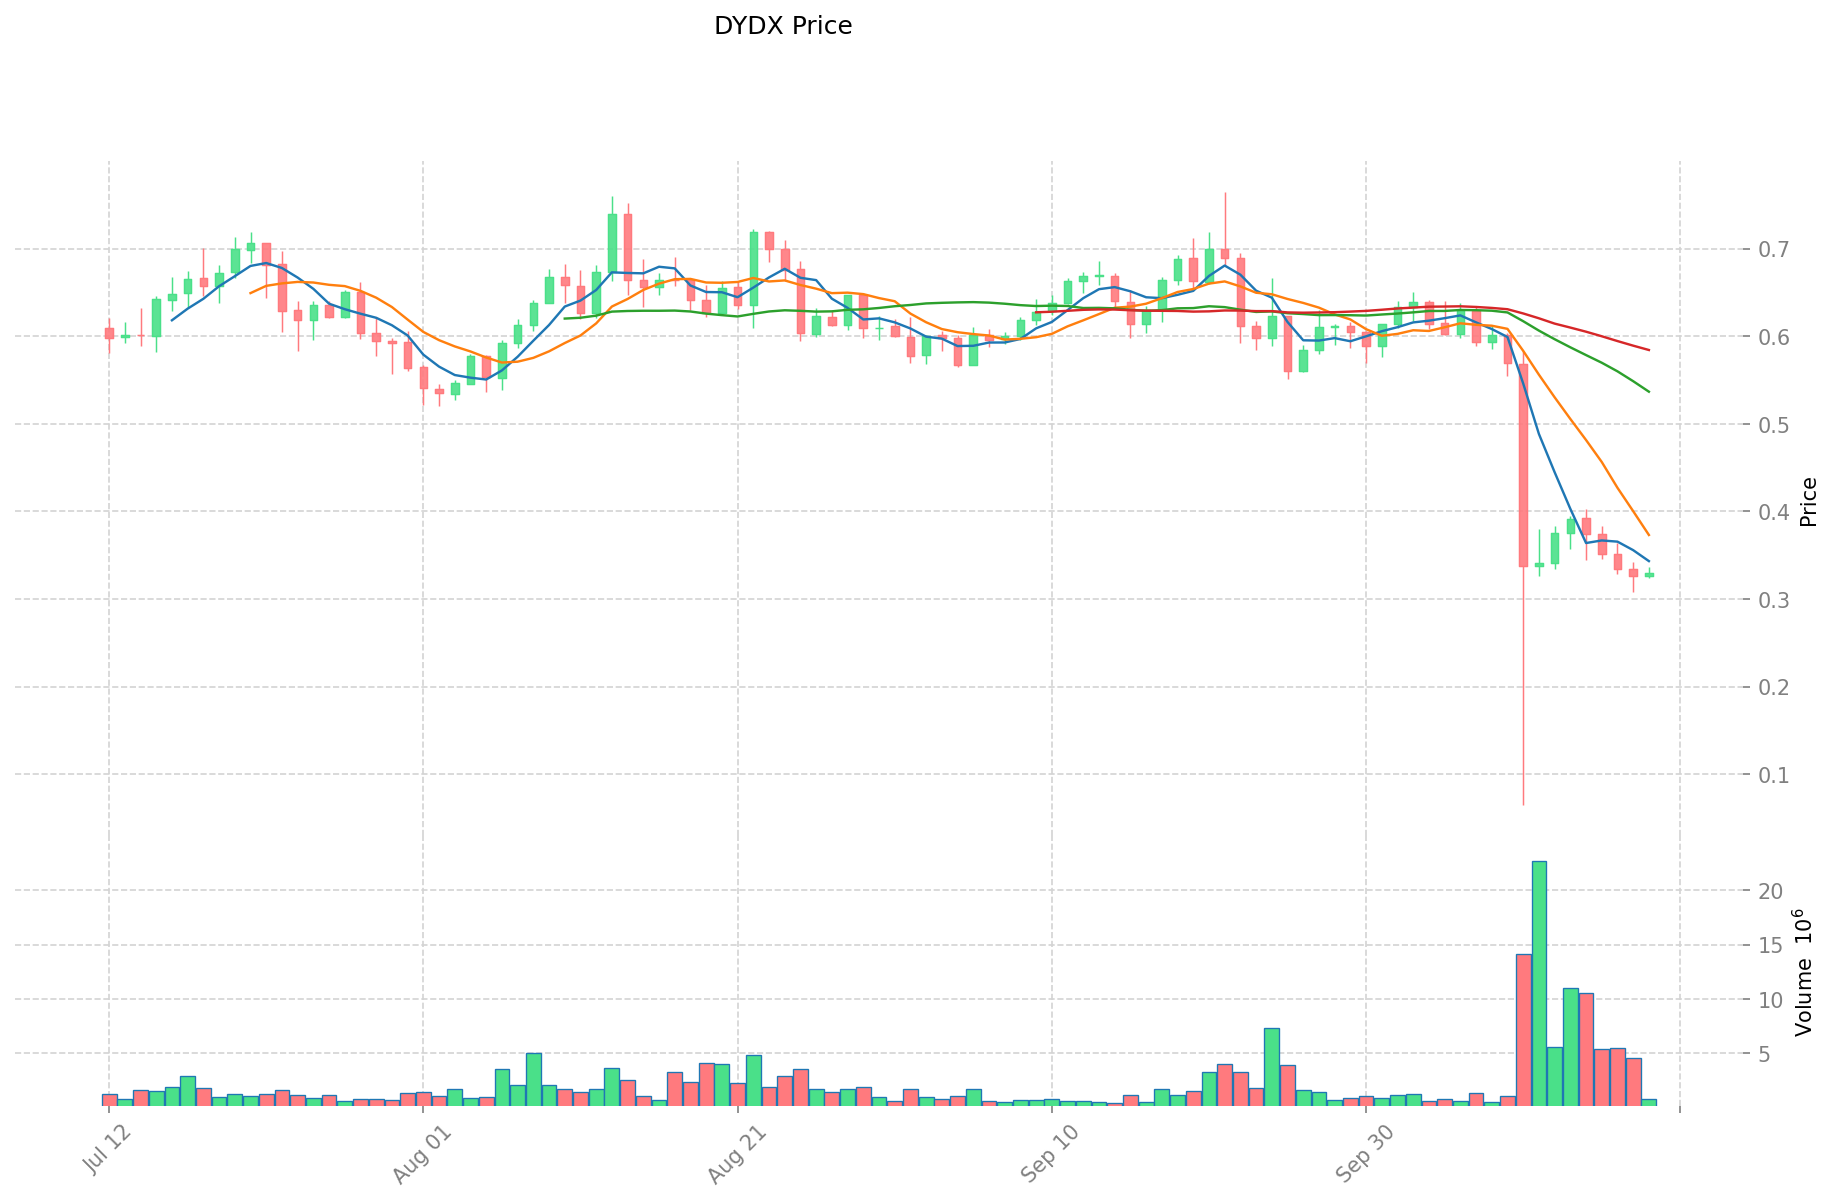
I. Price History Comparison and Current Market Status
KAVA and DYDX Historical Price Trends
- 2021: KAVA reached its all-time high of $9.12 on August 30, 2021.
- 2024: DYDX reached its all-time high of $4.52 on March 8, 2024.
- Comparative analysis: In the current market cycle, KAVA has fallen from its high of $9.12 to a low of $0.138058, while DYDX has dropped from $4.52 to a low of $0.126201.
Current Market Situation (2025-10-19)
- KAVA current price: $0.145
- DYDX current price: $0.3281
- 24-hour trading volume: KAVA $391,327.96 vs DYDX $260,898.40
- Market Sentiment Index (Fear & Greed Index): 23 (Extreme Fear)
Click to view real-time prices:
- View KAVA current price Market Price
- View DYDX current price Market Price
II. Key Factors Affecting Investment Value of KAVA vs DYDX
Supply Mechanism Comparison (Tokenomics)
- KAVA: Inflation model with initial supply of 122.23 million tokens, with inflation rate decreasing over time as protocol revenues increase
- dYdX: Fixed supply of 1 billion DYDX tokens distributed according to a predefined schedule, with 50% allocated to the community, 27.7% to investors, 15.3% to founders/employees, and 7% to future employees
- 📌 Historical pattern: KAVA's inflationary model has historically created selling pressure, while DYDX's fixed supply with strategic distribution has provided more price stability during accumulation periods.
Institutional Adoption and Market Applications
- Institutional holdings: dYdX has attracted more institutional interest with backing from major crypto VCs including a16z, Paradigm, and Three Arrows Capital
- Enterprise adoption: KAVA focuses on cross-chain lending across multiple blockchain assets, while dYdX specializes in perpetual futures trading with up to 20x leverage
- Regulatory stance: Both face similar regulatory challenges in the DeFi space, though dYdX's V4 migration to its own appchain on Cosmos may provide regulatory advantages
Technical Development and Ecosystem Building
- KAVA technical upgrades: Launched Kava 10 mainnet with Ethereum Co-Chain, enabling both Cosmos SDK and EVM functionality in a single blockchain architecture
- dYdX technical development: Migration to dYdX Chain (V4) built on Cosmos SDK/Tendermint, moving from Ethereum L2 to a standalone appchain for better performance
- Ecosystem comparison: KAVA supports DeFi primitives across multiple chains with $2.1B in assets originated, while dYdX focuses on derivatives trading with over $1 trillion in trading volume and 50% of DEX perpetual volume
Macroeconomic Factors and Market Cycles
- Inflation environment performance: Both tokens face challenges in high inflation environments as speculative DeFi assets
- Macroeconomic monetary policy: Interest rate hikes have historically pressured both tokens, with dYdX showing somewhat more resilience due to trading fee revenue
- Geopolitical factors: dYdX benefits from increased market volatility and cross-border trading demand, while KAVA's multi-chain approach helps diversify geopolitical risks
III. 2025-2030 Price Prediction: KAVA vs DYDX
Short-term Prediction (2025)
- KAVA: Conservative $0.0924-$0.1445 | Optimistic $0.1445-$0.1532
- DYDX: Conservative $0.3114-$0.3278 | Optimistic $0.3278-$0.3999
Mid-term Prediction (2027)
- KAVA may enter a growth phase, with estimated prices of $0.1359-$0.2096
- DYDX may enter a consolidation phase, with estimated prices of $0.2593-$0.4401
- Key drivers: Institutional capital inflow, ETF, ecosystem development
Long-term Prediction (2030)
- KAVA: Base scenario $0.2455-$0.2909 | Optimistic scenario $0.2909-$0.3314
- DYDX: Base scenario $0.2707-$0.4834 | Optimistic scenario $0.4834-$0.6430
Disclaimer: This analysis is based on historical data and market projections. Cryptocurrency markets are highly volatile and unpredictable. This information should not be considered as financial advice. Always conduct your own research before making investment decisions.
KAVA:
| 年份 | 预测最高价 | 预测平均价格 | 预测最低价 | 涨跌幅 |
|---|---|---|---|---|
| 2025 | 0.1532018 | 0.14453 | 0.0924992 | 0 |
| 2026 | 0.17863908 | 0.1488659 | 0.129513333 | 2 |
| 2027 | 0.2096031872 | 0.16375249 | 0.1359145667 | 12 |
| 2028 | 0.274416422742 | 0.1866778386 | 0.16801005474 | 28 |
| 2029 | 0.26051825765823 | 0.230547130671 | 0.19827053237706 | 58 |
| 2030 | 0.33146913712223 | 0.245532694164615 | 0.208702790039922 | 69 |
DYDX:
| 年份 | 预测最高价 | 预测平均价格 | 预测最低价 | 涨跌幅 |
|---|---|---|---|---|
| 2025 | 0.399916 | 0.3278 | 0.31141 | 0 |
| 2026 | 0.42207528 | 0.363858 | 0.19284474 | 10 |
| 2027 | 0.4401226368 | 0.39296664 | 0.2593579824 | 19 |
| 2028 | 0.495688119696 | 0.4165446384 | 0.29158124688 | 26 |
| 2029 | 0.51085034453376 | 0.456116379048 | 0.35120961186696 | 39 |
| 2030 | 0.64303287118187 | 0.48348336179088 | 0.270750682602892 | 47 |
IV. Investment Strategy Comparison: KAVA vs DYDX
Long-term vs Short-term Investment Strategy
- KAVA: Suitable for investors focused on cross-chain DeFi and ecosystem potential
- DYDX: Suitable for traders seeking exposure to decentralized derivatives markets
Risk Management and Asset Allocation
- Conservative investors: KAVA: 30% vs DYDX: 70%
- Aggressive investors: KAVA: 60% vs DYDX: 40%
- Hedging tools: Stablecoin allocation, options, cross-token portfolio
V. Potential Risks Comparison
Market Risks
- KAVA: Vulnerability to overall DeFi market sentiment and cross-chain competition
- DYDX: Exposure to derivatives market volatility and trading volume fluctuations
Technical Risks
- KAVA: Scalability, network stability across multiple chains
- DYDX: Smart contract vulnerabilities, liquidity risks in extreme market conditions
Regulatory Risks
- Global regulatory policies may impact both, with DYDX potentially facing more scrutiny due to its focus on derivatives trading
VI. Conclusion: Which Is the Better Buy?
📌 Investment Value Summary:
- KAVA advantages: Cross-chain DeFi capabilities, diverse ecosystem, potential for growth in multi-chain environments
- DYDX advantages: Strong position in decentralized derivatives, institutional backing, potential for increased trading volume
✅ Investment Advice:
- New investors: Consider a balanced approach with a slight preference for DYDX due to its more established market position
- Experienced investors: Explore opportunities in both, with KAVA for long-term ecosystem growth and DYDX for trading-focused strategies
- Institutional investors: DYDX may be more attractive due to its institutional backing and focus on high-volume trading markets
⚠️ Risk Warning: The cryptocurrency market is highly volatile, and this article does not constitute investment advice. None
VII. FAQ
Q1: What are the main differences between KAVA and DYDX? A: KAVA is a cross-chain DeFi platform offering collateralized loans and stablecoin services, while DYDX is a decentralized derivatives trading protocol. KAVA focuses on multi-chain lending, while DYDX specializes in perpetual futures trading with leverage.
Q2: Which token has performed better historically? A: DYDX has shown more price stability and resilience compared to KAVA. KAVA reached its all-time high of $9.12 in August 2021, while DYDX hit its peak of $4.52 in March 2024. However, both have experienced significant declines from their all-time highs.
Q3: How do their supply mechanisms differ? A: KAVA uses an inflationary model with an initial supply of 122.23 million tokens, while DYDX has a fixed supply of 1 billion tokens distributed according to a predefined schedule.
Q4: Which token has more institutional adoption? A: DYDX has attracted more institutional interest, with backing from major crypto venture capital firms like a16z, Paradigm, and Three Arrows Capital.
Q5: What are the key technical developments for each platform? A: KAVA launched its Kava 10 mainnet with Ethereum Co-Chain, enabling both Cosmos SDK and EVM functionality. DYDX is migrating to its own appchain (V4) built on Cosmos SDK/Tendermint for improved performance.
Q6: What are the long-term price predictions for KAVA and DYDX? A: By 2030, KAVA's base scenario price range is estimated at $0.2455-$0.2909, while DYDX's base scenario range is $0.2707-$0.4834. However, these predictions are subject to market volatility and should not be considered financial advice.
Q7: Which token might be a better investment for different types of investors? A: New investors might consider a balanced approach with a slight preference for DYDX due to its established market position. Experienced investors could explore both, with KAVA for long-term ecosystem growth and DYDX for trading-focused strategies. Institutional investors may find DYDX more attractive due to its institutional backing and focus on high-volume trading markets.
Share
Content