INTER vs XLM: Kripto Para Borsaları Dünyasında İki Dev Arasındaki Karşılaştırma

Giriş: INTER ve XLM Yatırım Karşılaştırması
Kripto para piyasasında INTER ile XLM’in karşılaştırılması, yatırımcıların sıklıkla gündeminde olan bir konudur. Bu iki varlık; piyasa değeri sıralaması, kullanım alanları ve fiyat performansı açısından belirgin farklar gösterirken, kripto varlıkların piyasadaki farklı konumlarını da yansıtmaktadır.
Inter Milan Fan Token (INTER): 2021 yılında piyasaya çıkan bu token, Inter Milan futbol kulübünün taraftar token’ı olarak hızla piyasa kabulü görmüştür.
Stellar (XLM): 2014’ten bu yana hızlı ve düşük maliyetli uluslararası transferler için ön plana çıkan ve küresel işlem hacmi ile piyasa değerinde üst sıralarda yer alan bir kripto paradır.
Bu makalede INTER ile XLM’in yatırım değerleri; tarihsel fiyat trendleri, arz mekanizmaları, kurumsal kullanım, teknolojik ekosistemler ve gelecek öngörüleri doğrultusunda kapsamlı şekilde analiz edilmekte, yatırımcıların en çok merak ettiği şu soruya odaklanılmaktadır:
"Şu anda hangisinin alımı daha avantajlı?"
I. Fiyat Geçmişi ve Güncel Piyasa Durumu
INTER ve XLM Tarihsel Fiyat Trendleri
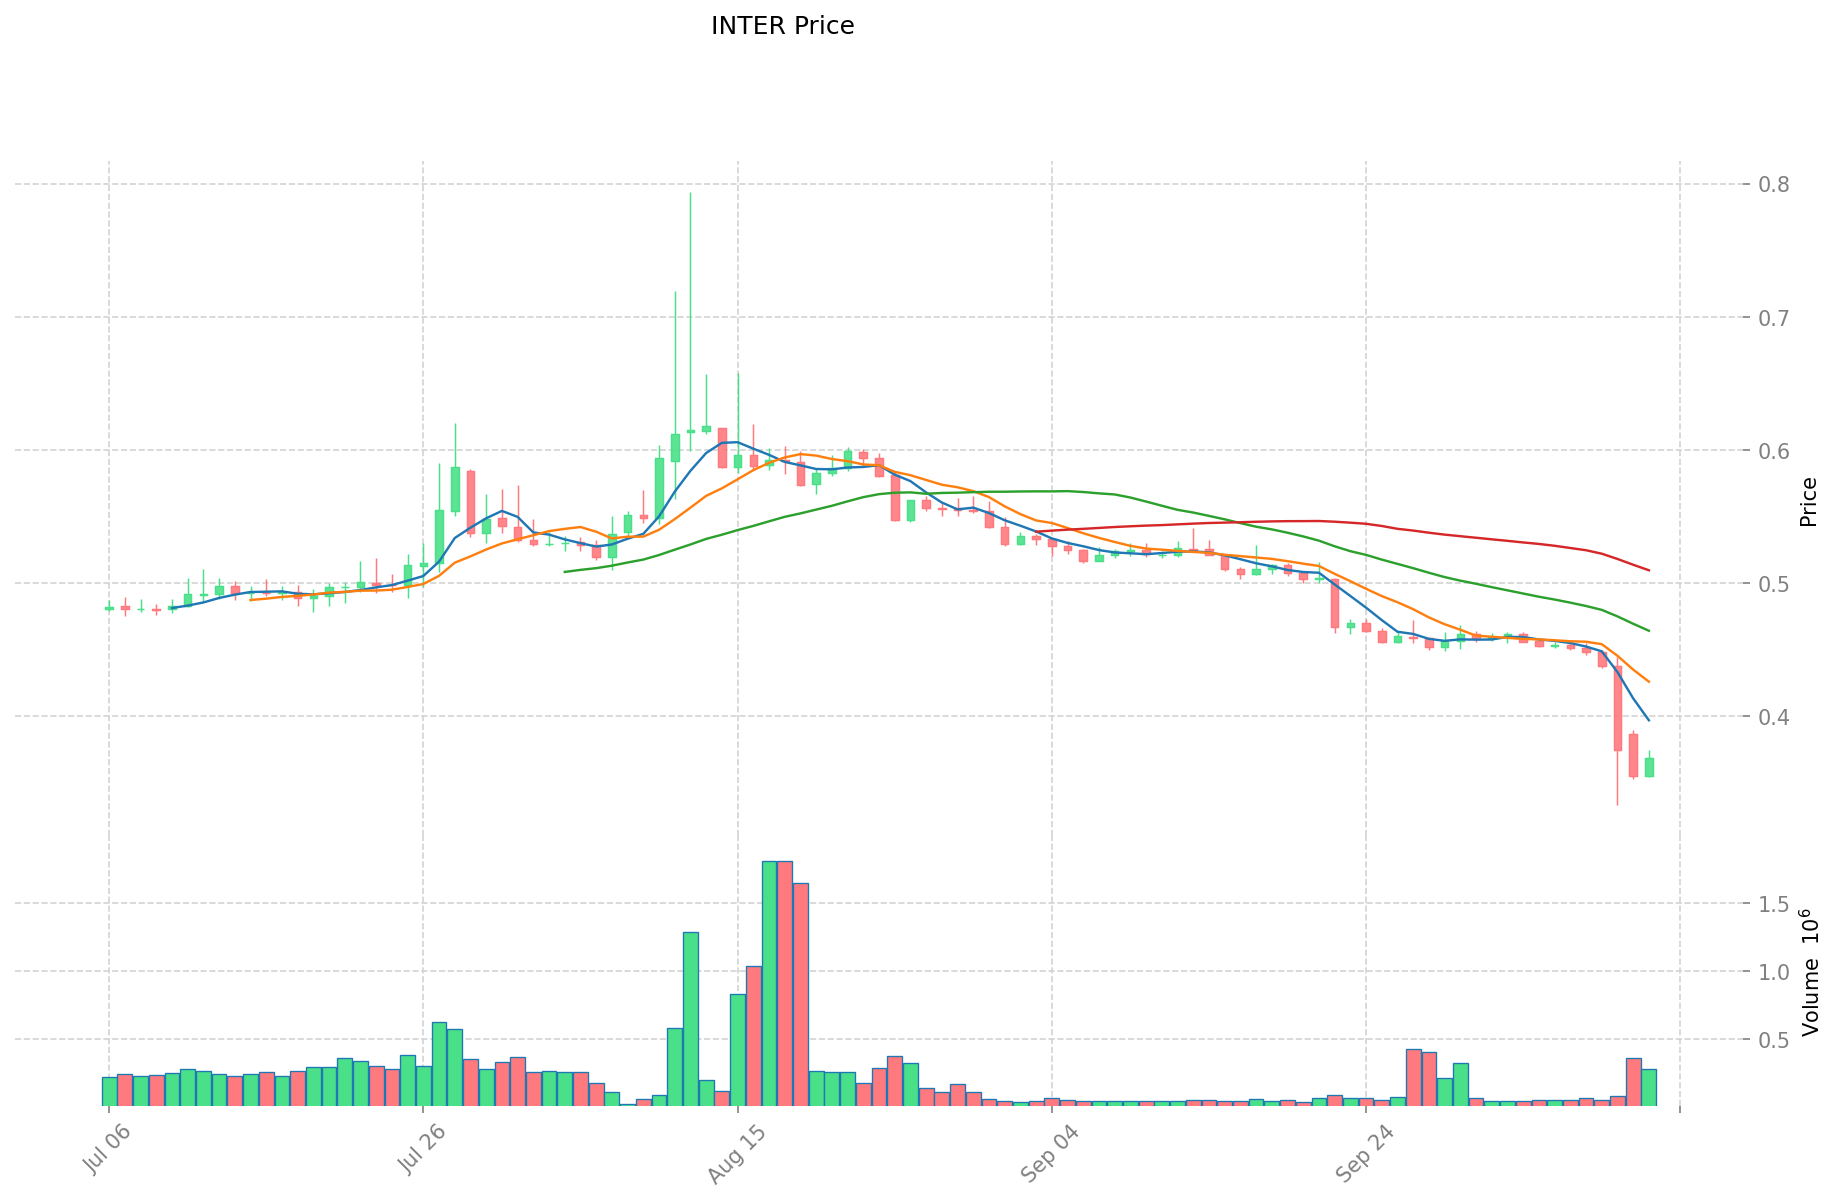
- 2021: INTER, Inter Milan Fan Token’ın lansmanı ile 13,21 $’a çıkarak tüm zamanların en yükseğini gördü.
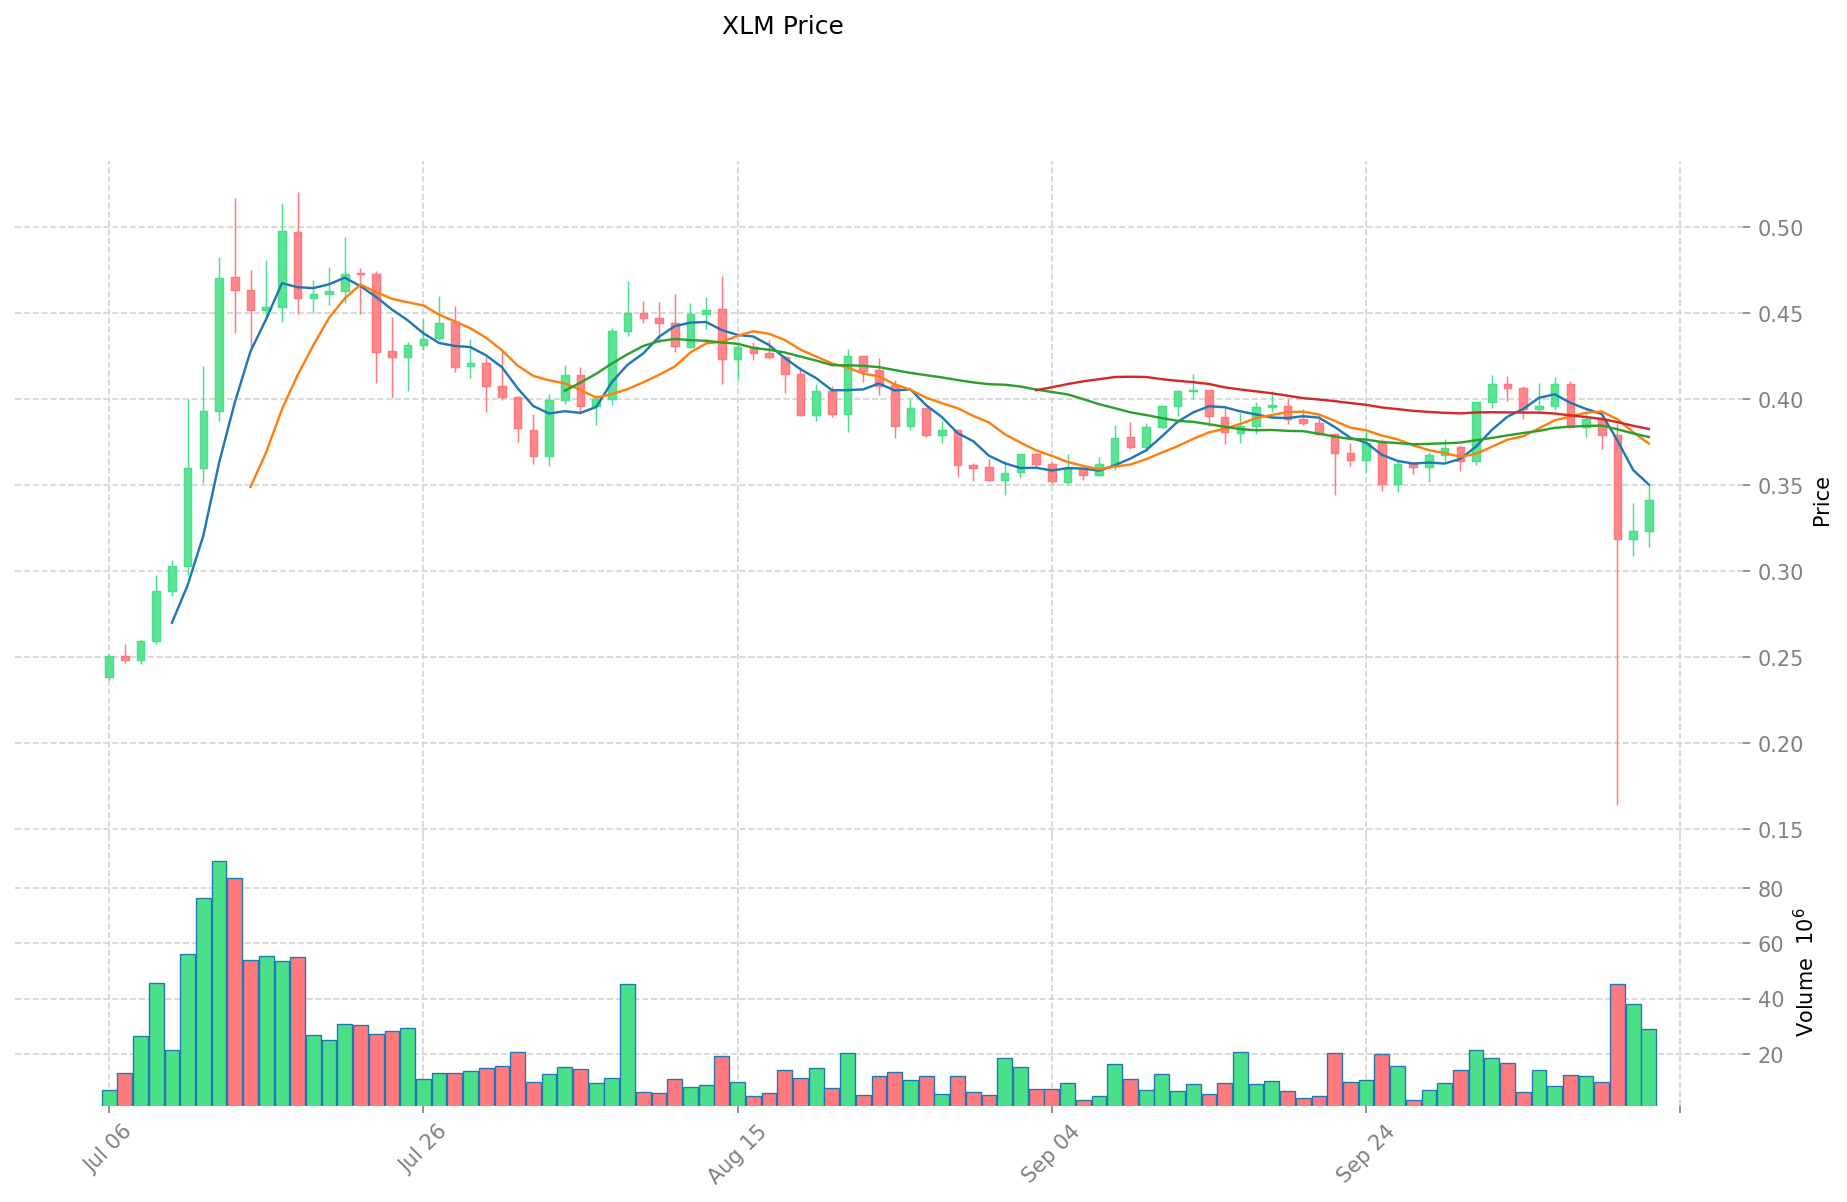
- 2018: XLM, kripto para piyasasında boğa döneminde 0,875563 $ ile zirve yaptı.
- Karşılaştırmalı analiz: Son piyasa döngüsünde INTER, 13,21 $ seviyesinden 0,356046 $’a inerken, XLM 0,875563 $’dan 0,00047612 $’ya kadar geriledi.
Güncel Piyasa Durumu (13 Ekim 2025)
- INTER güncel fiyat: 0,3685 $
- XLM güncel fiyat: 0,34171 $
- 24 saatlik işlem hacmi: INTER 103.708,76 $ | XLM 9.513.199,16 $
- Piyasa Duyarlılık Endeksi (Korku & Açgözlülük): 24 (Aşırı Korku)
Anlık fiyatlar için tıklayın:
- INTER güncel fiyatı Piyasa Fiyatı
- XLM güncel fiyatı Piyasa Fiyatı
II. INTER ve XLM Yatırım Değerini Etkileyen Temel Faktörler
Arz Mekanizmaları Karşılaştırması (Tokenomik)
- INTER: Blokzincir ekosisteminde işlevsel bir token olarak, değerini kullanım alanları ve benimsenme düzeyinden alır.
- XLM: Öncelikle farklı varlıklar arasında sınır ötesi transferler ve değer değişimi için tasarlanmış dijital bir para birimidir.
- 📌 Tarihsel eğilim: Arz mekanizması ve tokenomik, kıtlık ve işlevsellik üzerinden fiyat döngülerini belirlemede anahtar rol oynar.
Kurumsal Benimseme ve Piyasa Uygulamaları
- Kurumsal Varlık: Her iki varlığa ilişkin kurumsal ilgi sınırlı ve değişken görünmektedir.
- Kurumsal Kullanım: Her iki varlık, dijital varlık ticaretinde temel işlem çiftleri olarak değer sabitlenmesinde rol oynar.
- Regülasyon: Yasal düzenlemeler ülkeye göre değiştiğinden, varlıkların benimsenme potansiyelini etkiler.
Teknolojik Gelişim ve Ekosistem Oluşumu
- Teknoloji Entegrasyonu: Her iki varlık, varlık takibi ve doğrulama gibi blokzincir uygulamaları ile geniş ekosistemde yer alır.
- Blokzincir Uyumluluğu: Dijital varlık ticaretinin temel yapıtaşları olan işlem çiftleri, güvenlik ve verimlilik için blokzincir altyapısına dayanır.
- Ekosistem Karşılaştırması: Her iki varlık, Katman 2 çözümler, zincirler arası teknolojiler ve dağıtık depolama gibi blokzincir inovasyonlarıyla bütünleşmektedir.
Makroekonomik Faktörler ve Piyasa Döngüleri
- Piyasa Volatilitesi: Finansal piyasalardaki dalgalanmalar kripto para fiyatlarını etkiler; yatırımcılar bu etkiyi dikkate almalıdır.
- Portföy Yaklaşımı: Her iki varlık, çeşitlendirilmiş yatırım portföylerinde farklı amaçlara hizmet edebilir.
- Küresel Ekonomik Koşullar: Piyasa riskleri yatırım kararlarına yön verir; dikkatli yaklaşım ve kapsamlı analiz şarttır.
III. 2025-2030 Dönemi Fiyat Tahmini: INTER ve XLM
Kısa Vadeli Tahmin (2025)
- INTER: Muhafazakâr 0,290957 $ – 0,3683 $ | İyimser 0,3683 $ – 0,456692 $
- XLM: Muhafazakâr 0,2182144 $ – 0,34096 $ | İyimser 0,34096 $ – 0,5012112 $
Orta Vadeli Tahmin (2027)
- INTER, büyüme evresine girebilir; tahmini fiyat aralığı 0,4324401816 $ – 0,596469216 $
- XLM, konsolidasyon aşamasına geçebilir; tahmini fiyat aralığı 0,22334380224 $ – 0,44239253136 $
- Başlıca etkenler: Kurumsal fon girişleri, ETF’ler, ekosistem büyümesi
Uzun Vadeli Tahmin (2030)
- INTER: Temel senaryo 0,655090956135 $ – 0,7992109664847 $ | İyimser senaryo 0,7992109664847 $ üzeri
- XLM: Temel senaryo 0,52869826751742 $ – 0,671446799747123 $ | İyimser senaryo 0,671446799747123 $ üzeri
Yasal Uyarı: Bu tahminler geçmiş veriler ve piyasa analizlerine dayanmaktadır. Kripto para piyasaları aşırı dalgalanma gösterebilir. Buradaki bilgiler yatırım tavsiyesi niteliğinde değildir. Yatırım kararı öncesi kendi araştırmanızı yapınız.
INTER:
| 年份 | 预测最高价 | 预测平均价格 | 预测最低价 | 涨跌幅 |
|---|---|---|---|---|
| 2025 | 0.456692 | 0.3683 | 0.290957 | 0 |
| 2026 | 0.58161936 | 0.412496 | 0.34237168 | 11 |
| 2027 | 0.596469216 | 0.49705768 | 0.4324401816 | 34 |
| 2028 | 0.61784269624 | 0.546763448 | 0.53036054456 | 48 |
| 2029 | 0.72787884015 | 0.58230307212 | 0.349381843272 | 58 |
| 2030 | 0.7992109664847 | 0.655090956135 | 0.5633782222761 | 77 |
XLM:
| 年份 | 预测最高价 | 预测平均价格 | 预测最低价 | 涨跌幅 |
|---|---|---|---|---|
| 2025 | 0.5012112 | 0.34096 | 0.2182144 | 0 |
| 2026 | 0.437929024 | 0.4210856 | 0.265283928 | 23 |
| 2027 | 0.44239253136 | 0.429507312 | 0.22334380224 | 25 |
| 2028 | 0.479544913848 | 0.43594992168 | 0.414152425596 | 27 |
| 2029 | 0.59964911727084 | 0.457747417764 | 0.25633855394784 | 33 |
| 2030 | 0.671446799747123 | 0.52869826751742 | 0.396523700638065 | 54 |
IV. Yatırım Stratejisi: INTER ve XLM Karşılaştırması
Uzun Vadeli ve Kısa Vadeli Yatırım Yaklaşımı
- INTER: Spor odaklı dijital varlıklara ve taraftar etkileşimine ilgi duyan yatırımcılar için uygundur.
- XLM: Sınır ötesi ödeme çözümleri ve finansal kapsayıcılığa odaklanan yatırımcılar için idealdir.
Risk Yönetimi ve Varlık Dağılımı
- Temkinli yatırımcı: INTER %20, XLM %80
- Agresif yatırımcı: INTER %40, XLM %60
- Hedge araçları: Stablecoin tahsisi, opsiyonlar, döviz çeşitlendirmesi
V. Potansiyel Risk Karşılaştırması
Piyasa Riski
- INTER: Fiyat hareketliliği, spor etkinlikleri ve takım performansına bağlıdır.
- XLM: Daha geniş kripto para trendlerine karşı hassastır.
Teknik Risk
- INTER: Ölçeklenebilirlik ve ağ istikrarı
- XLM: Ağ tıkanıklığı ve potansiyel güvenlik açıkları
Yasal Risk
- Küresel yasal düzenlemeler, her iki varlık üzerinde farklı etkiler yaratabilir.
VI. Sonuç: Hangisi Daha Karlı Alım?
📌 Yatırım Değeri Özeti:
- INTER avantajları: Spor taraftar etkileşimi alanında niş pazar, fan token ekosisteminde büyüme potansiyeli
- XLM avantajları: Güçlü geçmiş, sınır ötesi işlemlere odaklanma, finans sektöründe yaygın kullanım
✅ Yatırım Tavsiyesi:
- Yeni yatırımcılar: XLM’nin köklü piyasa konumuna daha yüksek ağırlık vererek dengeli portföy oluşturabilir
- Tecrübeli yatırımcılar: Her iki varlıkta fırsat arayabilir, yüksek getiri için INTER’e ağırlık verebilir
- Kurumsal yatırımcılar: Portföy çeşitliliği ve risk yönetimi doğrultusunda her iki varlığı da değerlendirmeli
⚠️ Risk Uyarısı: Kripto para piyasası son derece dalgalıdır. Bu içerik yatırım tavsiyesi değildir. None
VII. Sıkça Sorulan Sorular
S1: INTER ile XLM arasındaki ana farklar nelerdir? C: INTER, Inter Milan futbol kulübünün taraftar token’ı; XLM ise hızlı ve düşük maliyetli sınır ötesi transferlere odaklanan bir kripto paradır. INTER’in piyasa değeri ve işlem hacmi daha düşük, XLM’in geçmişi daha uzun ve finansal sektörde daha yaygındır.
S2: Hangisi tarihsel olarak daha iyi fiyat performansı gösterdi? C: XLM, 2018’de 0,875563 $ ile zirve yaparken, INTER 2021’de 13,21 $ ile tepe yaptı. Her ikisi de bu zirvelerden sonra ciddi düşüşler yaşadı. 13 Ekim 2025 itibarıyla INTER 0,3685 $, XLM 0,34171 $ seviyesindedir.
S3: INTER ile XLM’in arz mekanizmaları nasıl farklı? C: INTER, özellikle taraftar etkileşimiyle bağlantılı blokzincir kullanım alanlarından değer kazanır. XLM ise esas olarak sınır ötesi transferler ve varlıklar arası değer değişimi için dijital para olarak konumlanmıştır.
S4: INTER ve XLM’in yatırım değerini belirleyen temel etkenler nelerdir? C: Arz mekanizmaları, kurumsal benimseme, piyasa uygulamaları, teknik gelişim, ekosistem oluşumu, makroekonomik faktörler ve piyasa döngüleri ana etkenlerdir. Yasal düzenlemeler ile küresel ekonomik ortam da belirleyici rol oynar.
S5: Uzun vadede INTER ve XLM için fiyat tahminleri nedir? C: 2030’da INTER için temel senaryo 0,655090956135 $ – 0,7992109664847 $, iyimser senaryo ise 0,7992109664847 $ üzeri; XLM için temel senaryo 0,52869826751742 $ – 0,671446799747123 $, iyimser senaryo ise 0,671446799747123 $ üzeridir.
S6: Yatırımcılar portföylerini INTER ve XLM arasında nasıl bölmeli? C: Temkinli yatırımcılar INTER’e %20, XLM’ye %80; agresif yatırımcılar INTER’e %40, XLM’ye %60 ayırabilir. Ancak, portföy dağılımı kişisel risk toleransı ve yatırım hedeflerine göre şekillenmelidir.
S7: INTER ve XLM yatırımlarında hangi riskler öne çıkıyor? C: Her iki varlıkta piyasa, teknik ve yasal riskler bulunur. INTER’in oynaklığı spor etkinlikleri ve takım başarısına bağlıyken, XLM genel kripto piyasa trendlerinden etkilenir. Teknik riskler arasında ölçeklenebilirlik ve ağ istikrarı yer alır.
Share
Content
Giriş: INTER ve XLM Yatırım Karşılaştırması
I. Fiyat Geçmişi ve Güncel Piyasa Durumu
II. INTER ve XLM Yatırım Değerini Etkileyen Temel Faktörler
III. 2025-2030 Dönemi Fiyat Tahmini: INTER ve XLM
IV. Yatırım Stratejisi: INTER ve XLM Karşılaştırması
V. Potansiyel Risk Karşılaştırması
VI. Sonuç: Hangisi Daha Karlı Alım?
VII. Sıkça Sorulan Sorular
How to Buy Cryptocurrency


Trending Cryptocurrencies


2025 CHZ Fiyat Tahmini: Spor Taraftar Token Ekosisteminde Chiliz’in Piyasa Trendleri ve Büyüme Potansiyelinin Değerlendirilmesi
OKB ve HBAR: Uzun Vadeli Yatırım Potansiyeli Bakımından İki Kripto Varlığın Karşılaştırılması

DRGN vs BAT: Kripto Oyun Sektöründe Liderlik Yarışı

2025 yılında TXC, token varlıklarını ve likidite akışını nasıl yönetiyor?
GME vs VET: Dalgalı kripto piyasasında GameStop ve VeChain'in yatırım potansiyelinin karşılaştırılması

2025 yılında Litecoin fiyat hareketlerini zincir üstü veri analizi nasıl öngörebilir?
Dropee Günlük Kombinasyonu 11 Aralık 2025
Tomarket Günlük Kombinasyonu 11 Aralık 2025

Merkeziyetsiz Finans'ta Geçici Kayıp Nedir?

Kripto Parada Çifte Harcama: Önleme Stratejileri

Kripto Ticaretinde Wyckoff Yönteminin Anlaşılması