GLQ vs OP: Exploring the Impact of Different Optimization Algorithms on Machine Learning Performance
Introduction: GLQ vs OP Investment Comparison
In the cryptocurrency market, the comparison between GraphLinq Protocol (GLQ) vs Optimism (OP) has been an unavoidable topic for investors. The two not only show significant differences in market cap ranking, application scenarios, and price performance, but also represent different positioning in crypto assets.
GraphLinq Protocol (GLQ): Since its launch in 2021, it has gained market recognition for its decentralized DeFi data monitoring and automation capabilities.
Optimism (OP): Introduced in 2022, it has been hailed as a low-cost, high-speed ETHereum Layer 2 solution, becoming one of the most widely adopted scaling platforms.
This article will provide a comprehensive analysis of the investment value comparison between GLQ and OP, focusing on historical price trends, supply mechanisms, institutional adoption, technological ecosystems, and future predictions, attempting to answer the question investors care about most:
"Which is the better buy right now?"
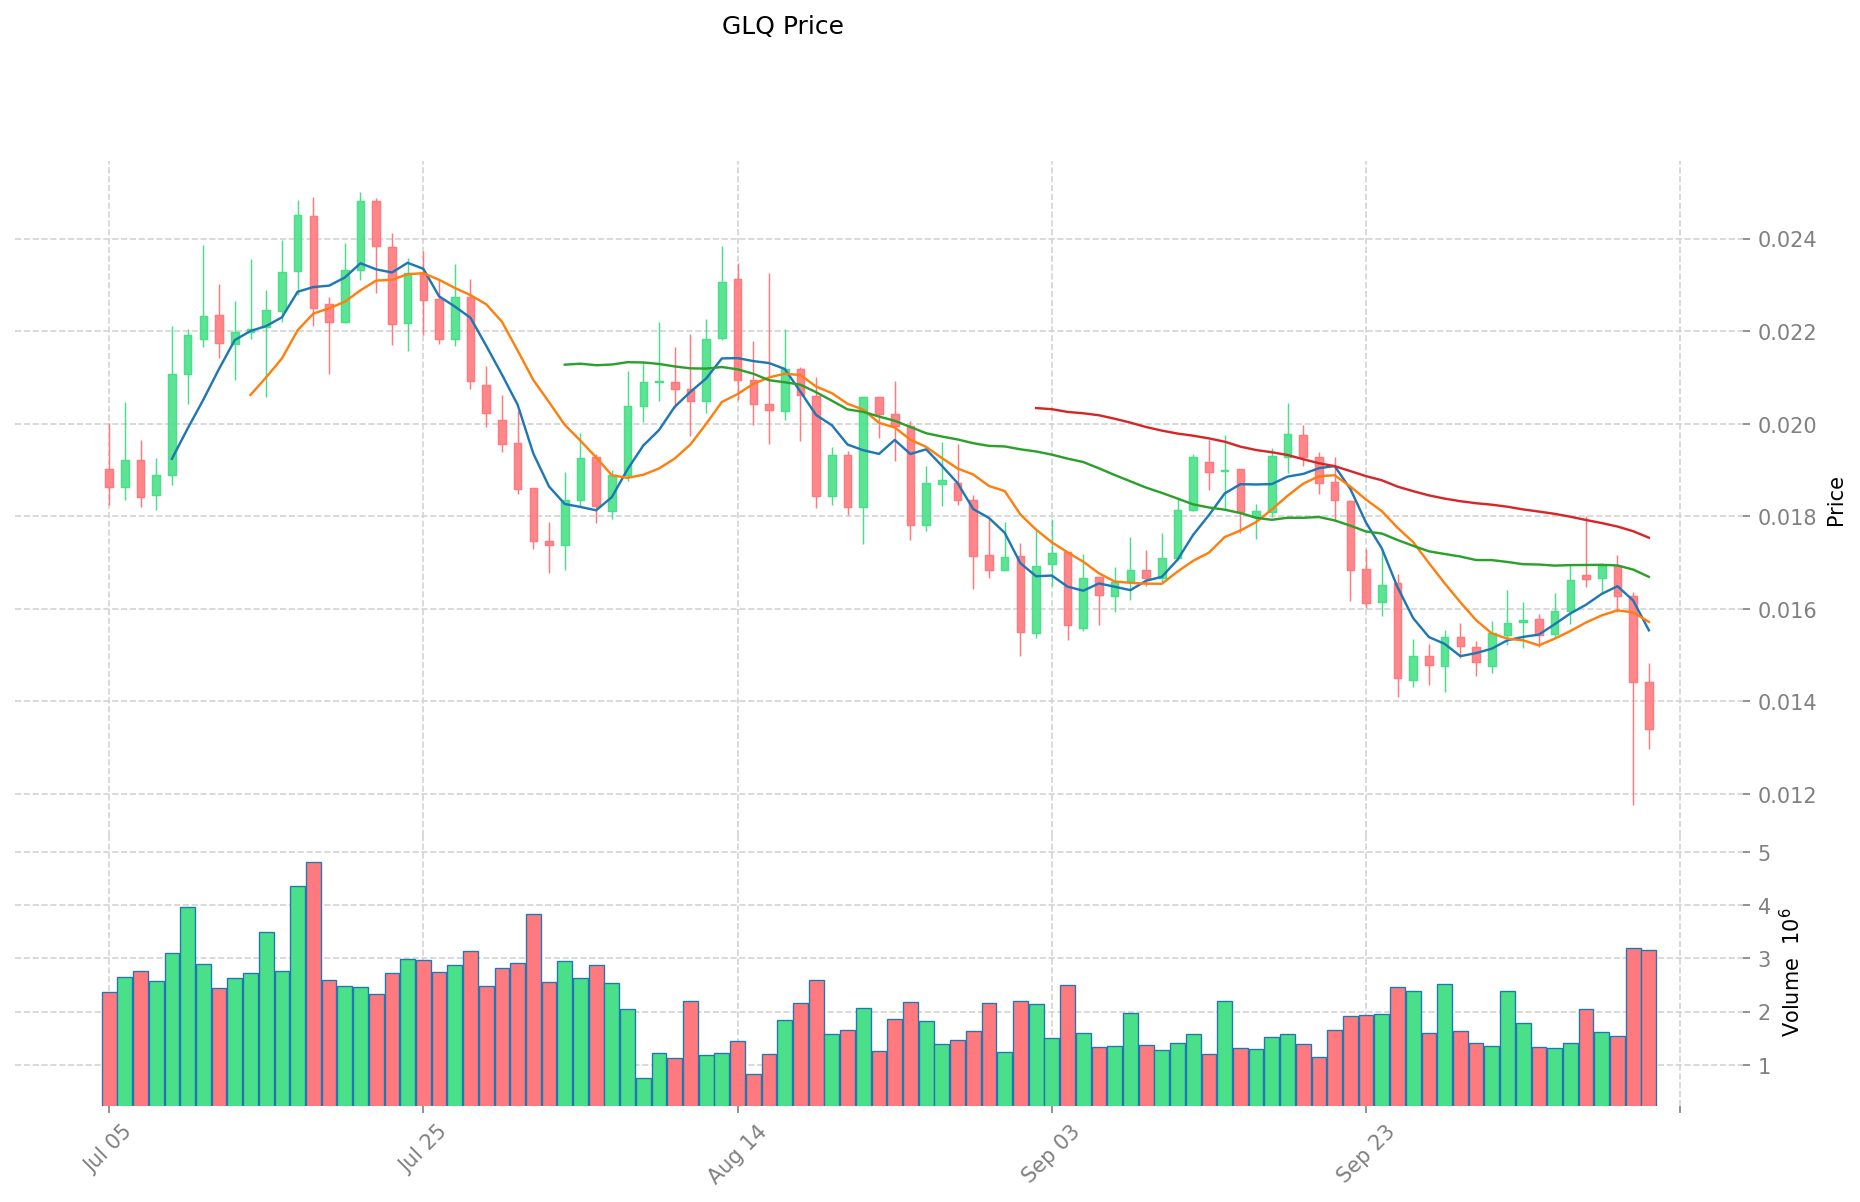
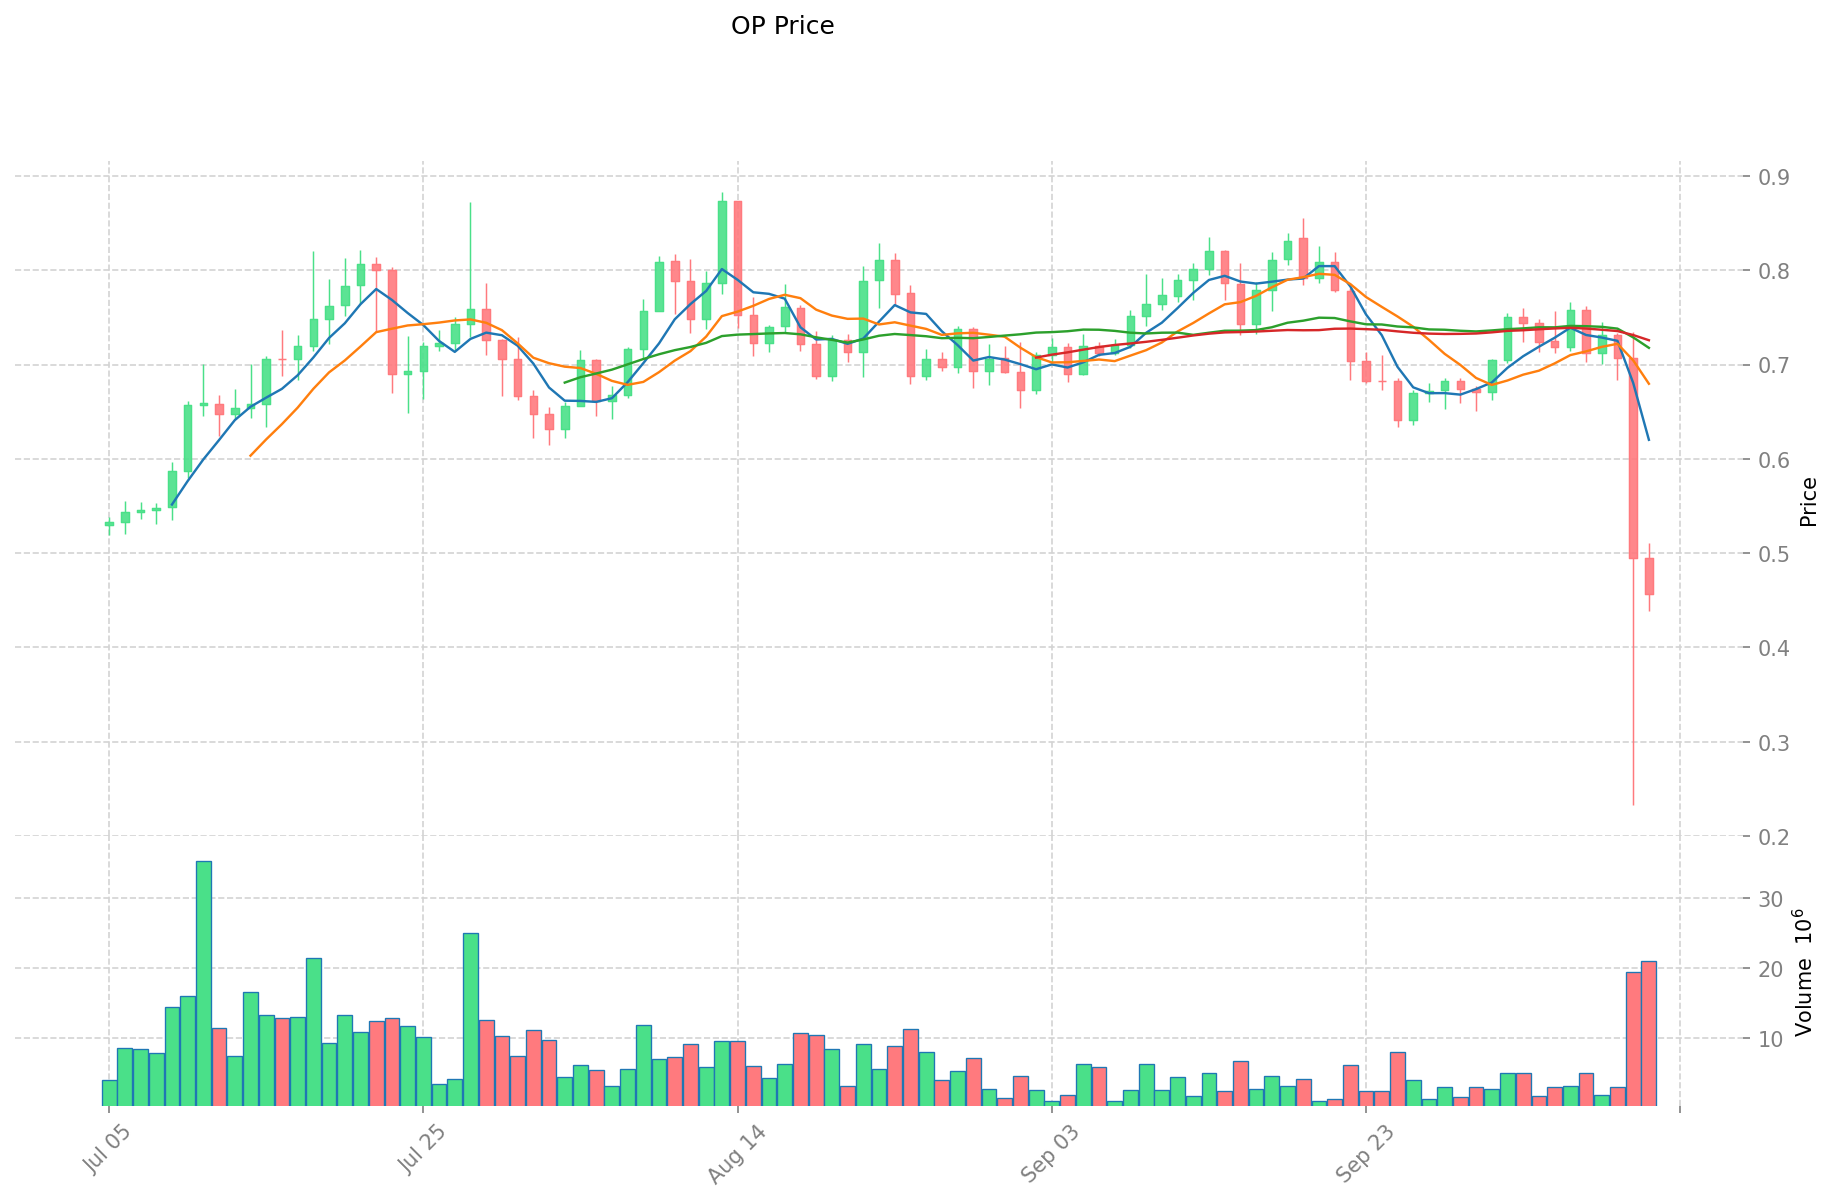
I. Price History Comparison and Current Market Status
GLQ and OP Historical Price Trends
- 2024: GLQ reached its all-time high of $0.19361 on March 18, 2024.
- 2024: OP achieved its all-time high of $4.84 on March 6, 2024.
- Comparative Analysis: In the recent market cycle, GLQ dropped from its high of $0.19361 to a current price of $0.01341, while OP declined from $4.84 to $0.4559.
Current Market Situation (2025-10-12)
- GLQ current price: $0.01341
- OP current price: $0.4559
- 24-hour trading volume: GLQ $44,625.58 vs OP $10,268,131.77
- Market Sentiment Index (Fear & Greed Index): 27 (Fear)
Click to view real-time prices:
- View GLQ current price Market Price
- View OP current price Market Price
II. Key Factors Affecting GLQ vs OP Investment Value
Supply Mechanism Comparison (Tokenomics)
- GLQ: Insufficient data on supply mechanism
- OP: Limited information available on tokenomics
- 📌 Historical Pattern: Supply mechanisms have historically been significant price drivers in cryptocurrency markets, though specific patterns for these tokens cannot be determined from available data.
Institutional Adoption and Market Applications
- Institutional Holdings: Available data does not indicate clear institutional preference
- Enterprise Adoption: Insufficient information on enterprise applications for either token
- National Policies: Regulatory attitudes toward these tokens are not specified in the provided information
Technical Development and Ecosystem Building
- GLQ Technical Upgrades: No specific technical upgrade information available
- OP Technical Development: No clear data on development roadmap
- Ecosystem Comparison: Insufficient information to compare DeFi, NFT, payment, and smart contract implementations
Macroeconomic Factors and Market Cycles
- Performance in Inflationary Environments: The US May core PPI annual rate shows a value of 3, exceeding expectations, which benefits the US dollar, potentially affecting the broader crypto market
- Macroeconomic Monetary Policies: Producer price indices excluding food and energy serve as indicators for evaluating price changes in US manufacturing markets
- Geopolitical Factors: International tensions such as the Russia-Ukraine conflict may influence market dynamics, though specific impacts on GLQ and OP are not detailed in the provided sources
III. 2025-2030 Price Prediction: GLQ vs OP
Short-term Prediction (2025)
- GLQ: Conservative $0.00858-$0.01341 | Optimistic $0.01341-$0.01529
- OP: Conservative $0.42883-$0.4562 | Optimistic $0.4562-$0.66149
Mid-term Prediction (2027)
- GLQ may enter a growth phase, with estimated prices of $0.00981-$0.02049
- OP may enter a bullish phase, with estimated prices of $0.59098-$0.74857
- Key drivers: Institutional investment, ETF developments, ecosystem growth
Long-term Prediction (2030)
- GLQ: Base scenario $0.02209-$0.02620 | Optimistic scenario $0.02620-$0.03005
- OP: Base scenario $1.07597-$1.22123 | Optimistic scenario $1.22123-$1.36649
Disclaimer
GLQ:
| 年份 | 预测最高价 | 预测平均价格 | 预测最低价 | 涨跌幅 |
|---|---|---|---|---|
| 2025 | 0.0152874 | 0.01341 | 0.0085824 | 0 |
| 2026 | 0.02008818 | 0.0143487 | 0.012339882 | 7 |
| 2027 | 0.0204899436 | 0.01721844 | 0.0098145108 | 28 |
| 2028 | 0.022247946324 | 0.0188541918 | 0.010746889326 | 40 |
| 2029 | 0.0236337294213 | 0.020551069062 | 0.01274166281844 | 53 |
| 2030 | 0.030045662968644 | 0.02209239924165 | 0.015906527453988 | 64 |
OP:
| 年份 | 预测最高价 | 预测平均价格 | 预测最低价 | 涨跌幅 |
|---|---|---|---|---|
| 2025 | 0.66149 | 0.4562 | 0.428828 | 0 |
| 2026 | 0.75444075 | 0.558845 | 0.29618785 | 22 |
| 2027 | 0.7485728775 | 0.656642875 | 0.5909785875 | 44 |
| 2028 | 1.03985965685 | 0.70260787625 | 0.3864343319375 | 54 |
| 2029 | 1.2807136368285 | 0.87123376655 | 0.784110389895 | 91 |
| 2030 | 1.366486601145347 | 1.07597370168925 | 1.03293475362168 | 136 |
IV. Investment Strategy Comparison: GLQ vs OP
Long-term vs Short-term Investment Strategies
- GLQ: Suitable for investors focused on DeFi data monitoring and automation potential
- OP: Suitable for investors interested in Ethereum scaling solutions and Layer 2 technology
Risk Management and Asset Allocation
- Conservative investors: GLQ: 30% vs OP: 70%
- Aggressive investors: GLQ: 50% vs OP: 50%
- Hedging tools: Stablecoin allocation, options, cross-currency portfolios
V. Potential Risk Comparison
Market Risks
- GLQ: Limited market cap and liquidity may lead to higher volatility
- OP: Dependent on Ethereum's performance and overall Layer 2 adoption
Technical Risks
- GLQ: Scalability, network stability
- OP: Network congestion during high demand, potential smart contract vulnerabilities
Regulatory Risks
- Global regulatory policies may impact both tokens differently, with Layer 2 solutions potentially facing less scrutiny than niche DeFi projects
VI. Conclusion: Which Is the Better Buy?
📌 Investment Value Summary:
- GLQ advantages: Specialized in DeFi data monitoring and automation
- OP advantages: Widely adopted Ethereum Layer 2 scaling solution with lower transaction costs
✅ Investment Advice:
- New investors: Consider allocating a smaller portion to GLQ and a larger portion to OP due to OP's higher market cap and liquidity
- Experienced investors: Evaluate both tokens based on their unique value propositions and potential in their respective niches
- Institutional investors: OP may be more suitable due to its larger market presence and role in Ethereum scaling
⚠️ Risk Warning: The cryptocurrency market is highly volatile, and this article does not constitute investment advice. None
VII. FAQ
Q1: What are the main differences between GLQ and OP? A: GLQ specializes in decentralized DeFi data monitoring and automation, while OP is an Ethereum Layer 2 scaling solution offering lower transaction costs and higher speeds.
Q2: Which token has shown better price performance recently? A: Based on the provided data, OP has shown better price performance and trading volume compared to GLQ. OP's current price is $0.4559 with a 24-hour trading volume of $10,268,131.77, while GLQ's price is $0.01341 with a trading volume of $44,625.58.
Q3: What are the long-term price predictions for GLQ and OP? A: For 2030, GLQ's base scenario predicts a price range of $0.02209-$0.02620, while OP's base scenario predicts $1.07597-$1.22123.
Q4: How do the supply mechanisms of GLQ and OP compare? A: Unfortunately, there is insufficient data on the supply mechanisms (tokenomics) for both GLQ and OP to make a meaningful comparison.
Q5: What are the main risk factors for investing in GLQ and OP? A: For GLQ, main risks include limited market cap, liquidity, and potential scalability issues. For OP, risks include dependence on Ethereum's performance and potential network congestion during high demand periods.
Q6: How might institutional investors view GLQ vs OP? A: Institutional investors may find OP more suitable due to its larger market presence and significant role in Ethereum scaling. However, specific data on institutional preferences is not available.
Q7: What investment strategies are recommended for GLQ and OP? A: Conservative investors might consider allocating 30% to GLQ and 70% to OP, while aggressive investors might opt for a 50-50 split. New investors may want to allocate a smaller portion to GLQ and a larger portion to OP due to OP's higher market cap and liquidity.
Share
Content