GEMS ve SAND: Dijital Ekosistemde İki Popüler Metaverse Token’ının Karşılaştırılması


Giriş: GEMS ve SAND Arasında Yatırım Karşılaştırması
Kripto para piyasasında GEMS ve SAND karşılaştırması, yatırımcıların gündeminden hiç düşmeyen bir konudur. İki varlık, piyasa değeri sıralaması, kullanım alanları ve fiyat performansı bakımından önemli farklılıklar gösterirken, kripto varlık ekosisteminde de farklı pozisyonlar üstlenmektedir.
GEMS (GEMS): Piyasaya çıktığı günden bu yana, yüksek potansiyelli kripto tokenlara özel erişim sunmasıyla piyasa tarafından ilgiyle karşılanmıştır.
SAND (SAND): İlk çıktığı andan itibaren sanal oyun dünyası olarak ün kazanmış, küresel işlem hacmi ve piyasa değeri yüksek kripto paralardan biri olmuştur.
Bu makalede, GEMS ve SAND yatırım değerinin karşılaştırması; tarihsel fiyat eğilimleri, arz mekanizmaları, kurumsal benimseme, teknolojik ekosistemler ve gelecek tahminleri açısından kapsamlı biçimde ele alınacak ve yatırımcıların en çok merak ettiği soruya odaklanılacaktır:
"Şu anda hangisi daha avantajlı bir alım?"
I. Fiyat Geçmişi Karşılaştırması ve Güncel Piyasa Durumu
GEMS (Coin A) ve SAND (Coin B) Tarihsel Fiyat Eğilimleri
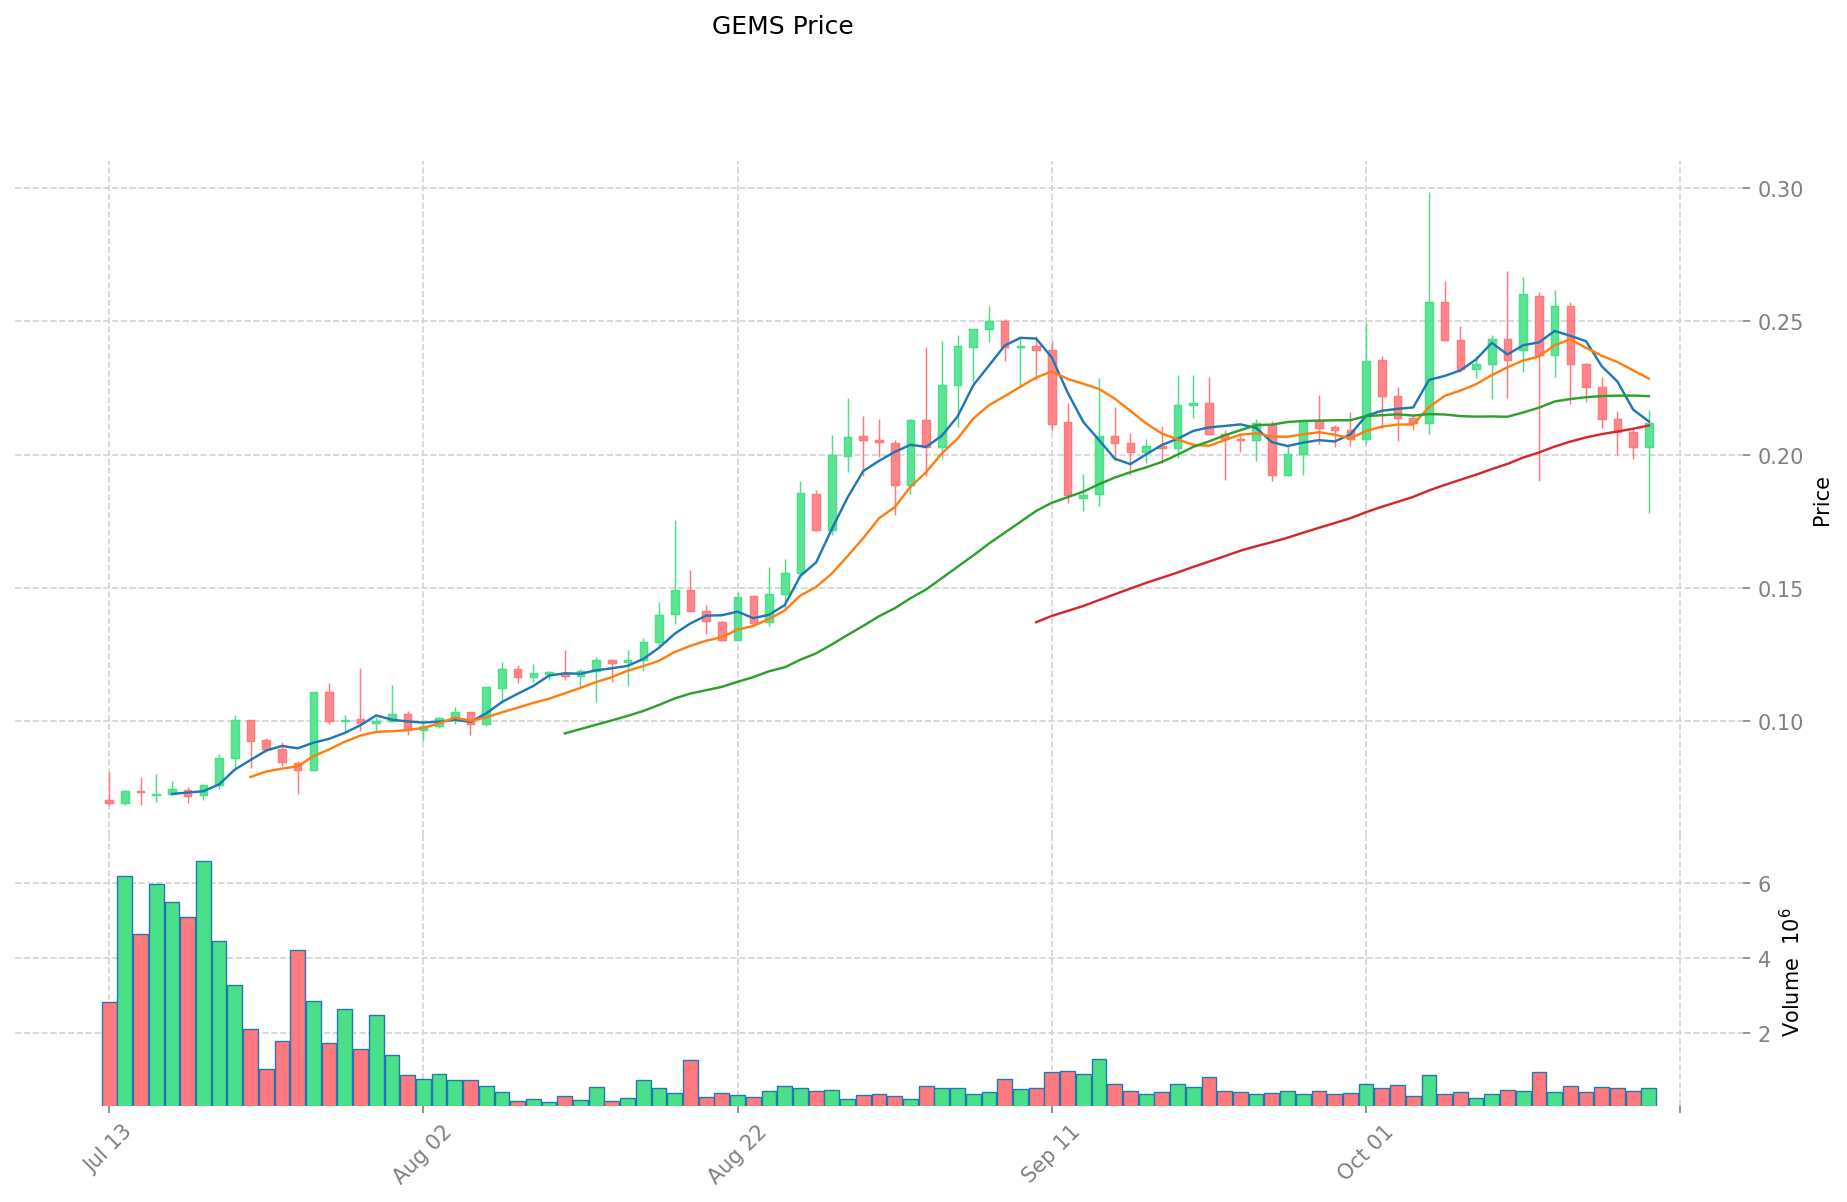
- 2024: GEMS, 22 Ağustos 2024 tarihinde $0,4284 ile tüm zamanların en yüksek seviyesine ulaştı.
- 2025: GEMS, 3 Nisan 2025 tarihinde $0,0134 ile tüm zamanların en düşük seviyesine indi.
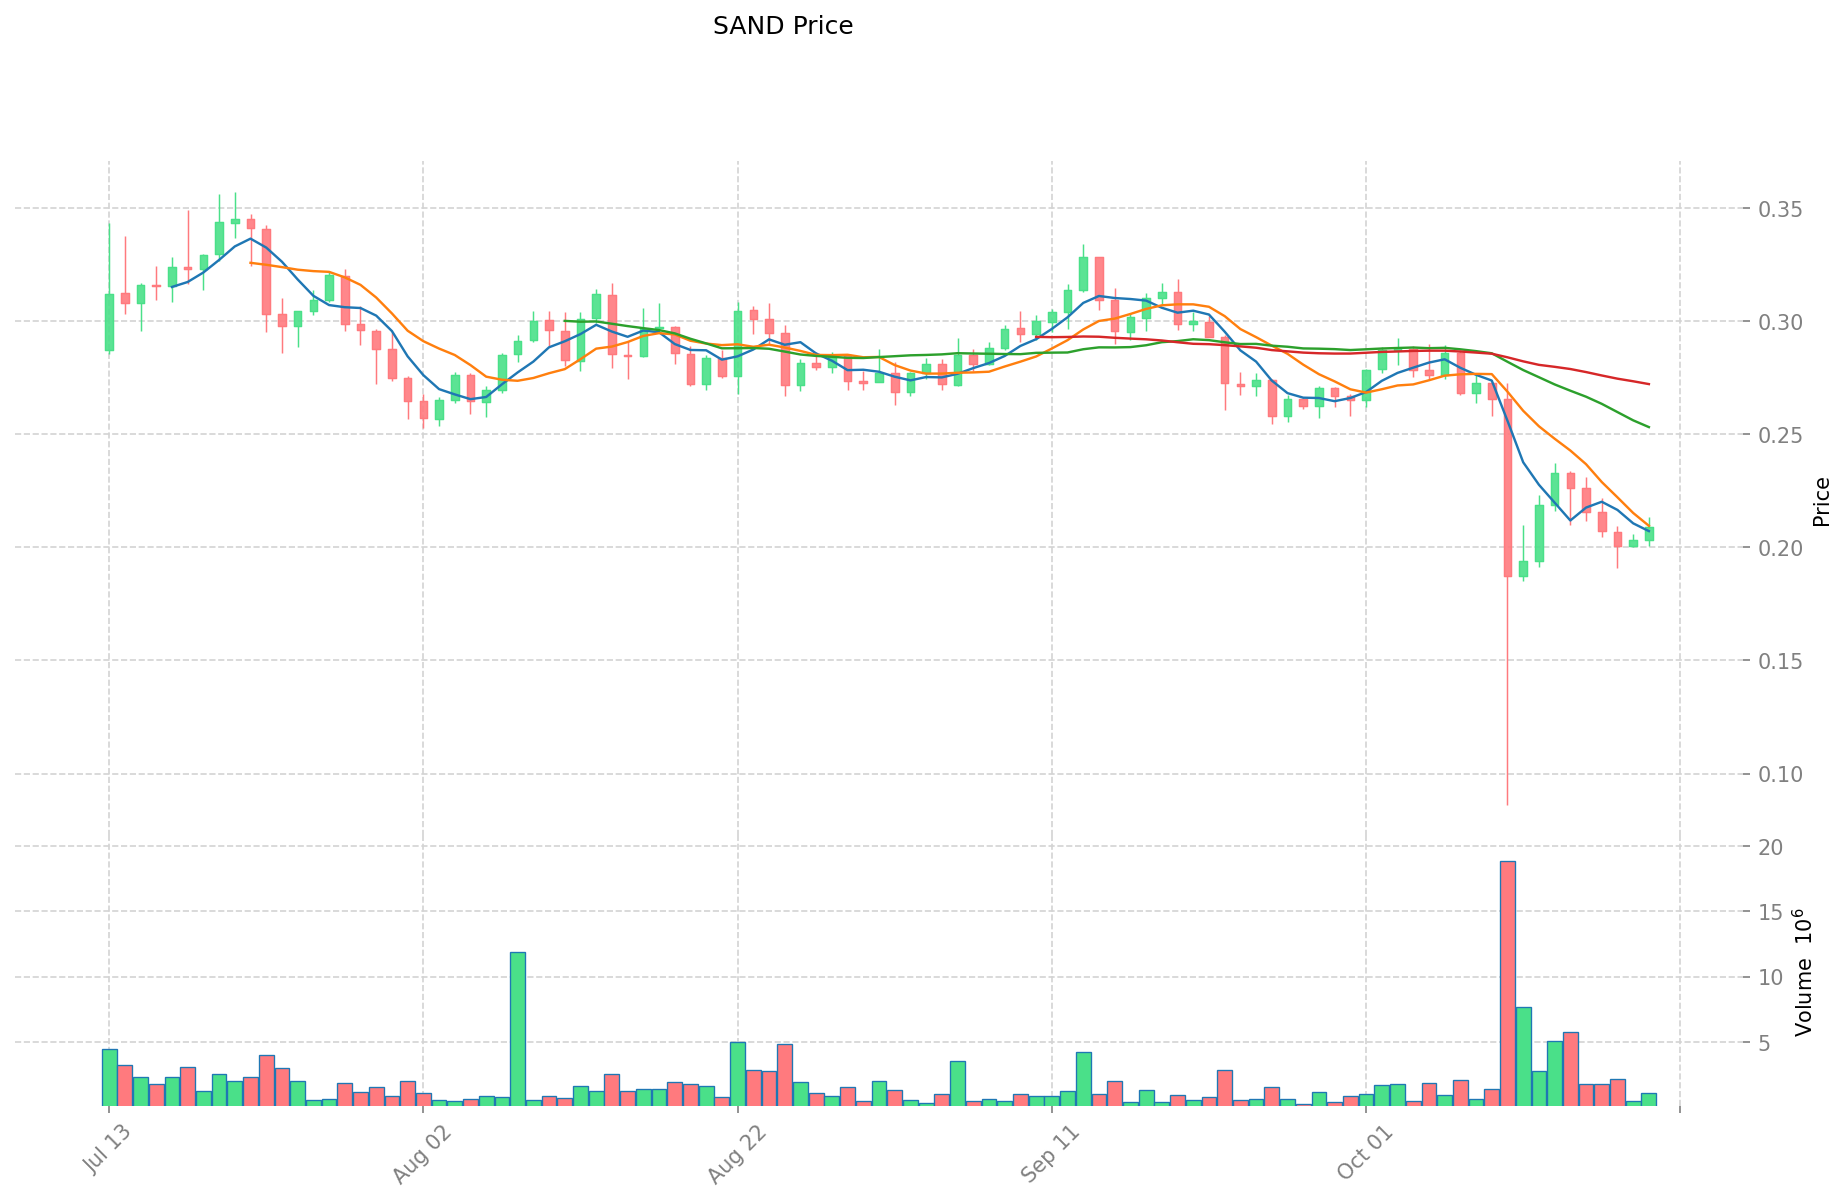
- Karşılaştırmalı Analiz: Bu döngüde GEMS, $0,4284 seviyesinden $0,0134'e düşerken; SAND, Kasım 2021'de $8,4 ile zirveye ulaşmış ve Kasım 2020'de $0,02897764 ile en düşük seviyesini görmüştür.
Güncel Piyasa Durumu (20 Ekim 2025)
- GEMS güncel fiyatı: $0,21188
- SAND güncel fiyatı: $0,2084
- 24 saatlik işlem hacmi: $108.689,85 (GEMS) / $222.973,96 (SAND)
- Piyasa Duyarlılık Endeksi (Korku & Açgözlülük Endeksi): 29 (Korku)
Canlı fiyatlar için tıklayın:
- GEMS güncel fiyatı Piyasa Fiyatı
- SAND güncel fiyatı Piyasa Fiyatı
II. GEMS ve SAND'ın Yatırım Değerini Etkileyen Temel Faktörler
Arz Mekanizması Karşılaştırması (Tokenomik)
- GEMS: Maksimum arzı 3 milyar token; toplam arzın %68'i ekosistem ödüllerine ayrılmıştır
- SAND: Maksimum arzı 3 milyar token; %50,39'u topluluk ve ekosisteme tahsis edilmiştir
- 📌 Tarihsel desen: Her iki token, sınırlı arz modeline sahip olup talep arttığında değerin korunmasına yardımcı olur.
Kurumsal Benimseme ve Piyasa Uygulamaları
- Kurumsal portföyler: SAND, Adidas, Gucci ve Warner Music Group gibi büyük markalarla yaptığı iş birlikleriyle daha fazla kurumsal ilgi görmektedir
- Kurumsal kullanım: SAND, The Sandbox metaverse platformu sayesinde daha geniş bir alana hitap ederken; GEMS, GuardianLink NFT ekosisteminin yardımcı tokenı olarak işlev görmektedir
- Ulusal politikalar: Her iki token, metaverse alanında düzenleyici gri bölgede faaliyet göstermekte olup, farklı ülkelerde değişen kabul seviyelerine sahiptir
Teknolojik Gelişim ve Ekosistem Oluşturma
- GEMS teknolojik güncellemeleri: NFT pazar yeri araçları, oyun entegrasyonu ve çoklu blokzincir genişlemesi üzerine yoğunlaşır
- SAND teknolojik gelişimi: Voxel tabanlı yaratım araçları ve araziye dayalı dijital gayrimenkul sistemiyle sürekli gelişen bir metaverse platformudur
- Ekosistem karşılaştırması: SAND, sanal arazi sahipliği, avatar kişiselleştirme ve oyun üretim araçlarıyla daha gelişmiş bir ekosisteme sahipken, GEMS daha çok NFT pazar yeri odaklı dar bir yapıya sahiptir
Makroekonomik ve Piyasa Döngüleri
- Enflasyon dönemlerinde performans: Her iki token, enflasyonist ortamlarda yüksek dalgalanma gösterir
- Makroekonomik para politikası: Faiz artışları, riskli varlıklar olarak her iki token üzerinde genellikle aşağı yönlü baskı oluşturur
- Jeopolitik faktörler: Her iki token küresel olarak işlem görebilir ancak bölgesel düzenlemeler, işlem hacmini ve benimsemeyi etkileyebilir
III. 2025-2030 Fiyat Tahmini: GEMS vs SAND
Kısa Vadeli Tahmin (2025)
- GEMS: Temkinli $0,1940 - $0,2109 | İyimser $0,2109 - $0,2404
- SAND: Temkinli $0,1666 - $0,2083 | İyimser $0,2083 - $0,2312
Orta Vadeli Tahmin (2027)
- GEMS, büyüme dönemine girebilir ve fiyatların $0,2183 - $0,3275 aralığında olması beklenir
- SAND, istikrarlı bir büyüme sürecine girebilir ve fiyatların $0,1427 - $0,2931 aralığında olması öngörülmektedir
- Temel itici güçler: Kurumsal sermaye girişleri, ETF gelişmeleri, ekosistem büyümesi
Uzun Vadeli Tahmin (2030)
- GEMS: Temel senaryo $0,4035 - $0,5892 | İyimser senaryo $0,5892 - $0,7000
- SAND: Temel senaryo $0,3024 - $0,3296 | İyimser senaryo $0,3296 - $0,3500
Feragatname: Bu tahminler, geçmiş veriler ve piyasa analizine dayalıdır. Kripto para piyasaları son derece oynak olup, hızlı değişimlere açıktır. Bu bilgiler yatırım tavsiyesi değildir; yatırım kararlarınızda mutlaka kendi araştırmanızı yapınız.
GEMS:
| Yıl | Tahmini En Yüksek Fiyat | Tahmini Ortalama Fiyat | Tahmini En Düşük Fiyat | Değişim Oranı |
|---|---|---|---|---|
| 2025 | 0,2404602 | 0,21093 | 0,1940556 | 0 |
| 2026 | 0,259549365 | 0,2256951 | 0,139930962 | 6 |
| 2027 | 0,327540013875 | 0,2426222325 | 0,21836000925 | 14 |
| 2028 | 0,38200870507125 | 0,2850811231875 | 0,208109219926875 | 34 |
| 2029 | 0,473633778063712 | 0,333544914129375 | 0,206797846760212 | 57 |
| 2030 | 0,589240445300953 | 0,403589346096543 | 0,343050944182062 | 90 |
SAND:
| Yıl | Tahmini En Yüksek Fiyat | Tahmini Ortalama Fiyat | Tahmini En Düşük Fiyat | Değişim Oranı |
|---|---|---|---|---|
| 2025 | 0,231213 | 0,2083 | 0,16664 | 0 |
| 2026 | 0,28128832 | 0,2197565 | 0,11427338 | 5 |
| 2027 | 0,2931112197 | 0,25052241 | 0,1427977737 | 20 |
| 2028 | 0,3125893370775 | 0,27181681485 | 0,244635133365 | 30 |
| 2029 | 0,312657291281212 | 0,29220307596375 | 0,224996368492087 | 40 |
| 2030 | 0,329648900148504 | 0,302430183622481 | 0,251017052406659 | 45 |
IV. Yatırım Stratejisi Karşılaştırması: GEMS vs SAND
Uzun Vadeli ve Kısa Vadeli Yatırım Stratejileri
- GEMS: NFT pazar yeri potansiyeli ve oyun entegrasyonu odaklı yatırımcılar için uygundur
- SAND: Metaverse gelişimi ve sanal gayrimenkul odaklı yatırımcılar için uygundur
Risk Yönetimi ve Varlık Dağılımı
- Temkinli yatırımcılar için: GEMS %30 / SAND %70
- Agresif yatırımcılar için: GEMS %60 / SAND %40
- Koruma araçları: Stabilcoin tahsisi, opsiyonlar, çapraz token portföyleri
V. Potansiyel Risk Karşılaştırması
Piyasa Riskleri
- GEMS: Daha küçük piyasa değeri ve işlem hacmine bağlı olarak yüksek oynaklık
- SAND: Daha geniş metaverse piyasasının dalgalanmasına açıktır
Teknik Riskler
- GEMS: Çoklu zincir genişlemesinde ölçeklenebilirlik ve ağ stabilitesi riskleri
- SAND: Platform güvenliği ve akıllı sözleşme açıkları
Düzenleyici Riskler
- Küresel düzenleme politikaları her iki tokenı farklı şekillerde etkileyebilir; SAND, yerleşik metaverse platformu nedeniyle daha fazla denetime tabi olabilir
VI. Sonuç: Hangisi Daha Avantajlı Alım?
📌 Yatırım Değeri Özeti:
- GEMS avantajları: NFT pazar yeri odağı, oyun entegrasyonunda büyüme potansiyeli
- SAND avantajları: Yerleşik metaverse platformu, büyük markalarla iş birlikleri
✅ Yatırım Tavsiyesi:
- Yeni yatırımcılar: SAND'ın daha yerleşik ekosistemi nedeniyle portföyünüzde ağırlık verebilirsiniz
- Deneyimli yatırımcılar: Her iki tokenı da portföyünüze dahil edebilir, büyüme potansiyeli için GEMS'e daha yüksek oran ayırabilirsiniz
- Kurumsal yatırımcılar: SAND'ın kurumsal iş birlikleri ve piyasa uygulamalarına odaklanabilirsiniz
⚠️ Risk Uyarısı: Kripto para piyasası son derece oynaktır; bu makale yatırım tavsiyesi değildir. None
VII. Sıkça Sorulan Sorular
S1: GEMS ve SAND arasındaki temel farklar nelerdir? C: GEMS, oyun entegrasyonu ile NFT pazar yeri araçlarına odaklanırken; SAND, sanal arazi sahipliği ve oyun oluşturma araçlarıyla yerleşik bir metaverse platformudur. SAND'ın piyasa değeri ve işlem hacmi daha büyük ve daha fazla kurumsal ortaklığa sahiptir.
S2: Tarihsel olarak hangi token daha iyi fiyat performansı gösterdi? C: SAND, Kasım 2021'de $8,4 ile tüm zamanların en yüksek seviyesine ulaşarak, GEMS'in Ağustos 2024'teki $0,4284'üne göre daha iyi performans göstermiştir.
S3: GEMS ve SAND'ın yatırım değerini etkileyen ana faktörler nelerdir? C: Arz mekanizmaları, kurumsal benimseme, teknolojik gelişim, ekosistem oluşturma ve enflasyon ile faiz oranı gibi makroekonomik koşullar öne çıkar.
S4: GEMS ve SAND'ın uzun vadeli fiyat tahminleri nasıl karşılaştırılır? C: 2030 yılı için iyimser senaryoda, GEMS $0,4035 - $0,7000 aralığına, SAND ise $0,3024 - $0,3500 aralığına ulaşabilir.
S5: GEMS ve SAND yatırımlarındaki ana riskler nelerdir? C: Her iki token piyasaya, teknik ve düzenleyici risklere açıktır. GEMS daha düşük piyasa değeri nedeniyle daha oynak, SAND ise yerleşik metaverse platformu nedeniyle daha fazla düzenleyici denetime tabi olabilir.
S6: Yatırımcılar portföylerini GEMS ve SAND arasında nasıl ayırmalı? C: Temkinli yatırımcılar GEMS'e %30, SAND'a %70; agresif yatırımcılar ise GEMS'e %60, SAND'a %40 ayırabilir. Bu oranlar kişisel risk toleransınız ve yatırım hedeflerinize göre belirlenmelidir.
Share
Content
Giriş: GEMS ve SAND Arasında Yatırım Karşılaştırması
I. Fiyat Geçmişi Karşılaştırması ve Güncel Piyasa Durumu
II. GEMS ve SAND'ın Yatırım Değerini Etkileyen Temel Faktörler
III. 2025-2030 Fiyat Tahmini: GEMS vs SAND
IV. Yatırım Stratejisi Karşılaştırması: GEMS vs SAND
V. Potansiyel Risk Karşılaştırması
VI. Sonuç: Hangisi Daha Avantajlı Alım?
VII. Sıkça Sorulan Sorular
How to Buy Cryptocurrency


Trending Cryptocurrencies


BRN Metaverse (BRN) iyi bir yatırım mı?: Bu sanal dünya tokeninin potansiyeli ve riskleri üzerine analiz

Loaded Lions (LION) iyi bir yatırım mı?: Dalgalı kripto piyasasında bu yeni NFT projesinin potansiyelinin değerlendirilmesi

Race Kingdom (ATOZ) iyi bir yatırım mı?: Bu NFT oyun projesinin potansiyelini ve risklerini değerlendirmek

Binamon (BMON) iyi bir yatırım mı?: Gelişen metaverse ekosisteminde bu NFT oyun tokeninin potansiyelini analiz ediyoruz
Lootex (LOOT) iyi bir yatırım mı?: Bu NFT pazar yeri tokeninin potansiyelini ve risklerini inceliyoruz

ALPA ve MANA: Metaverse'te Blockchain Oyunlarının Liderliği İçin Rekabet
SEI Airdrop Ödülleri’ne Katılım ve Talep Etme Kılavuzu

Kripto para birimlerinde algoritmik alım satım için etkili stratejiler
Stock-to-Flow Model ile Bitcoin'in Değerlemesini Anlamak
İşlem hızının blockchain verimliliğini nasıl etkilediğini anlamak
ENS Domainleri ile Web3 Kimlik Yönetimi