FAIR3 vs XTZ: Analyzing the Performance and Investment Potential of Two Leading Digital Assets
Introduction: Investment Comparison between FAIR3 and XTZ
In the cryptocurrency market, the comparison between FAIR3 vs XTZ has always been an unavoidable topic for investors. The two not only show significant differences in market cap ranking, application scenarios, and price performance, but also represent different positions in crypto assets.
FAIR3 (FAIR3): Since its launch, it has gained market recognition for its focus on decentralized technical fairness and community governance.
Tezos (XTZ): Launched in 2017, it has been hailed as a self-evolving blockchain platform, and is one of the cryptocurrencies with significant global trading volume and market capitalization.
This article will comprehensively analyze the investment value comparison between FAIR3 vs XTZ, focusing on historical price trends, supply mechanisms, institutional adoption, technological ecosystems, and future predictions, attempting to answer the question most concerning to investors:
"Which is the better buy right now?"
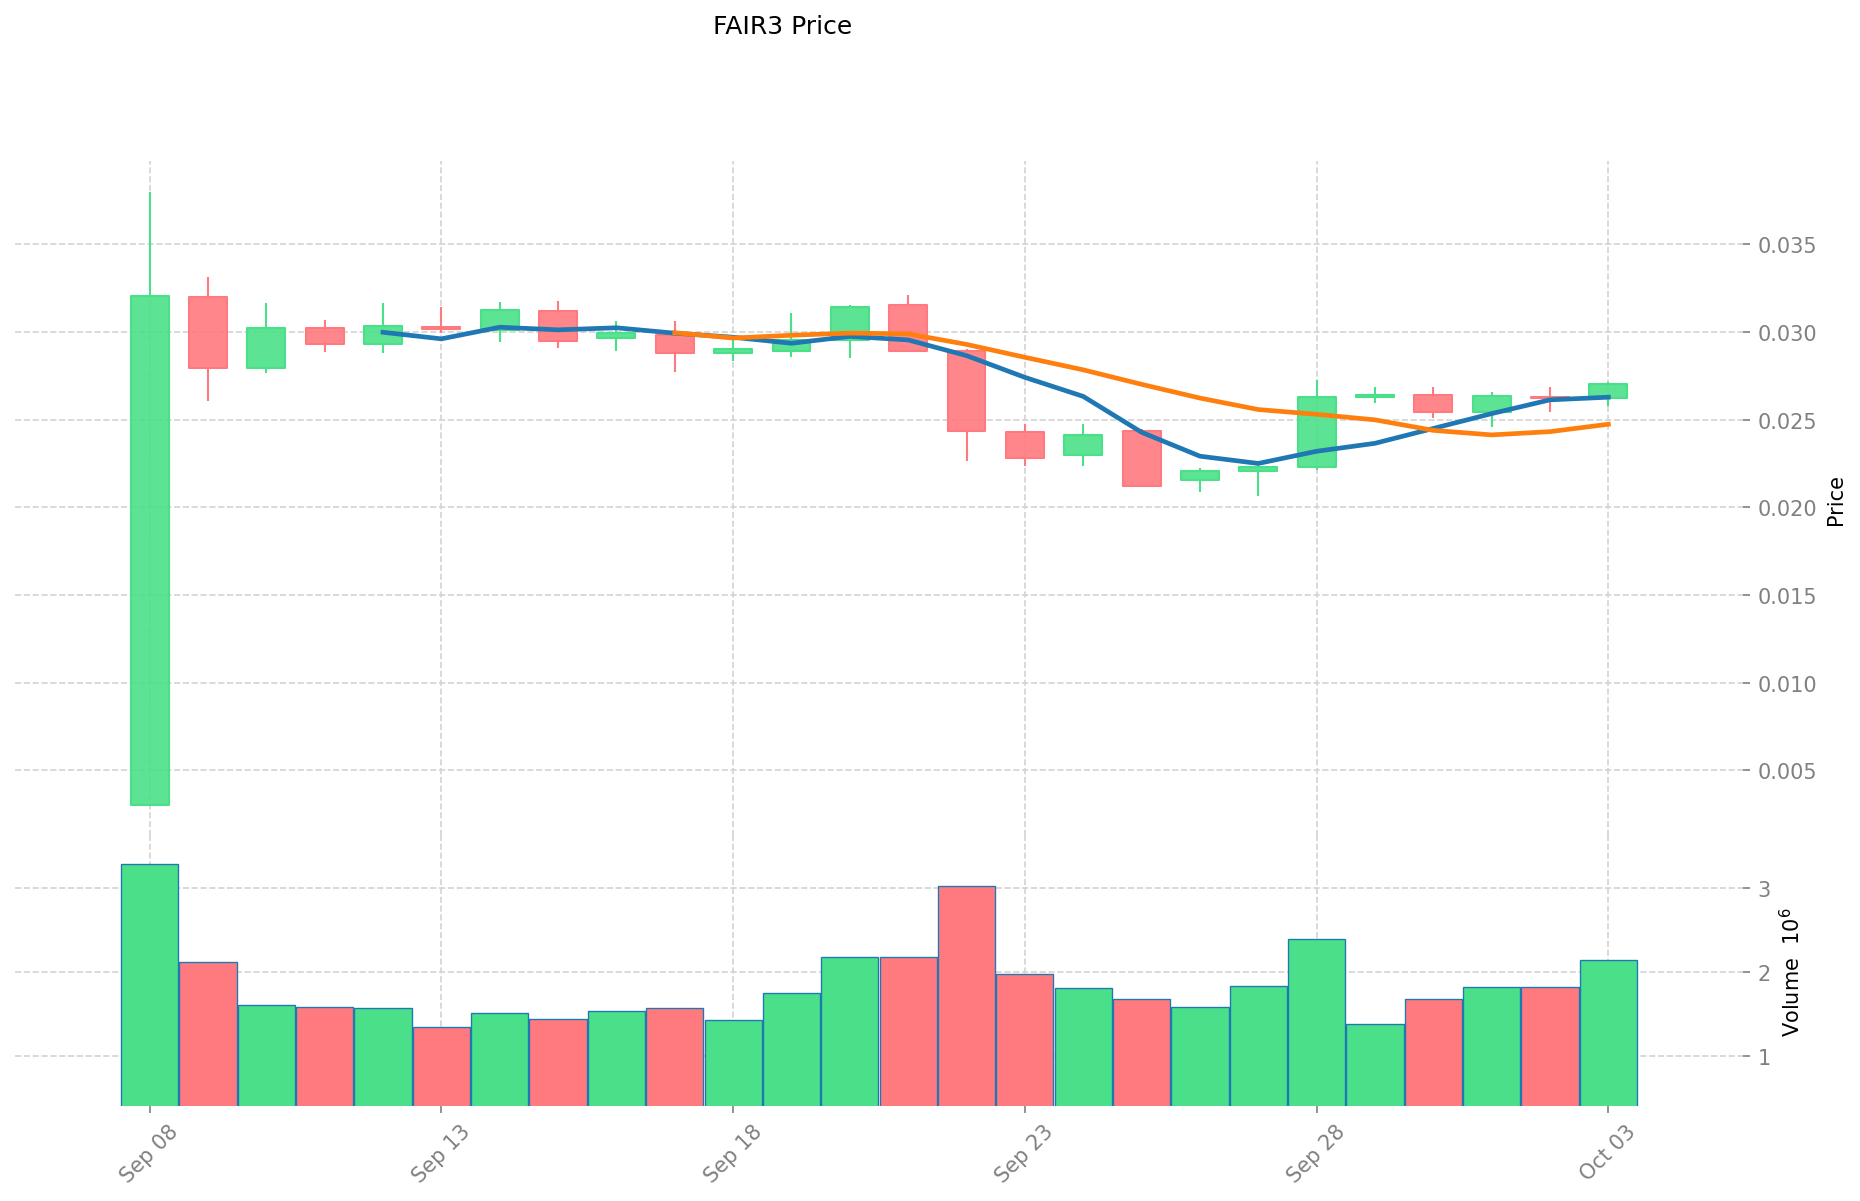
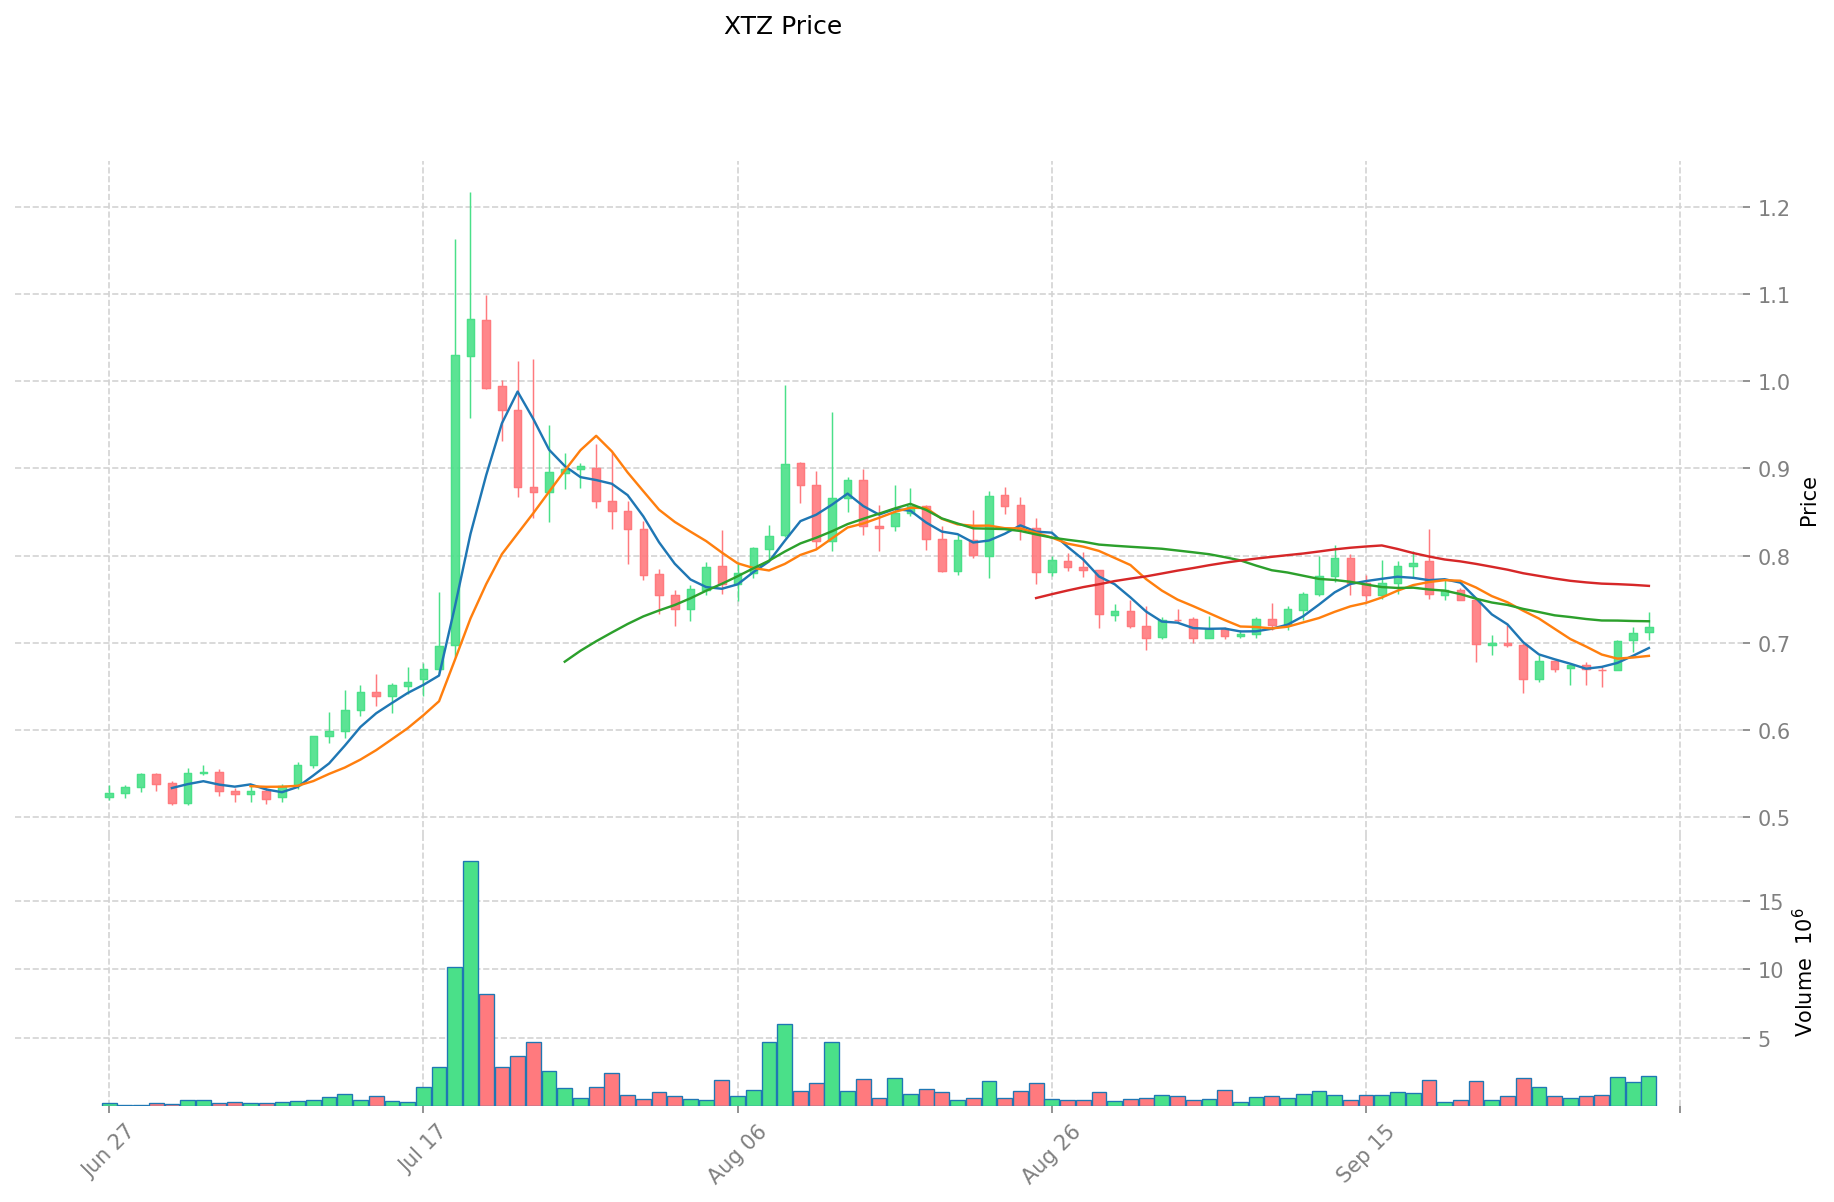
I. Price History Comparison and Current Market Status
FAIR3 and XTZ Historical Price Trends
- 2021: XTZ reached an all-time high of $9.12 due to increased adoption and ecosystem growth.
- 2025: FAIR3 launched with an initial price of $0.03, gaining attention for its community-driven approach.
- Comparative analysis: In the recent market cycle, XTZ dropped from its all-time high to a low of $0.35, while FAIR3 has shown relative stability since its launch.
Current Market Situation (2025-10-04)
- FAIR3 current price: $0.02685
- XTZ current price: $0.7201
- 24-hour trading volume: FAIR3 $56,406.84 vs XTZ $1,558,808.81
- Market Sentiment Index (Fear & Greed Index): 64 (Greed)
Click to view real-time prices:
- View FAIR3 current price Market Price
- View XTZ current price Market Price
II. Key Factors Affecting FAIR3 vs XTZ Investment Value
Supply Mechanisms Comparison (Tokenomics)
- XTZ: Utilizes a Proof-of-Stake (PoS) mechanism allowing token holders to create blocks and receive rewards based on their holding ratio
- FAIR3: Market trends and project developments influence its value
- 📌 Historical Pattern: Market sentiment directly impacts price movement, especially when positive news about wide adoption or technological breakthroughs emerges
Institutional Adoption and Market Applications
- Market Sentiment: Investor confidence and sentiment have direct influence on price trends for both tokens
- Technology Innovation: Major technological advancements or breakthroughs can significantly affect pricing
- Regulatory Environment: Policy regulations in various jurisdictions impact both cryptocurrencies' values
Technical Development and Ecosystem Building
- XTZ Technical Features: Protocol upgrade requests are proposed on the blockchain, allowing XTZ holders to vote based on their token holdings
- Governance Model: XTZ enables holders to participate in governance by voting on protocol changes
- Ecosystem Comparison: XTZ employs a PoS mechanism that differs from Ethereum's approach, creating a unique position in the blockchain ecosystem
Macroeconomic and Market Cycles
- Macroeconomic Trends: Both cryptocurrencies are affected by broader economic conditions
- Market Volatility: Price fluctuations are influenced by multiple factors including market sentiment, regulatory news, and technological developments
- Global Economic Factors: Overall economic trends play a significant role in determining value and investment potential
III. 2025-2030 Price Predictions: FAIR3 vs XTZ
Short-term Forecast (2025)
- FAIR3: Conservative $0.0163907 - $0.02687 | Optimistic $0.02687 - $0.0330501
- XTZ: Conservative $0.50365 - $0.7195 | Optimistic $0.7195 - $1.05047
Mid-term Forecast (2027)
- FAIR3 may enter a growth phase, with projected prices of $0.0266120144125 - $0.0391353153125
- XTZ may enter a bullish market, with projected prices of $0.911888544 - $1.38765648
- Key drivers: Institutional capital inflow, ETF, ecosystem development
Long-term Forecast (2030)
- FAIR3: Base scenario $0.024895505239492 - $0.046972651395269 | Optimistic scenario $0.046972651395269 - $0.060124993785945
- XTZ: Base scenario $1.40900101550208 - $1.601137517616 | Optimistic scenario $1.601137517616 - $2.28962665019088
Disclaimer: The above predictions are based on historical data and market analysis. Cryptocurrency markets are highly volatile and subject to change. This information should not be considered as financial advice. Always conduct your own research before making investment decisions.
FAIR3:
| 年份 | 预测最高价 | 预测平均价格 | 预测最低价 | 涨跌幅 |
|---|---|---|---|---|
| 2025 | 0.0330501 | 0.02687 | 0.0163907 | 0 |
| 2026 | 0.0326564545 | 0.02996005 | 0.022170437 | 11 |
| 2027 | 0.0391353153125 | 0.03130825225 | 0.0266120144125 | 16 |
| 2028 | 0.047549408104687 | 0.03522178378125 | 0.019019763241875 | 31 |
| 2029 | 0.05255970684757 | 0.041385595942968 | 0.023175933728062 | 54 |
| 2030 | 0.060124993785945 | 0.046972651395269 | 0.024895505239492 | 74 |
XTZ:
| 年份 | 预测最高价 | 预测平均价格 | 预测最低价 | 涨跌幅 |
|---|---|---|---|---|
| 2025 | 1.05047 | 0.7195 | 0.50365 | 0 |
| 2026 | 1.0973814 | 0.884985 | 0.6371892 | 22 |
| 2027 | 1.38765648 | 0.9911832 | 0.911888544 | 37 |
| 2028 | 1.7484471648 | 1.18941984 | 0.7374403008 | 65 |
| 2029 | 1.733341532832 | 1.4689335024 | 0.851981431392 | 103 |
| 2030 | 2.28962665019088 | 1.601137517616 | 1.40900101550208 | 122 |
IV. Investment Strategy Comparison: FAIR3 vs XTZ
Long-term vs Short-term Investment Strategies
- FAIR3: Suitable for investors focused on community-driven projects and decentralized governance
- XTZ: Suitable for investors interested in self-evolving blockchain platforms and established ecosystems
Risk Management and Asset Allocation
- Conservative investors: FAIR3: 20% vs XTZ: 80%
- Aggressive investors: FAIR3: 40% vs XTZ: 60%
- Hedging tools: Stablecoin allocation, options, cross-currency portfolios
V. Potential Risk Comparison
Market Risks
- FAIR3: Higher volatility due to lower market cap and trading volume
- XTZ: Susceptible to broader cryptocurrency market trends and competition from other smart contract platforms
Technical Risks
- FAIR3: Scalability, network stability
- XTZ: Centralization concerns, potential security vulnerabilities
Regulatory Risks
- Global regulatory policies may have differing impacts on both tokens, with XTZ potentially facing more scrutiny due to its larger market presence
VI. Conclusion: Which Is the Better Buy?
📌 Investment Value Summary:
- FAIR3 advantages: Community-driven approach, potential for growth in decentralized governance space
- XTZ advantages: Established ecosystem, self-evolving blockchain technology, higher liquidity
✅ Investment Advice:
- New investors: Consider allocating a small portion to XTZ as part of a diversified crypto portfolio
- Experienced investors: Explore a balanced approach between FAIR3 and XTZ based on risk tolerance
- Institutional investors: Focus on XTZ for its established market presence and liquidity, while monitoring FAIR3 for potential growth opportunities
⚠️ Risk Warning: The cryptocurrency market is highly volatile. This article does not constitute investment advice. None
VII. FAQ
Q1: What are the main differences between FAIR3 and XTZ? A: FAIR3 focuses on decentralized technical fairness and community governance, while XTZ is a self-evolving blockchain platform with a larger market cap and trading volume. XTZ uses a Proof-of-Stake mechanism, allowing token holders to participate in governance and receive rewards.
Q2: Which cryptocurrency has shown better price stability recently? A: FAIR3 has shown relative stability since its launch in 2025, while XTZ has experienced more significant price fluctuations, dropping from its all-time high of $9.12 in 2021 to lower levels in recent years.
Q3: How do the supply mechanisms of FAIR3 and XTZ differ? A: XTZ utilizes a Proof-of-Stake (PoS) mechanism where token holders can create blocks and receive rewards based on their holding ratio. FAIR3's value is primarily influenced by market trends and project developments.
Q4: What are the key factors affecting the investment value of FAIR3 and XTZ? A: Key factors include market sentiment, technological innovation, regulatory environment, institutional adoption, and overall economic trends. Both cryptocurrencies are also affected by their respective ecosystem developments and governance models.
Q5: How do the long-term price predictions for FAIR3 and XTZ compare? A: By 2030, FAIR3 is predicted to reach between $0.024895505239492 and $0.060124993785945 in optimistic scenarios, while XTZ is projected to be between $1.40900101550208 and $2.28962665019088 in optimistic scenarios.
Q6: What are the main risks associated with investing in FAIR3 and XTZ? A: FAIR3 faces higher volatility due to its lower market cap and trading volume, as well as potential scalability and network stability issues. XTZ is susceptible to broader cryptocurrency market trends and competition from other smart contract platforms, with potential centralization concerns and security vulnerabilities.
Q7: How should different types of investors approach FAIR3 and XTZ? A: New investors might consider allocating a small portion to XTZ as part of a diversified crypto portfolio. Experienced investors could explore a balanced approach between FAIR3 and XTZ based on their risk tolerance. Institutional investors may focus more on XTZ for its established market presence and liquidity, while monitoring FAIR3 for potential growth opportunities.
Share
Content
Introduction: Investment Comparison between FAIR3 and XTZ
I. Price History Comparison and Current Market Status
II. Key Factors Affecting FAIR3 vs XTZ Investment Value
III. 2025-2030 Price Predictions: FAIR3 vs XTZ
IV. Investment Strategy Comparison: FAIR3 vs XTZ
V. Potential Risk Comparison
VI. Conclusion: Which Is the Better Buy?
VII. FAQ

