EUL vs LINK: Comparing Two Blockchain Protocols for Enterprise Solutions
Introduction: EUL vs LINK Investment Comparison
In the cryptocurrency market, the comparison between Euler (EUL) vs Chainlink (LINK) has always been a topic that investors cannot avoid. The two not only have significant differences in market cap ranking, application scenarios, and price performance, but also represent different crypto asset positioning.
Euler (EUL): Since its launch in 2021, it has gained market recognition for its position as an unmanaged, unauthorized lending protocol on Ethereum.
Chainlink (LINK): Launched in 2017, it has been hailed as a decentralized oracle network, and is one of the cryptocurrencies with the highest global trading volume and market capitalization.
This article will comprehensively analyze the investment value comparison between EUL vs LINK, focusing on historical price trends, supply mechanisms, institutional adoption, technological ecosystems, and future predictions, and attempt to answer the question investors care about most:
"Which is the better buy right now?"
I. Price History Comparison and Current Market Status
EUL and LINK Historical Price Trends
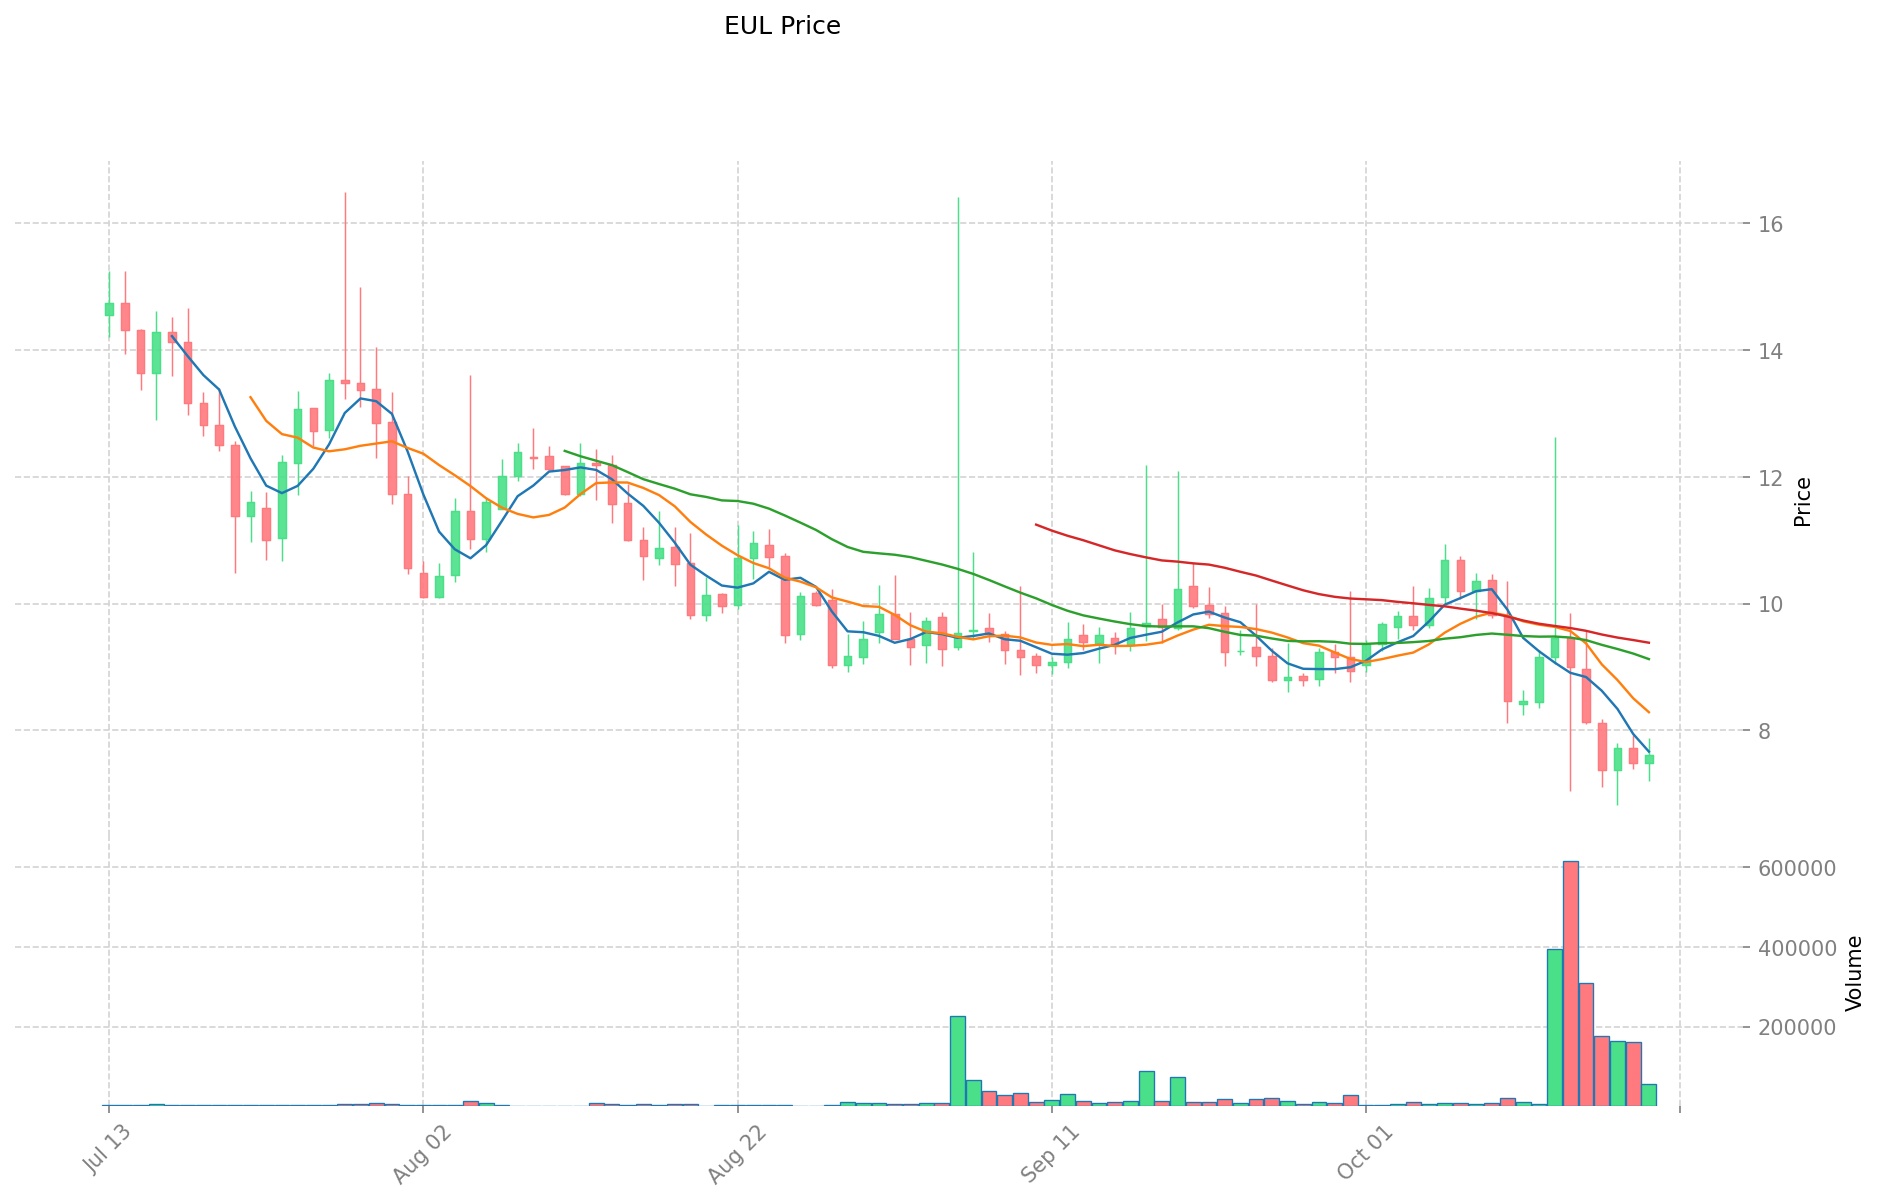
- 2023: EUL reached its all-time low of $1.44 on June 16, 2023.
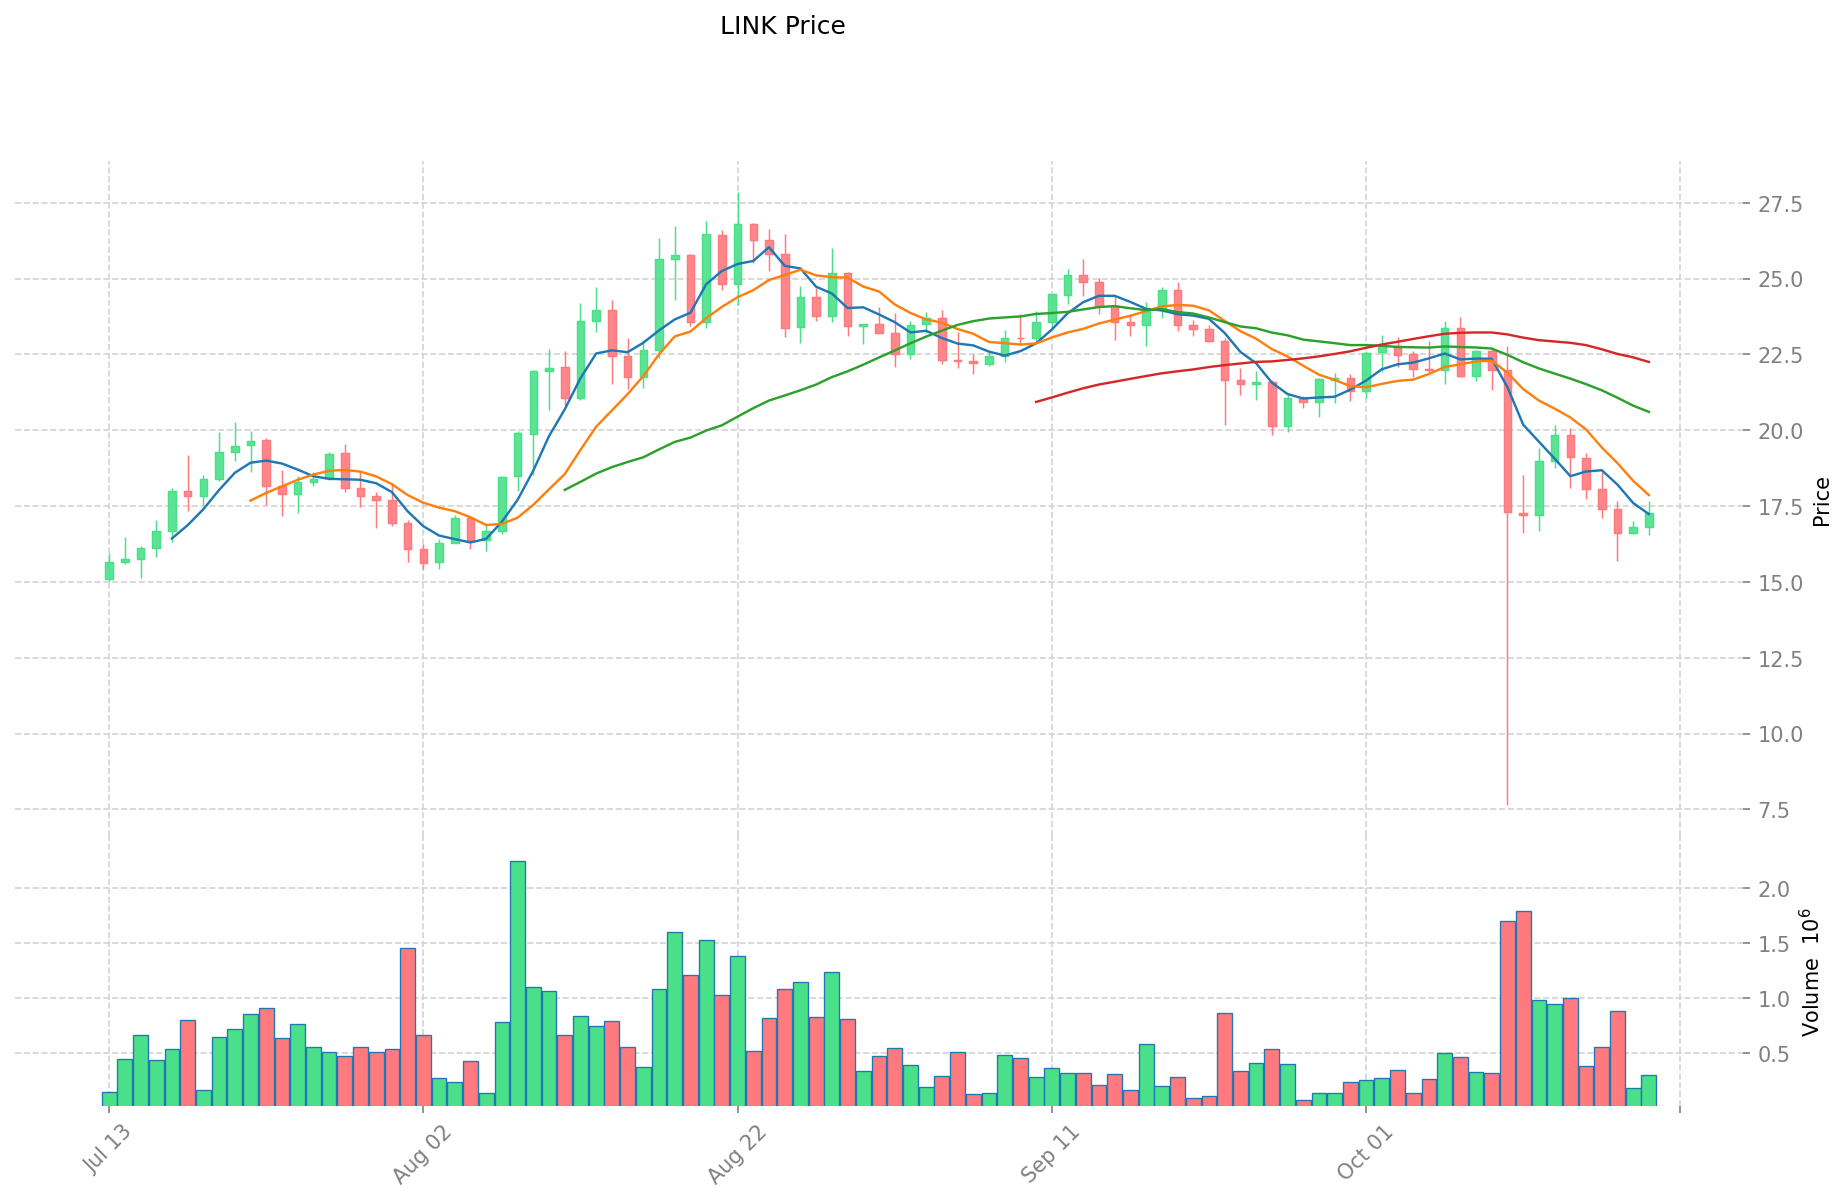
- 2021: LINK hit its all-time high of $52.7 on May 10, 2021.
- Comparative Analysis: Since their respective peaks and troughs, EUL has risen to $7.621, while LINK has settled at $17.248 as of October 20, 2025.
Current Market Situation (2025-10-20)
- EUL current price: $7.621
- LINK current price: $17.248
- 24-hour trading volume: $429,722.31 (EUL) vs $5,163,065.95 (LINK)
- Market Sentiment Index (Fear & Greed Index): 29 (Fear)
Click to view real-time prices:
- Check EUL current price Market Price
- Check LINK current price Market Price
II. Core Factors Affecting the Investment Value of EUL vs LINK
Supply Mechanism Comparison (Tokenomics)
- EUL: Fixed maximum supply of 500 million tokens with 400 million already in circulation
- LINK: 1 billion total supply with over 500 million currently in circulation
- 📌 Historical Pattern: Supply mechanisms have historically created price action differences, with limited supply tokens typically experiencing higher volatility during bullish cycles.
Institutional Adoption and Market Applications
- Institutional Holdings: LINK has gained significantly more institutional adoption with major enterprises like Google, Swift, and Amazon Web Services integrating Chainlink's oracle network
- Enterprise Adoption: LINK serves as critical infrastructure for DeFi protocols with over $50 billion secured, while EUL's adoption is currently more limited to its own ecosystem
- Regulatory Attitudes: Both tokens face similar regulatory considerations as utility tokens, though LINK's longer market presence has provided more regulatory clarity
Technical Development and Ecosystem Building
- EUL Technical Upgrades: Recently launched Eulith V1 to simplify DeFi interaction, enhancing accessibility for institutional investors
- LINK Technical Development: Implementing CCIP (Cross-Chain Interoperability Protocol) and staking capabilities, expanding beyond oracle services
- Ecosystem Comparison: LINK powers thousands of DeFi applications across multiple blockchains, while EUL's ecosystem is emerging with focus on institutional DeFi tooling and trading infrastructure
Macroeconomic Environment and Market Cycles
- Inflation Performance: LINK has demonstrated more resilience during inflationary periods due to its broader adoption and essential infrastructure role
- Monetary Policy Effects: Both tokens show sensitivity to Federal Reserve decisions, with LINK typically showing stronger correlation to broader crypto market movements
- Geopolitical Factors: LINK's global infrastructure role potentially provides greater resilience to regional regulatory challenges III. 2025-2030 Price Prediction: EUL vs LINK
Short-term Prediction (2025)
- EUL: Conservative $5.712 - $7.616 | Optimistic $7.616 - $10.43392
- LINK: Conservative $12.77684 - $17.266 | Optimistic $17.266 - $23.65442
Mid-term Prediction (2027)
- EUL may enter a growth phase, with estimated prices ranging from $9.316466208 to $14.325319008
- LINK may enter a bullish phase, with estimated prices ranging from $18.299611824 to $31.066782864
- Key drivers: Institutional capital inflow, ETFs, ecosystem development
Long-term Prediction (2030)
- EUL: Base scenario $7.267908198769848 - $13.7130343373016 | Optimistic scenario $13.7130343373016 - $17.278423265000016
- LINK: Base scenario $21.64691723871456 - $34.914382643088 | Optimistic scenario $34.914382643088 - $39.10410856025856
Disclaimer
EUL:
| 年份 | 预测最高价 | 预测平均价格 | 预测最低价 | 涨跌幅 |
|---|---|---|---|---|
| 2025 | 10.43392 | 7.616 | 5.712 | 0 |
| 2026 | 11.0104512 | 9.02496 | 5.866224 | 18 |
| 2027 | 14.325319008 | 10.0177056 | 9.316466208 | 31 |
| 2028 | 12.53665767312 | 12.171512304 | 8.88520398192 | 59 |
| 2029 | 15.0719836860432 | 12.35408498856 | 9.3891045913056 | 62 |
| 2030 | 17.278423265000016 | 13.7130343373016 | 7.267908198769848 | 79 |
LINK:
| 年份 | 预测最高价 | 预测平均价格 | 预测最低价 | 涨跌幅 |
|---|---|---|---|---|
| 2025 | 23.65442 | 17.266 | 12.77684 | 0 |
| 2026 | 22.0970268 | 20.46021 | 14.5267491 | 18 |
| 2027 | 31.066782864 | 21.2786184 | 18.299611824 | 22 |
| 2028 | 34.54796483424 | 26.172700632 | 16.48880139816 | 51 |
| 2029 | 39.468432553056 | 30.36033273312 | 15.4837696938912 | 75 |
| 2030 | 39.10410856025856 | 34.914382643088 | 21.64691723871456 | 101 |
IV. Investment Strategy Comparison: EUL vs LINK
Long-term vs Short-term Investment Strategies
- EUL: Suitable for investors focused on DeFi lending and institutional-grade trading infrastructure
- LINK: Suitable for investors seeking broader blockchain infrastructure exposure and cross-chain interoperability
Risk Management and Asset Allocation
- Conservative investors: EUL: 20% vs LINK: 80%
- Aggressive investors: EUL: 40% vs LINK: 60%
- Hedging tools: Stablecoin allocation, options, cross-token portfolios
V. Potential Risk Comparison
Market Risk
- EUL: Higher volatility due to smaller market cap and emerging ecosystem
- LINK: Exposure to broader DeFi market fluctuations and oracle demand
Technical Risk
- EUL: Scalability, network stability
- LINK: Oracle network reliability, smart contract vulnerabilities
Regulatory Risk
- Global regulatory policies may have differing impacts on both tokens, with LINK potentially facing more scrutiny due to its wider adoption
VI. Conclusion: Which Is the Better Buy?
📌 Investment Value Summary:
- EUL advantages: Emerging DeFi lending protocol, institutional focus, potential for high growth
- LINK advantages: Established oracle network, wide adoption, critical infrastructure for DeFi
✅ Investment Advice:
- New investors: Consider a larger allocation to LINK for its established position and lower volatility
- Experienced investors: Balanced approach with both tokens, leveraging EUL's growth potential
- Institutional investors: Evaluate LINK for infrastructure play, EUL for DeFi-specific exposure
⚠️ Risk Warning: Cryptocurrency markets are highly volatile. This article does not constitute investment advice. None
VII. FAQ
Q1: What are the key differences between EUL and LINK? A: EUL is an unmanaged lending protocol on Ethereum, while LINK is a decentralized oracle network. LINK has a larger market cap, higher trading volume, and wider institutional adoption compared to EUL.
Q2: Which token has performed better historically? A: LINK has shown stronger historical performance, reaching an all-time high of $52.7 in May 2021. EUL, being newer, hit its all-time low of $1.44 in June 2023 but has since risen to $7.621 as of October 2025.
Q3: How do their supply mechanisms differ? A: EUL has a fixed maximum supply of 500 million tokens with 400 million in circulation. LINK has a total supply of 1 billion with over 500 million currently circulating.
Q4: Which token has greater institutional adoption? A: LINK has significantly more institutional adoption, with major enterprises like Google, Swift, and Amazon Web Services integrating Chainlink's oracle network.
Q5: What are the projected prices for EUL and LINK by 2030? A: For EUL, the base scenario projects $7.27 - $13.71, with an optimistic scenario of $13.71 - $17.28. For LINK, the base scenario projects $21.65 - $34.91, with an optimistic scenario of $34.91 - $39.10.
Q6: How should investors allocate between EUL and LINK? A: Conservative investors might consider 20% EUL and 80% LINK, while aggressive investors could opt for 40% EUL and 60% LINK. New investors may prefer a larger allocation to LINK for its established position.
Q7: What are the main risks associated with each token? A: EUL faces higher volatility due to its smaller market cap and emerging ecosystem. LINK is exposed to broader DeFi market fluctuations and oracle demand. Both face potential regulatory risks, with LINK possibly facing more scrutiny due to its wider adoption.