ETHS vs ENJ: Comparing Two Leading Blockchain Gaming Tokens in the NFT Ecosystem
Introduction: Investment Comparison of ETHS vs ENJ
In the cryptocurrency market, the comparison between ETHS vs ENJ has always been an unavoidable topic for investors. The two not only show significant differences in market cap ranking, application scenarios, and price performance, but also represent different positioning in the crypto asset space.
ETHS (ETHS): Since its launch, it has gained market recognition for its role in secure expansion of the Ethereum mainnet as a decentralized Ethereum L1 scaling protocol.
Enjin Coin (ENJ): Launched in 2017, it has been hailed as a pioneer in blockchain-based gaming, enabling players, content creators, and game publishers to add virtual goods and provide value for games and communities.
This article will comprehensively analyze the investment value comparison between ETHS vs ENJ, focusing on historical price trends, supply mechanisms, institutional adoption, technological ecosystems, and future predictions, attempting to answer the question investors care about most:
"Which is the better buy right now?"
I. Price History Comparison and Current Market Status
ETHS and ENJ Historical Price Trends
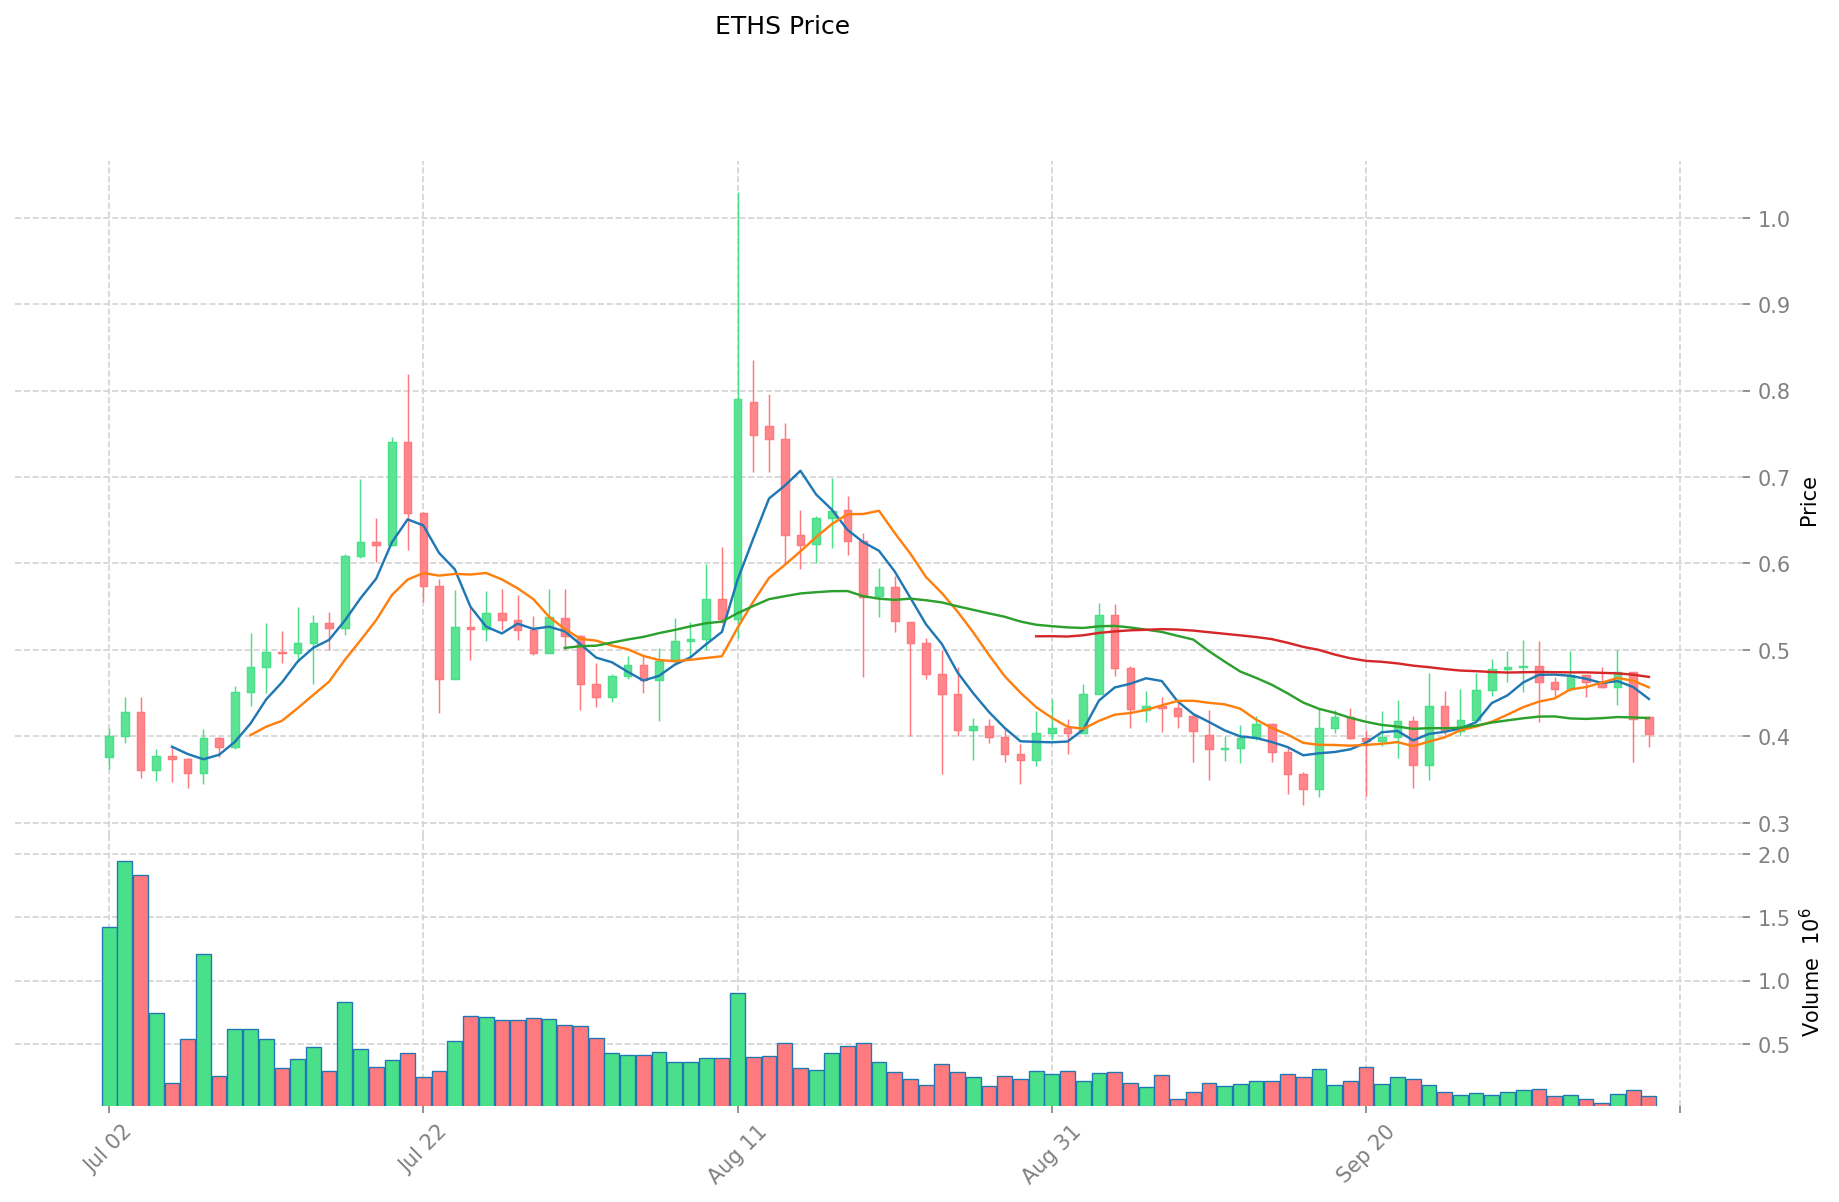
- 2024: ETHS reached an all-time high of $13.9 on January 5, 2024.
- 2025: ETHS hit an all-time low of $0.079 on April 7, 2025.
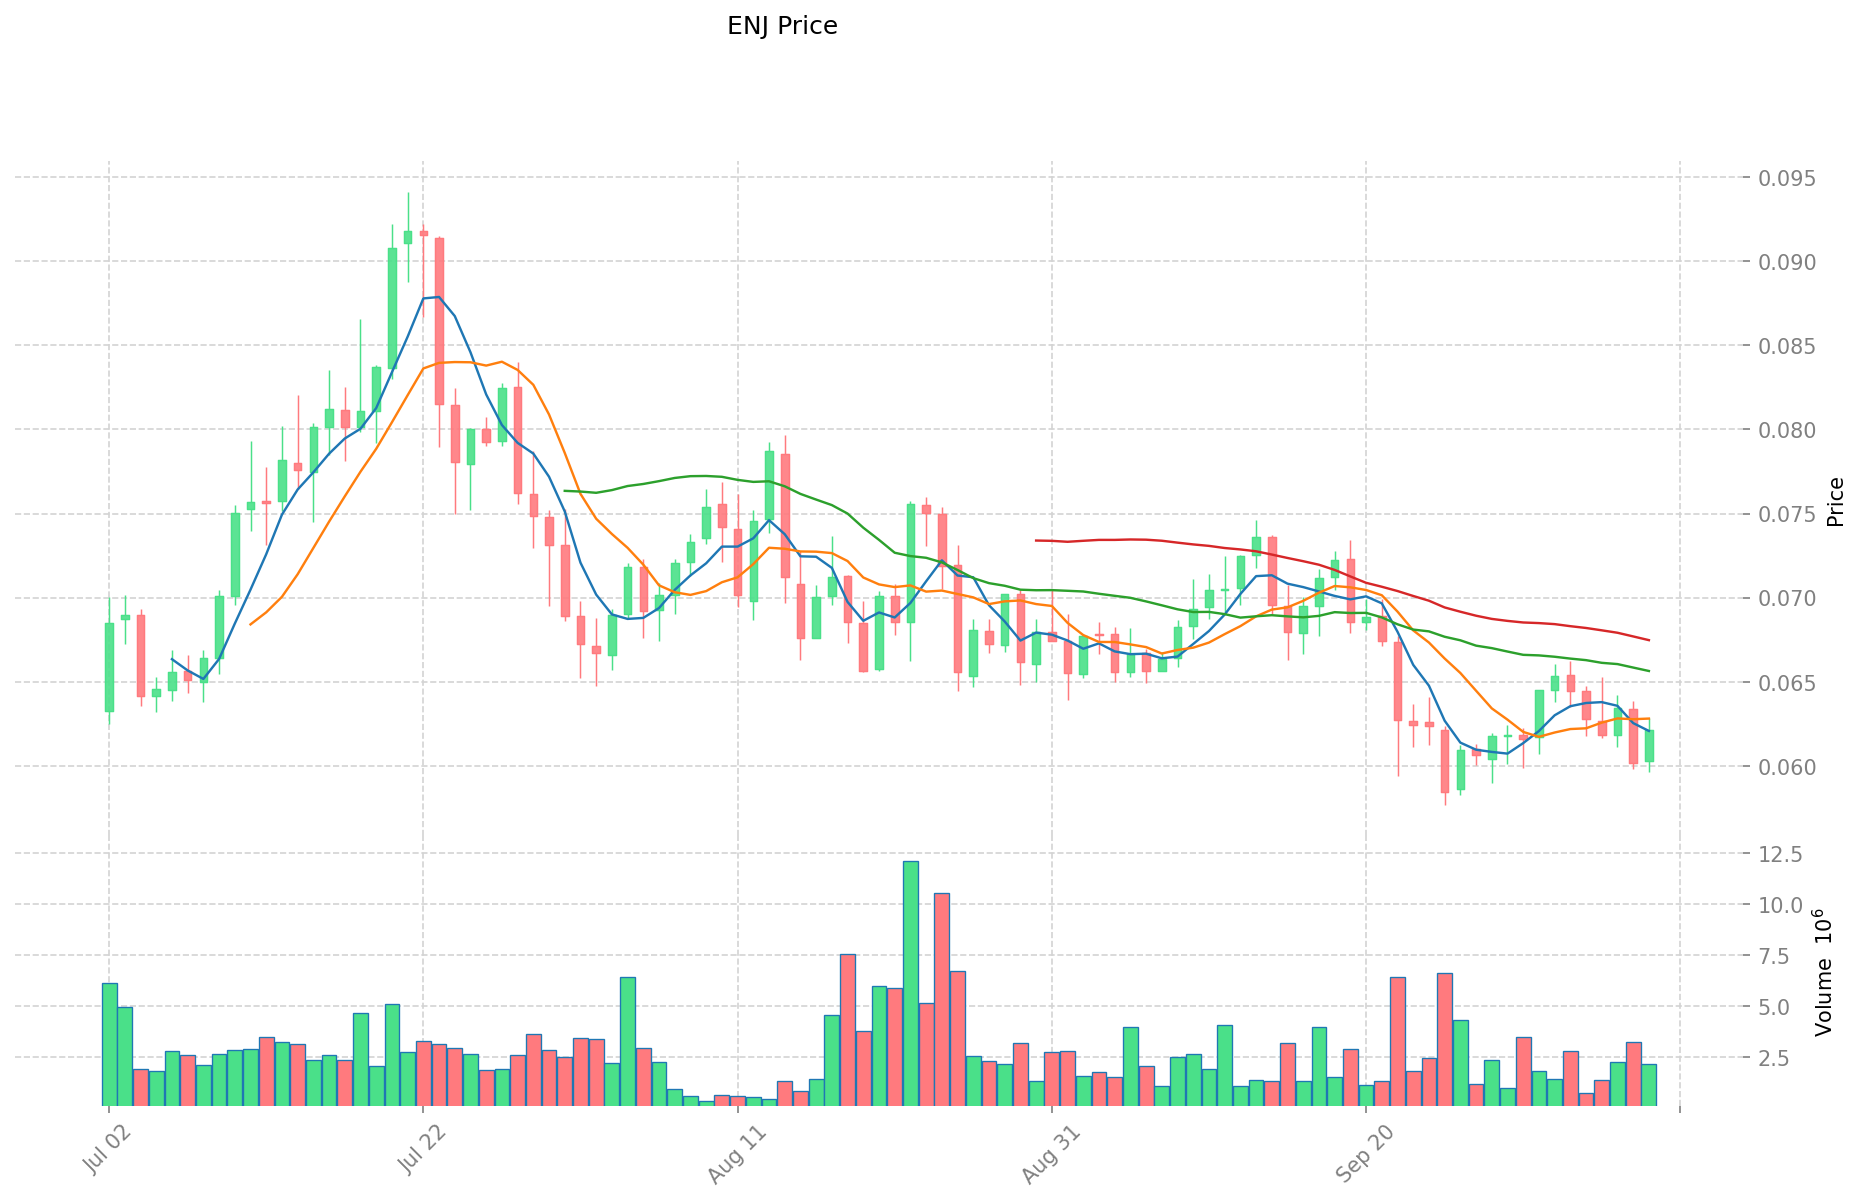
- Comparative analysis: In this market cycle, ETHS dropped from its peak of $13.9 to a low of $0.079, while ENJ's all-time high was $4.82 in November 2021.
Current Market Situation (2025-10-09)
- ETHS current price: $0.39604
- ENJ current price: $0.06197
- 24-hour trading volume: ETHS $37,593.22 vs ENJ $131,633.94
- Market Sentiment Index (Fear & Greed Index): 70 (Greed)
Click to view real-time prices:
- Check ETHS current price Market Price
- Check ENJ current price Market Price
II. Key Factors Affecting Investment Value of ETH vs ENJ
Supply Mechanism Comparison (Tokenomics)
- ETH: After the Ethereum 2.0 upgrade, ETH has shifted toward a deflationary model with EIP-1559 burning mechanism, while staking rewards create controlled issuance
- ENJ: Limited supply with a tokenization model where ENJ is locked in created gaming assets, effectively removing coins from circulation when used in games
Institutional Adoption and Market Applications
- Institutional Holdings: ETH has significantly more institutional interest with its market cap second only to Bitcoin, while ENJ has more niche gaming/NFT focused investment
- Enterprise Adoption: ETH serves as the foundation for thousands of dApps and enterprise blockchain solutions; ENJ focuses specifically on gaming industry integration
- Regulatory Stance: ETH has gained broader regulatory acceptance with ETF developments, while ENJ operates in the more specialized gaming token regulatory framework
Technical Development and Ecosystem Building
- ETH Technical Upgrades: Layer 2 scaling solutions and ETH 2.0 upgrade significantly impact transaction throughput and network efficiency
- ENJ Technical Development: Platform focused on enabling developers to easily integrate NFTs and digital assets into games and applications
- Ecosystem Comparison: ETH hosts a vast ecosystem spanning DeFi, NFTs, and smart contracts; ENJ specializes in gaming asset tokenization with wallet infrastructure
Macroeconomic Factors and Market Cycles
- Inflation Performance: ETH's prominence in the broader crypto ecosystem and potential deflationary mechanics provide some inflation hedge properties
- Monetary Policy Impact: Both tokens are influenced by broader crypto market sentiment which correlates with monetary policy shifts
- Geopolitical Factors: ETH has wider global adoption and use cases; ENJ's value is more tied to gaming industry developments and adoption
III. 2025-2030 Price Prediction: ETHS vs ENJ
Short-term Prediction (2025)
- ETHS: Conservative $0.32-$0.40 | Optimistic $0.40-$0.49
- ENJ: Conservative $0.047-$0.062 | Optimistic $0.062-$0.072
Mid-term Prediction (2027)
- ETHS may enter a volatile market, with prices expected between $0.23-$0.65
- ENJ may enter a steady growth phase, with prices expected between $0.054-$0.072
- Key drivers: Institutional capital inflow, ETF, ecosystem development
Long-term Prediction (2030)
- ETHS: Base scenario $0.49-$0.75 | Optimistic scenario $0.75-$0.80
- ENJ: Base scenario $0.075-$0.090 | Optimistic scenario $0.090-$0.115
Disclaimer
ETHS:
| 年份 | 预测最高价 | 预测平均价格 | 预测最低价 | 涨跌幅 |
|---|---|---|---|---|
| 2025 | 0.4871292 | 0.39604 | 0.3207924 | 0 |
| 2026 | 0.454832138 | 0.4415846 | 0.401841986 | 11 |
| 2027 | 0.64542005136 | 0.448208369 | 0.23306835188 | 13 |
| 2028 | 0.656177052216 | 0.54681421018 | 0.3937062313296 | 38 |
| 2029 | 0.89021353417304 | 0.601495631198 | 0.56540589332612 | 51 |
| 2030 | 0.798064403473506 | 0.74585458268552 | 0.492264024572443 | 88 |
ENJ:
| 年份 | 预测最高价 | 预测平均价格 | 预测最低价 | 涨跌幅 |
|---|---|---|---|---|
| 2025 | 0.0718968 | 0.06198 | 0.0471048 | 0 |
| 2026 | 0.07028532 | 0.0669384 | 0.040832424 | 8 |
| 2027 | 0.072042453 | 0.06861186 | 0.0535172508 | 10 |
| 2028 | 0.07595332902 | 0.0703271565 | 0.054151910505 | 13 |
| 2029 | 0.1075161568572 | 0.07314024276 | 0.051198169932 | 18 |
| 2030 | 0.114716813756922 | 0.0903281998086 | 0.074972405841138 | 45 |
IV. Investment Strategy Comparison: ETHS vs ENJ
Long-term vs Short-term Investment Strategies
- ETHS: Suitable for investors focused on Ethereum ecosystem growth and L1 scaling solutions
- ENJ: Suitable for investors interested in blockchain gaming and NFT market potential
Risk Management and Asset Allocation
- Conservative investors: ETHS: 60% vs ENJ: 40%
- Aggressive investors: ETHS: 70% vs ENJ: 30%
- Hedging tools: Stablecoin allocation, options, cross-currency portfolio
V. Potential Risk Comparison
Market Risks
- ETHS: Highly dependent on Ethereum network adoption and scalability success
- ENJ: Vulnerable to gaming industry trends and adoption rates of blockchain in gaming
Technical Risks
- ETHS: Scalability challenges, network stability during upgrades
- ENJ: Platform security, smart contract vulnerabilities
Regulatory Risks
- Global regulatory policies may have different impacts on layer 1 protocols like ETHS compared to gaming tokens like ENJ
VI. Conclusion: Which Is the Better Buy?
📌 Investment Value Summary:
- ETHS advantages: Potential for growth with Ethereum ecosystem expansion, deflationary mechanics
- ENJ advantages: Specialized focus on gaming industry, NFT integration potential
✅ Investment Advice:
- New investors: Consider a balanced approach with a slight bias towards ETHS due to its broader ecosystem
- Experienced investors: Evaluate personal risk tolerance and sector interests between general blockchain and gaming-specific exposure
- Institutional investors: Analyze long-term potential of Ethereum scaling solutions vs blockchain gaming market growth
⚠️ Risk Warning: The cryptocurrency market is highly volatile. This article does not constitute investment advice. None
VII. FAQ
Q1: What are the main differences between ETHS and ENJ in terms of their use cases? A: ETHS is primarily focused on secure expansion of the Ethereum mainnet as a decentralized L1 scaling protocol, while ENJ specializes in blockchain-based gaming, enabling the creation and management of virtual goods and assets within games and communities.
Q2: How do the current market prices of ETHS and ENJ compare? A: As of 2025-10-09, ETHS is priced at $0.39604, while ENJ is priced at $0.06197. ETHS has a higher individual token price, but it's important to consider market cap and circulating supply for a full comparison.
Q3: What are the key factors affecting the investment value of ETHS vs ENJ? A: Key factors include supply mechanisms (ETHS's deflationary model vs ENJ's limited supply), institutional adoption, technical development and ecosystem building, and macroeconomic factors such as inflation performance and monetary policy impacts.
Q4: How do analysts predict ETHS and ENJ prices will perform in the long term (2030)? A: For 2030, ETHS is predicted to reach $0.49-$0.80 in base to optimistic scenarios, while ENJ is expected to reach $0.075-$0.115. These predictions suggest potential growth for both tokens, with ETHS showing slightly higher upside potential.
Q5: What are the main risks associated with investing in ETHS and ENJ? A: For ETHS, risks include dependence on Ethereum network adoption and scalability success. For ENJ, risks are tied to gaming industry trends and blockchain adoption in gaming. Both face technical risks such as security vulnerabilities and potential regulatory challenges.
Q6: How might an investor allocate their portfolio between ETHS and ENJ? A: Conservative investors might consider allocating 60% to ETHS and 40% to ENJ, while more aggressive investors might opt for a 70% ETHS to 30% ENJ split. However, individual allocations should be based on personal risk tolerance and investment goals.
Share
Content