ERA vs XLM: Comparing Two Promising Cryptocurrencies in the Digital Asset Space
Introduction: Investment Comparison between ERA and XLM
In the cryptocurrency market, the comparison between Caldera vs Stellar has always been a topic that investors cannot avoid. The two not only have significant differences in market cap ranking, application scenarios, and price performance, but also represent different cryptocurrency positioning.
Stellar (XLM): Since its launch in 2014, it has gained market recognition for its efficiency in cross-border payments.
Caldera (ERA): Launched in 2025, it has been hailed as "The Internet of Rollups", making crypto faster, cheaper, and more interconnected.
This article will provide a comprehensive analysis of the investment value comparison between Caldera vs Stellar, focusing on historical price trends, supply mechanisms, institutional adoption, technological ecosystems, and future predictions, attempting to answer the question that concerns investors the most:
"Which is the better buy right now?"
I. Price History Comparison and Current Market Status
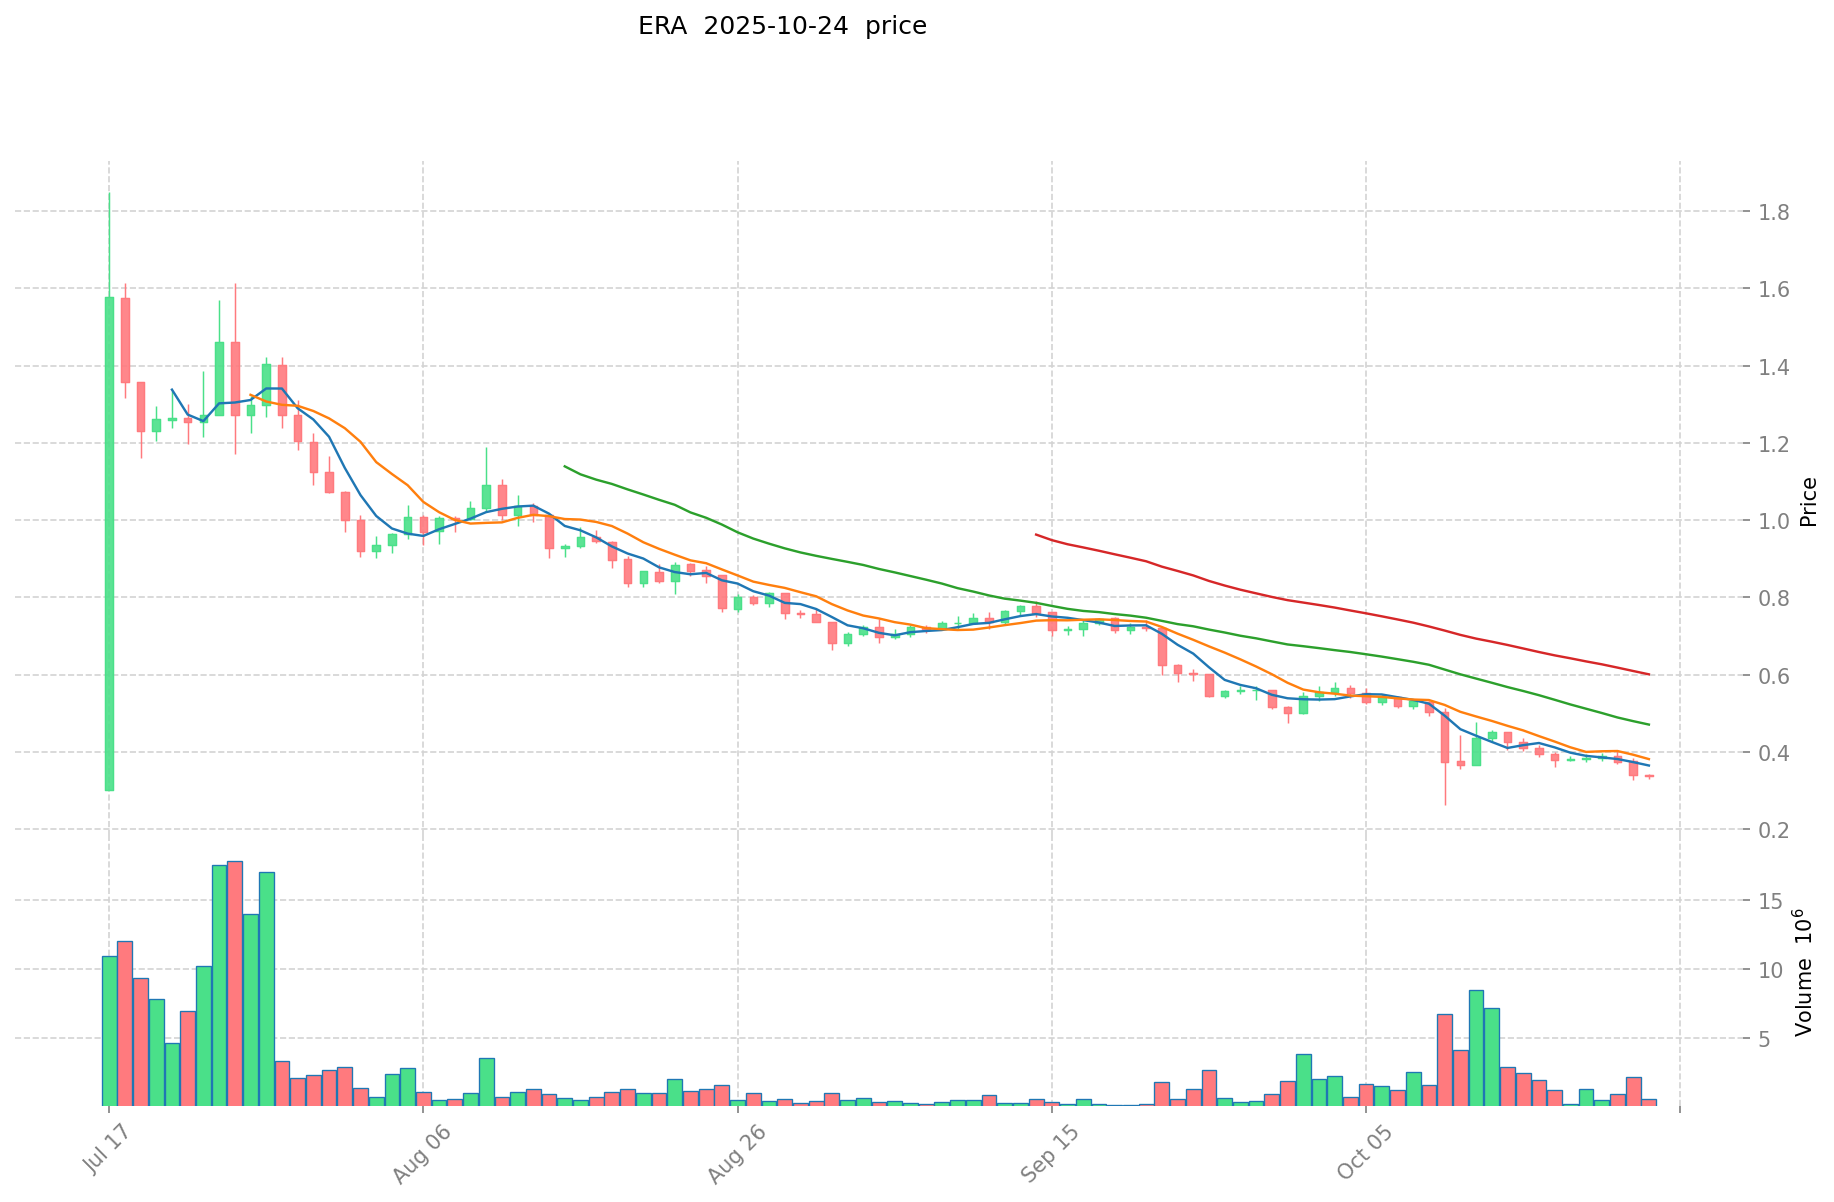
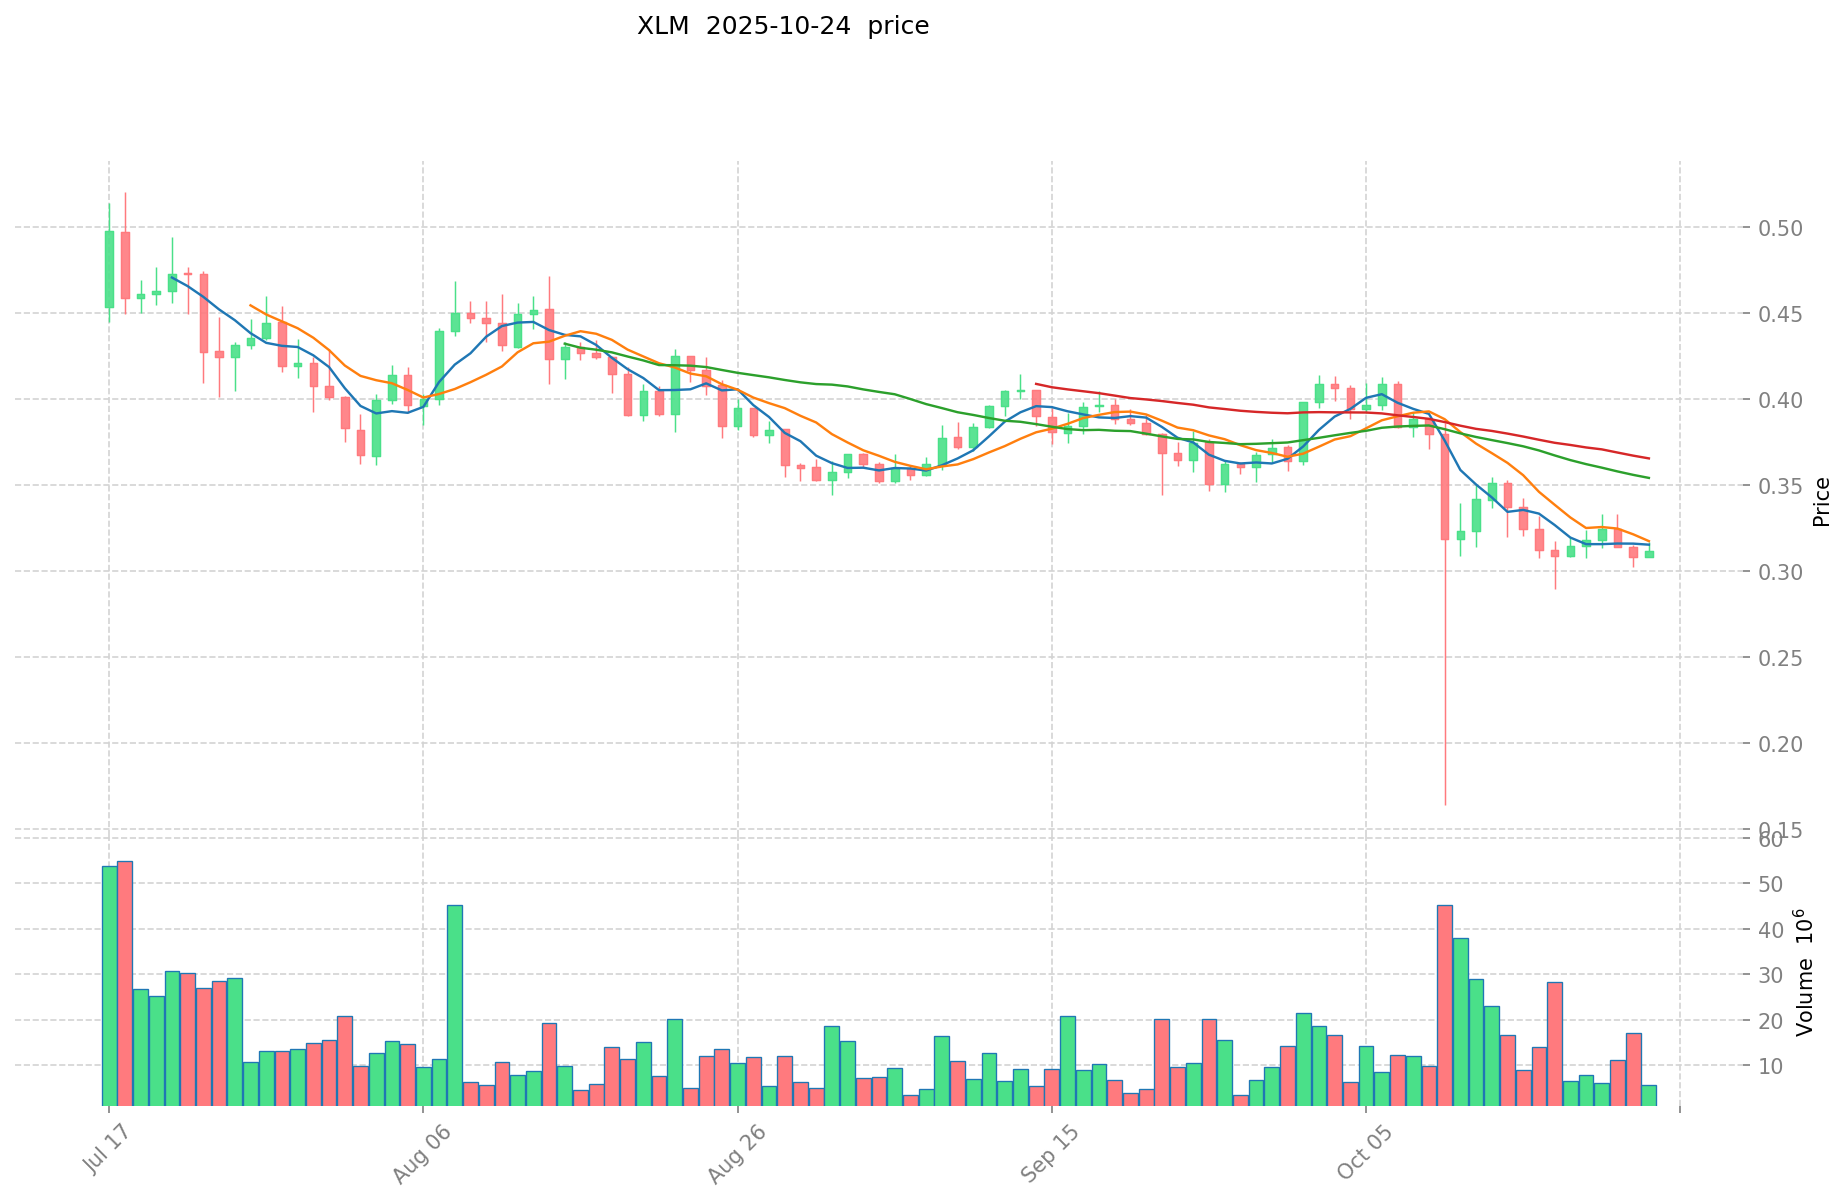
ERA (Caldera) and XLM (Stellar) Historical Price Trends
- 2025: ERA experienced significant price fluctuations due to its recent launch and market adoption.
- 2018: XLM reached its all-time high of $0.875563 on January 3rd, influenced by the overall crypto market bull run.
- Comparative analysis: In recent market cycles, ERA has shown high volatility as a newer asset, while XLM has demonstrated more established price patterns based on its longer market presence.
Current Market Situation (2025-10-24)
- ERA current price: $0.3371
- XLM current price: $0.31148
- 24-hour trading volume: ERA $186,163.93 vs XLM $1,763,657.83
- Market Sentiment Index (Fear & Greed Index): 27 (Fear)
Click to view real-time prices:
- Check ERA current price Market Price
- Check XLM current price Market Price
II. Core Factors Influencing ERA vs XLM Investment Value
Supply Mechanisms Comparison (Tokenomics)
- XRP: Controlled supply mechanism with escrow releases and potential token burns, as evidenced by Ripple's controlled sales mainly for On-Demand Liquidity transactions
- XLM: Recent price increase of 5x according to market reports, suggesting strong market performance
- 📌 Historical Pattern: Supply mechanisms can drive price cycles, with token burns or escrow policy changes significantly affecting scarcity and value
Institutional Adoption and Market Applications
- Institutional Holdings: Information not provided in source materials
- Enterprise Adoption: XRP is being utilized for On-Demand Liquidity (ODL) transactions according to Ripple's reports
- Regulatory Climate: Information not provided in source materials
Technical Development and Ecosystem Building
- XRP Technical Upgrades: Ripple is "actively steering XRP's evolution to ensure relevance in a fast-changing crypto landscape"
- XLM Technical Development: Associated with advanced NLP technology, with references to BERT improvements and BPE preprocessing techniques
- Ecosystem Comparison: Information not provided in source materials
Macroeconomic Factors and Market Cycles
- Market Sentiment: Investor sentiment and confidence directly impact price movements
- Product-Market Fit: Projects demonstrating genuine market demand and customer retention are more sustainable for long-term investment
- Token Pricing Balance: Projects must balance token launch price, market cap, and airdrop value to meet both airdrop recipients' and secondary market investors' expectations
III. 2025-2030 Price Prediction: ERA vs XLM
Short-term Prediction (2025)
- ERA: Conservative $0.256 - $0.337 | Optimistic $0.337 - $0.448
- XLM: Conservative $0.237 - $0.311 | Optimistic $0.311 - $0.408
Mid-term Prediction (2027)
- ERA may enter a growth phase, with an estimated price range of $0.292 - $0.674
- XLM may enter a steady growth phase, with an estimated price range of $0.382 - $0.569
- Key drivers: Institutional capital inflow, ETF, ecosystem development
Long-term Prediction (2030)
- ERA: Base scenario $0.453 - $0.730 | Optimistic scenario $0.730 - $0.847
- XLM: Base scenario $0.534 - $0.587 | Optimistic scenario $0.587 - $0.622
Disclaimer: The above predictions are based on historical data and market analysis. Cryptocurrency markets are highly volatile and subject to rapid changes. These predictions should not be considered as financial advice. Always conduct your own research before making any investment decisions.
ERA:
| 年份 | 预测最高价 | 预测平均价格 | 预测最低价 | 涨跌幅 |
|---|---|---|---|---|
| 2025 | 0.448077 | 0.3369 | 0.256044 | 0 |
| 2026 | 0.5494839 | 0.3924885 | 0.365014305 | 16 |
| 2027 | 0.673510266 | 0.4709862 | 0.292011444 | 39 |
| 2028 | 0.85264986717 | 0.572248233 | 0.37196135145 | 69 |
| 2029 | 0.74807150258925 | 0.712449050085 | 0.66257761657905 | 111 |
| 2030 | 0.847101920551065 | 0.730260276337125 | 0.452761371329017 | 116 |
XLM:
| 年份 | 预测最高价 | 预测平均价格 | 预测最低价 | 涨跌幅 |
|---|---|---|---|---|
| 2025 | 0.4078685 | 0.31135 | 0.236626 | 0 |
| 2026 | 0.453107655 | 0.35960925 | 0.294879585 | 15 |
| 2027 | 0.5689018335 | 0.4063584525 | 0.38197694535 | 30 |
| 2028 | 0.60953767875 | 0.487630143 | 0.44861973156 | 56 |
| 2029 | 0.6253856583975 | 0.548583910875 | 0.3620653811775 | 76 |
| 2030 | 0.622203871714425 | 0.58698478463625 | 0.534156154018987 | 88 |
IV. Investment Strategy Comparison: ERA vs XLM
Long-term vs Short-term Investment Strategy
- ERA: Suitable for investors focusing on ecosystem potential and innovative blockchain solutions
- XLM: Suitable for investors interested in cross-border payment applications and established market presence
Risk Management and Asset Allocation
- Conservative investors: ERA 30% vs XLM 70%
- Aggressive investors: ERA 60% vs XLM 40%
- Hedging tools: Stablecoin allocation, options, cross-currency portfolio
V. Potential Risk Comparison
Market Risk
- ERA: Higher volatility due to recent launch and market adoption phase
- XLM: Susceptible to broader crypto market trends and competition in the payment sector
Technical Risk
- ERA: Scalability, network stability
- XLM: Network congestion during high-volume periods, potential security vulnerabilities
Regulatory Risk
- Global regulatory policies may have differing impacts on both assets, particularly in relation to cross-border transactions and financial services
VI. Conclusion: Which Is the Better Buy?
📌 Investment Value Summary:
- ERA advantages: Innovative "Internet of Rollups" concept, potential for high growth in emerging blockchain solutions
- XLM advantages: Established market presence, proven track record in cross-border payments, more stable price history
✅ Investment Advice:
- New investors: Consider a balanced approach, leaning towards XLM for its established history
- Experienced investors: Explore a mix of both, with a higher allocation to ERA for potential growth
- Institutional investors: Evaluate ERA's ecosystem development and XLM's payment network adoption for strategic positioning
⚠️ Risk Warning: The cryptocurrency market is highly volatile. This article does not constitute investment advice. None
VII. FAQ
Q1: What are the key differences between ERA and XLM? A: ERA is a newer cryptocurrency launched in 2025, focusing on being "The Internet of Rollups" to make crypto faster and more interconnected. XLM, launched in 2014, is known for its efficiency in cross-border payments. ERA shows higher volatility due to its recent launch, while XLM has a more established price history.
Q2: Which cryptocurrency has shown better recent price performance? A: According to recent market data, XLM has shown a 5x price increase, suggesting strong market performance. ERA, being newer, has experienced significant price fluctuations due to its recent launch and market adoption phase.
Q3: How do the supply mechanisms of ERA and XLM compare? A: Specific details about ERA's supply mechanism are not provided in the given information. XLM has a controlled supply mechanism with potential token burns, which can significantly affect its scarcity and value.
Q4: What are the long-term price predictions for ERA and XLM? A: By 2030, ERA is predicted to reach $0.453 - $0.847 in optimistic scenarios, while XLM is expected to reach $0.534 - $0.622. However, these predictions are subject to market volatility and should not be considered financial advice.
Q5: How should investors allocate their portfolio between ERA and XLM? A: For conservative investors, a suggested allocation is 30% ERA and 70% XLM. For aggressive investors, the recommendation is 60% ERA and 40% XLM. This allocation should be adjusted based on individual risk tolerance and market conditions.
Q6: What are the main risks associated with investing in ERA and XLM? A: ERA faces higher volatility risk due to its recent launch and adoption phase. XLM is susceptible to broader crypto market trends and competition in the payment sector. Both face potential regulatory risks, especially concerning cross-border transactions and financial services.
Q7: Which cryptocurrency is better suited for different types of investors? A: New investors might consider leaning towards XLM for its established history. Experienced investors could explore a mix of both, with a higher allocation to ERA for potential growth. Institutional investors should evaluate ERA's ecosystem development and XLM's payment network adoption for strategic positioning.
Share
Content
Introduction: Investment Comparison between ERA and XLM
I. Price History Comparison and Current Market Status
II. Core Factors Influencing ERA vs XLM Investment Value
III. 2025-2030 Price Prediction: ERA vs XLM
IV. Investment Strategy Comparison: ERA vs XLM
V. Potential Risk Comparison
VI. Conclusion: Which Is the Better Buy?
VII. FAQ

