DCB vs QNT: A Comparative Analysis of Digital Central Bank Currencies and Quant Network Technologies
Introduction: DCB vs QNT Investment Comparison
In the cryptocurrency market, the comparison between Decubate (DCB) and Quant (QNT) has been an unavoidable topic for investors. The two not only show significant differences in market cap ranking, application scenarios, and price performance but also represent different positioning in crypto assets.
Decubate (DCB): Since its launch in 2021, it has gained market recognition for its all-in-one platform for Web3 success and DeFi solutions.
Quant (QNT): Introduced in 2018, it has been hailed as a technology provider enabling trusted digital interaction, recognized for solving interoperability through its global blockchain operating system, Overledger.
This article will comprehensively analyze the investment value comparison between DCB and QNT, focusing on historical price trends, supply mechanisms, institutional adoption, technological ecosystems, and future predictions, attempting to answer the question that concerns investors the most:
"Which is the better buy right now?"
I. Price History Comparison and Current Market Status
DCB and QNT Historical Price Trends
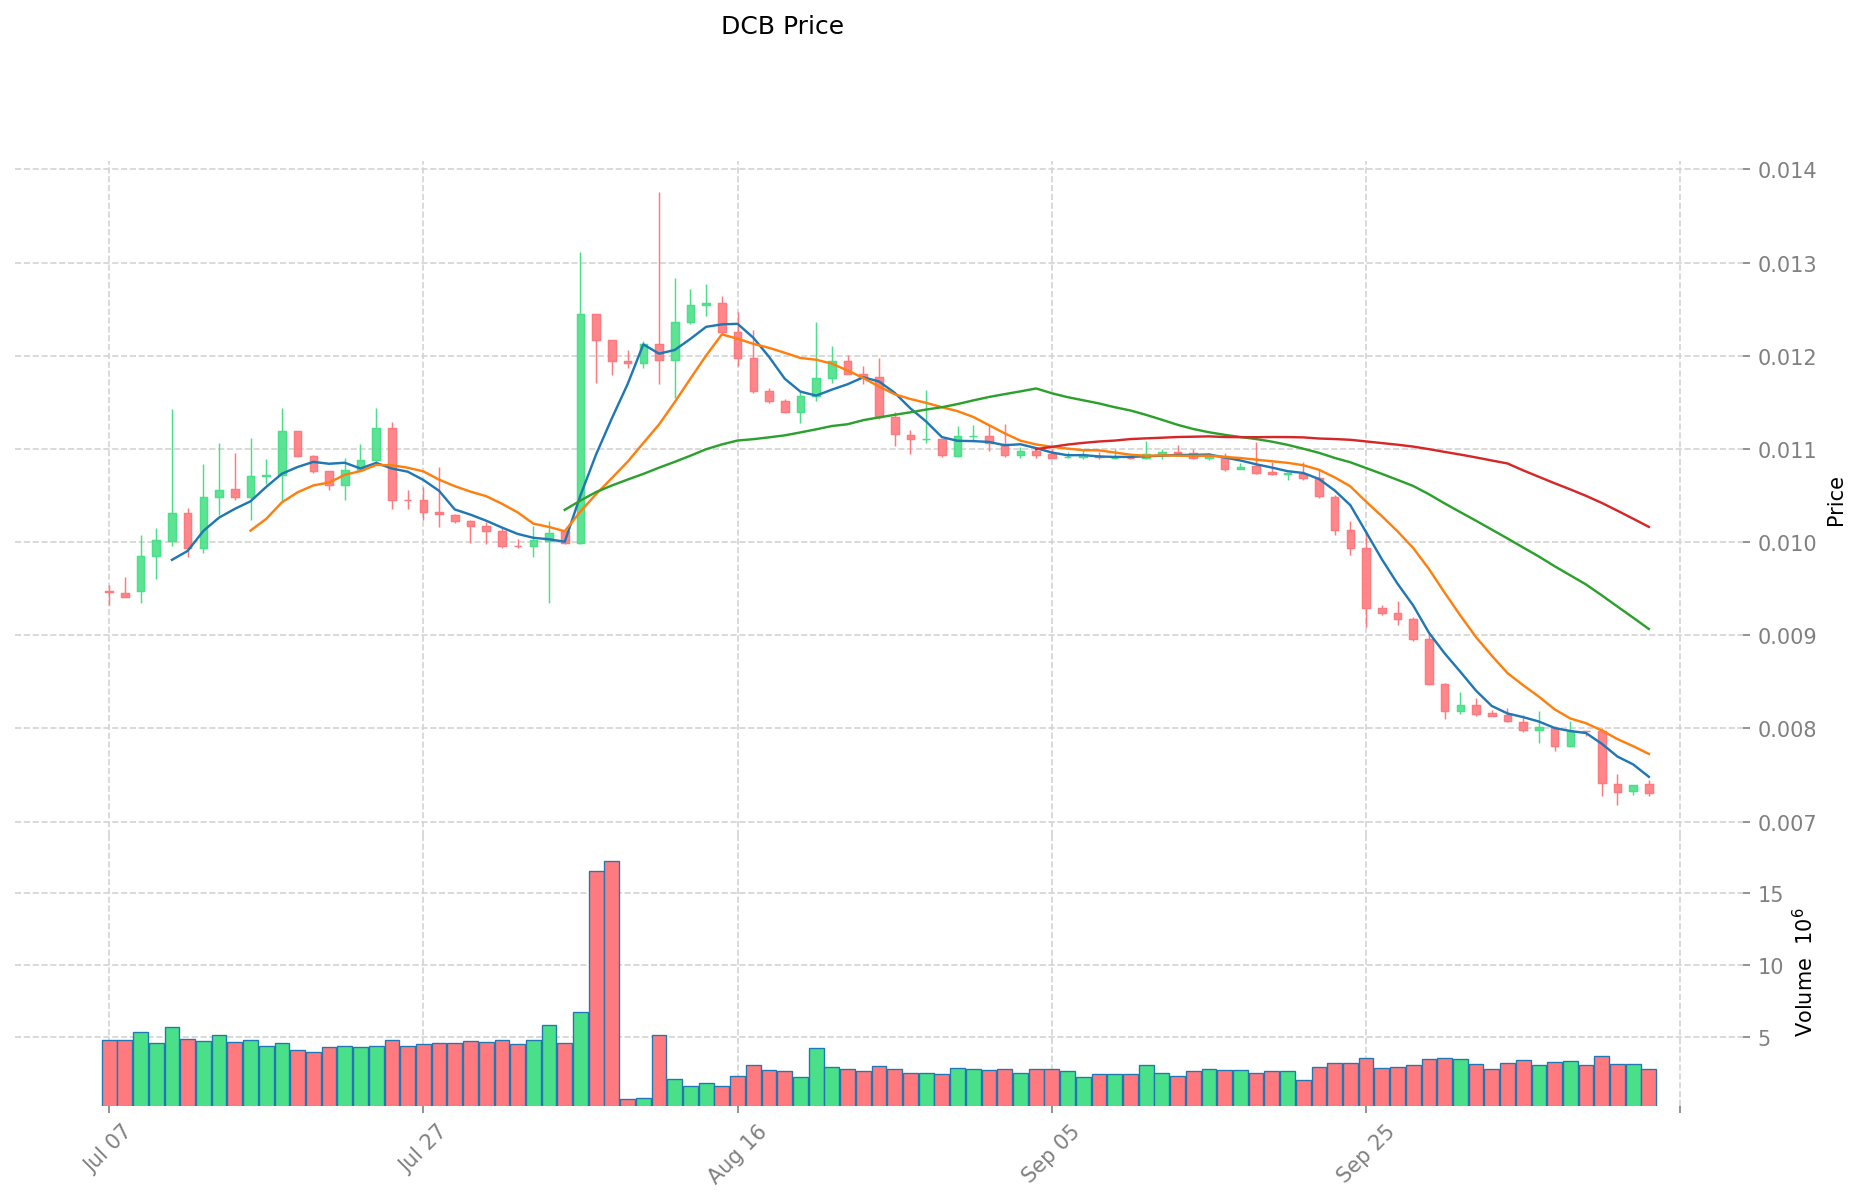
- 2024: DCB reached its all-time high of $0.19998 on March 29, 2024.
- 2025: DCB hit its all-time low of $0.007175 on October 11, 2025.
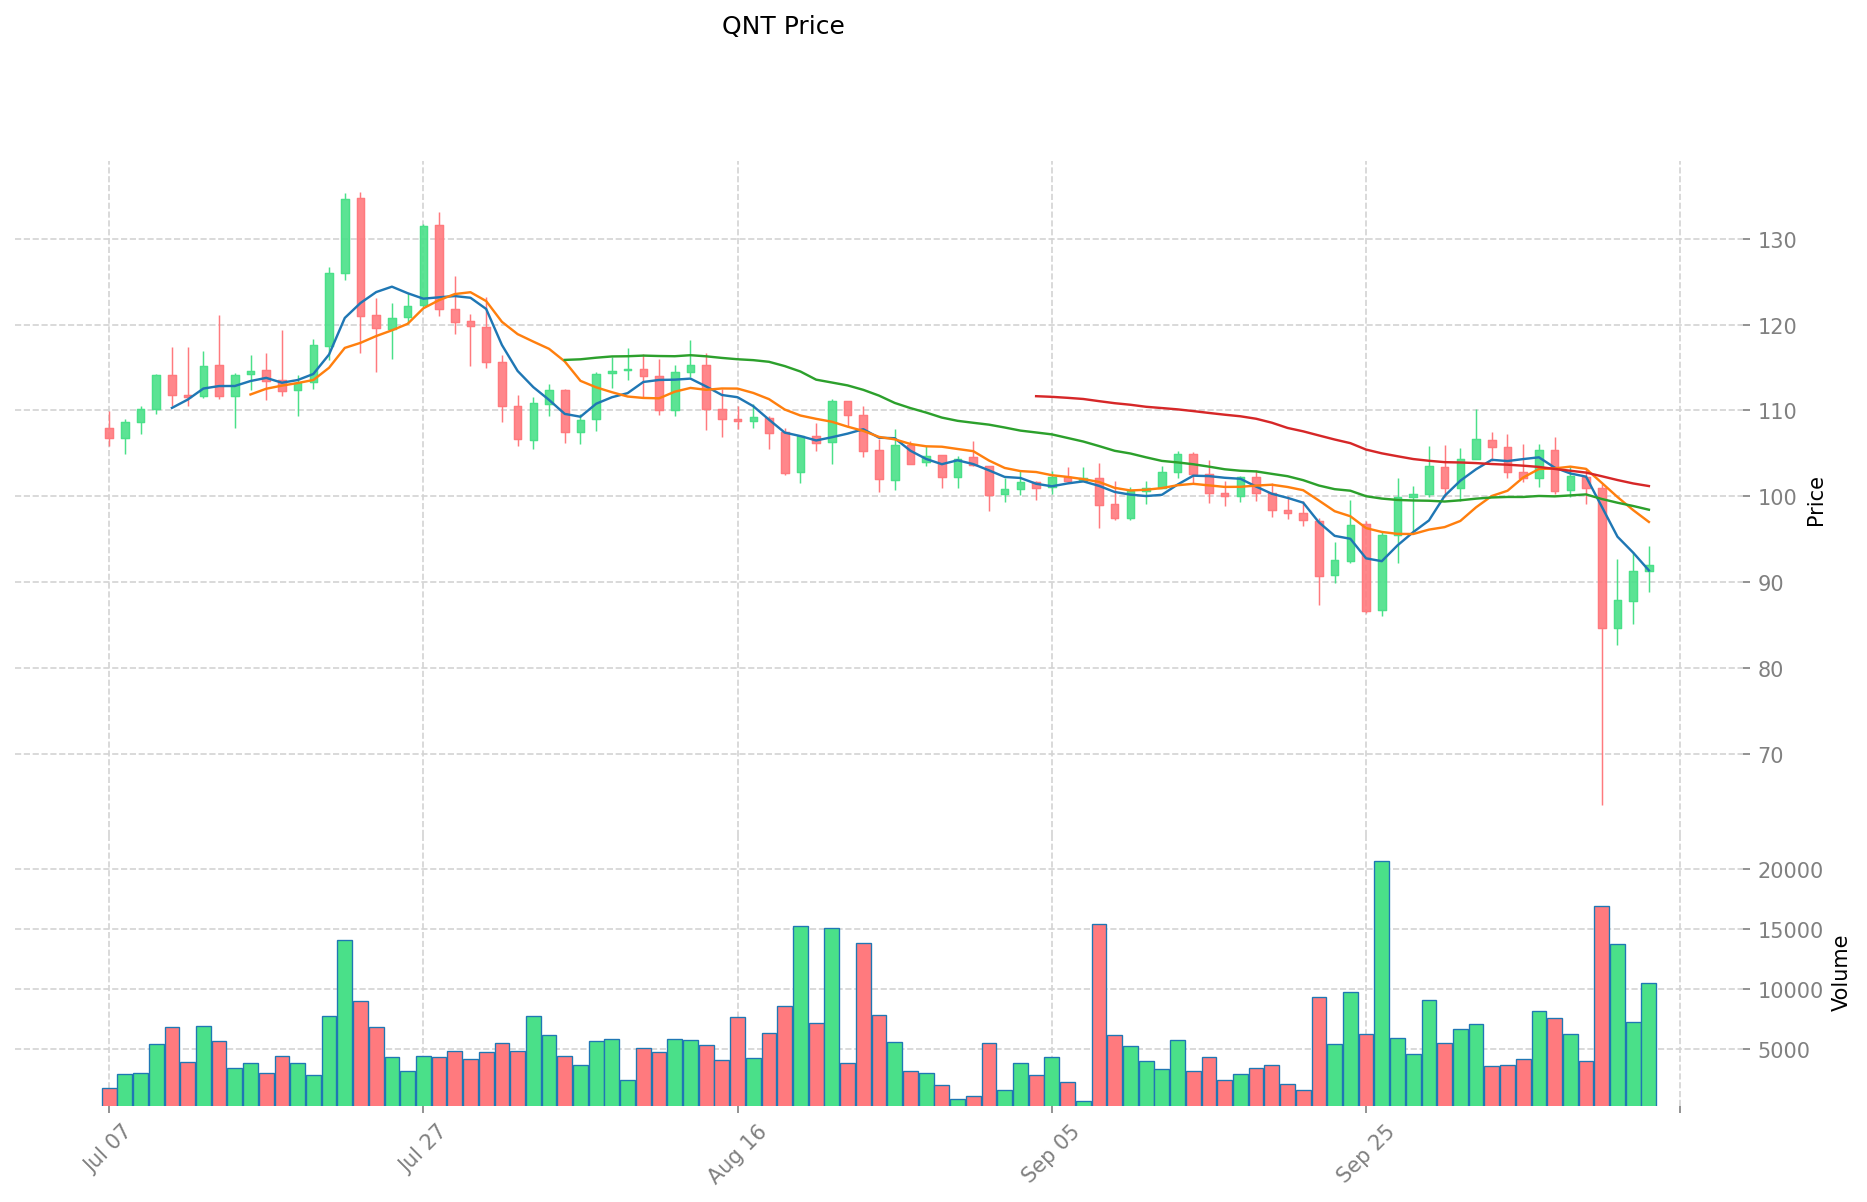
- Comparative analysis: Within this market cycle, DCB dropped from its high of $0.19998 to a low of $0.007175, representing a significant decline of about 96.4%. In contrast, QNT has shown more stability, with its current price of $91.93 being well above its all-time low of $0.215773.
Current Market Situation (2025-10-14)
- DCB current price: $0.007306
- QNT current price: $91.93
- 24-hour trading volume: DCB $20,289.04 vs QNT $940,395.69
- Market Sentiment Index (Fear & Greed Index): 38 (Fear)
Click to view real-time prices:
- View DCB current price Market Price
- View QNT current price Market Price
II. Core Factors Affecting DCB vs QNT Investment Value
Supply Mechanism Comparison (Tokenomics)
- DCB: Fixed supply of 1 billion tokens with deflationary mechanism through token burning
- QNT: Limited supply of 14.6 million tokens with no additional issuance
- 📌 Historical pattern: Deflationary tokenomics have historically supported price appreciation for both assets, with QNT's significantly smaller supply potentially creating higher scarcity value.
Institutional Adoption and Market Applications
- Institutional holdings: QNT has gained more institutional traction with integration into major financial networks
- Enterprise adoption: QNT has stronger enterprise applications through Overledger OS for cross-border payments and settlements, while DCB focuses on DeFi ecosystem development
- Regulatory stance: Both assets face varied regulatory approaches across jurisdictions, with QNT potentially having an advantage due to its enterprise compliance focus
Technical Development and Ecosystem Building
- DCB technical upgrades: Expanding DeFi functionality with focus on cross-chain interoperability
- QNT technical development: Continued enhancement of Overledger Network enabling interoperability between different blockchain networks and traditional systems
- Ecosystem comparison: QNT has stronger enterprise blockchain integration while DCB emphasizes DeFi applications and retail user experience
Macroeconomic and Market Cycles
- Performance in inflationary environments: QNT may offer better inflation resistance due to its extremely limited supply and enterprise utility
- Macroeconomic monetary policy: Interest rate changes likely affect both assets similarly, though QNT's utility-based demand may provide better insulation during tightening cycles
- Geopolitical factors: QNT potentially benefits more from increased cross-border transaction demand due to its focus on interoperability between financial systems
III. 2025-2030 Price Prediction: DCB vs QNT
Short-term Prediction (2025)
- DCB: Conservative $0.00503838 - $0.007302 | Optimistic $0.007302 - $0.0091275
- QNT: Conservative $68.1836 - $92.14 | Optimistic $92.14 - $127.1532
Mid-term Prediction (2027)
- DCB may enter a growth phase, with expected price range of $0.0078849277875 - $0.0109999609875
- QNT may enter a bullish market, with expected price range of $101.01741258 - $181.34451174
- Key drivers: Institutional capital inflow, ETF, ecosystem development
Long-term Prediction (2030)
- DCB: Base scenario $0.007417699163601 - $0.011964030909034 | Optimistic scenario $0.011964030909034 - $0.013638995236299
- QNT: Base scenario $125.824334350330035 - $182.3541077541015 | Optimistic scenario $182.3541077541015 - $237.06034008033195
DCB:
| 年份 | 预测最高价 | 预测平均价格 | 预测最低价 | 涨跌幅 |
|---|---|---|---|---|
| 2025 | 0.0091275 | 0.007302 | 0.00503838 | 0 |
| 2026 | 0.0112542075 | 0.00821475 | 0.0056681775 | 12 |
| 2027 | 0.0109999609875 | 0.00973447875 | 0.0078849277875 | 33 |
| 2028 | 0.012751680438562 | 0.01036721986875 | 0.009952531074 | 41 |
| 2029 | 0.012368611664412 | 0.011559450153656 | 0.009363154624461 | 58 |
| 2030 | 0.013638995236299 | 0.011964030909034 | 0.007417699163601 | 63 |
QNT:
| 年份 | 预测最高价 | 预测平均价格 | 预测最低价 | 涨跌幅 |
|---|---|---|---|---|
| 2025 | 127.1532 | 92.14 | 68.1836 | 0 |
| 2026 | 133.768852 | 109.6466 | 105.260736 | 19 |
| 2027 | 181.34451174 | 121.707726 | 101.01741258 | 32 |
| 2028 | 190.9229097762 | 151.52611887 | 113.6445891525 | 65 |
| 2029 | 193.483701185103 | 171.2245143231 | 150.677572604328 | 86 |
| 2030 | 237.06034008033195 | 182.3541077541015 | 125.824334350330035 | 98 |
IV. Investment Strategy Comparison: DCB vs QNT
Long-term vs Short-term Investment Strategy
- DCB: Suitable for investors focusing on DeFi ecosystem potential and cross-chain interoperability
- QNT: Suitable for investors seeking enterprise blockchain adoption and interoperability solutions
Risk Management and Asset Allocation
- Conservative investors: DCB: 20% vs QNT: 80%
- Aggressive investors: DCB: 40% vs QNT: 60%
- Hedging tools: Stablecoin allocation, options, cross-currency portfolio
V. Potential Risk Comparison
Market Risk
- DCB: Higher volatility, lower liquidity, and potential for rapid price swings
- QNT: Exposure to enterprise adoption cycles and competition in the interoperability space
Technical Risk
- DCB: Scalability, network stability, and cross-chain security
- QNT: Overledger network upgrades, integration challenges with legacy systems
Regulatory Risk
- Global regulatory policies may impact both assets differently, with QNT potentially facing less scrutiny due to its enterprise focus
VI. Conclusion: Which Is the Better Buy?
📌 Investment Value Summary:
- DCB advantages: DeFi ecosystem focus, deflationary tokenomics, potential for high growth
- QNT advantages: Strong enterprise adoption, limited supply, established interoperability solution
✅ Investment Advice:
- New investors: Consider a small allocation to QNT for exposure to enterprise blockchain adoption
- Experienced investors: Balanced portfolio with both DCB and QNT, adjusting based on risk tolerance
- Institutional investors: Focus on QNT for its enterprise-grade solutions and potential for widespread adoption
⚠️ Risk Warning: The cryptocurrency market is highly volatile, and this article does not constitute investment advice. None
VII. FAQ
Q1: What are the main differences between DCB and QNT? A: DCB focuses on DeFi solutions and a Web3 success platform, while QNT provides interoperability solutions through its Overledger network for enterprise blockchain adoption. DCB has a larger supply of 1 billion tokens with a deflationary mechanism, while QNT has a limited supply of 14.6 million tokens.
Q2: Which cryptocurrency has shown better price stability? A: Based on historical data, QNT has shown more price stability compared to DCB. While DCB experienced a significant decline of about 96.4% from its all-time high to its all-time low, QNT's current price remains well above its all-time low.
Q3: How do institutional adoption and market applications differ between DCB and QNT? A: QNT has gained more institutional traction and has stronger enterprise applications, particularly in cross-border payments and settlements. DCB, on the other hand, focuses more on DeFi ecosystem development and retail user experience.
Q4: What are the predicted price ranges for DCB and QNT in 2030? A: For DCB, the base scenario predicts a range of $0.007417699163601 - $0.011964030909034, with an optimistic scenario of $0.011964030909034 - $0.013638995236299. For QNT, the base scenario predicts a range of $125.824334350330035 - $182.3541077541015, with an optimistic scenario of $182.3541077541015 - $237.06034008033195.
Q5: How should investors allocate their portfolio between DCB and QNT? A: Conservative investors might consider allocating 20% to DCB and 80% to QNT, while aggressive investors might opt for 40% DCB and 60% QNT. However, these allocations should be adjusted based on individual risk tolerance and investment goals.
Q6: What are the main risks associated with investing in DCB and QNT? A: DCB faces higher volatility, lower liquidity, and potential scalability issues. QNT is exposed to enterprise adoption cycles and competition in the interoperability space. Both face regulatory risks, though QNT may face less scrutiny due to its enterprise focus.
Share
Content