BTS vs XLM: The Battle of Digital Assets in the Music Industry
Introduction: BTS vs XLM Investment Comparison
In the cryptocurrency market, BitShares vs Stellar has always been a topic that investors can't avoid. The two not only have significant differences in market cap ranking, application scenarios, and price performance, but also represent different cryptocurrency asset positioning.
BitShares (BTS): Since its launch in 2014, it has gained market recognition for its focus on high-performance financial smart contracts.
Stellar (XLM): Since its introduction in 2014, it has been hailed as a decentralized gateway for transmitting digital and fiat currencies, enabling fast, stable, and extremely low-cost transfers of digital assets between banks, payment institutions, and individuals.
This article will comprehensively analyze the investment value comparison between BitShares and Stellar, focusing on historical price trends, supply mechanisms, institutional adoption, technical ecosystems, and future predictions, and attempt to answer the question investors care about most:
"Which is the better buy right now?"
I. Price History Comparison and Current Market Status
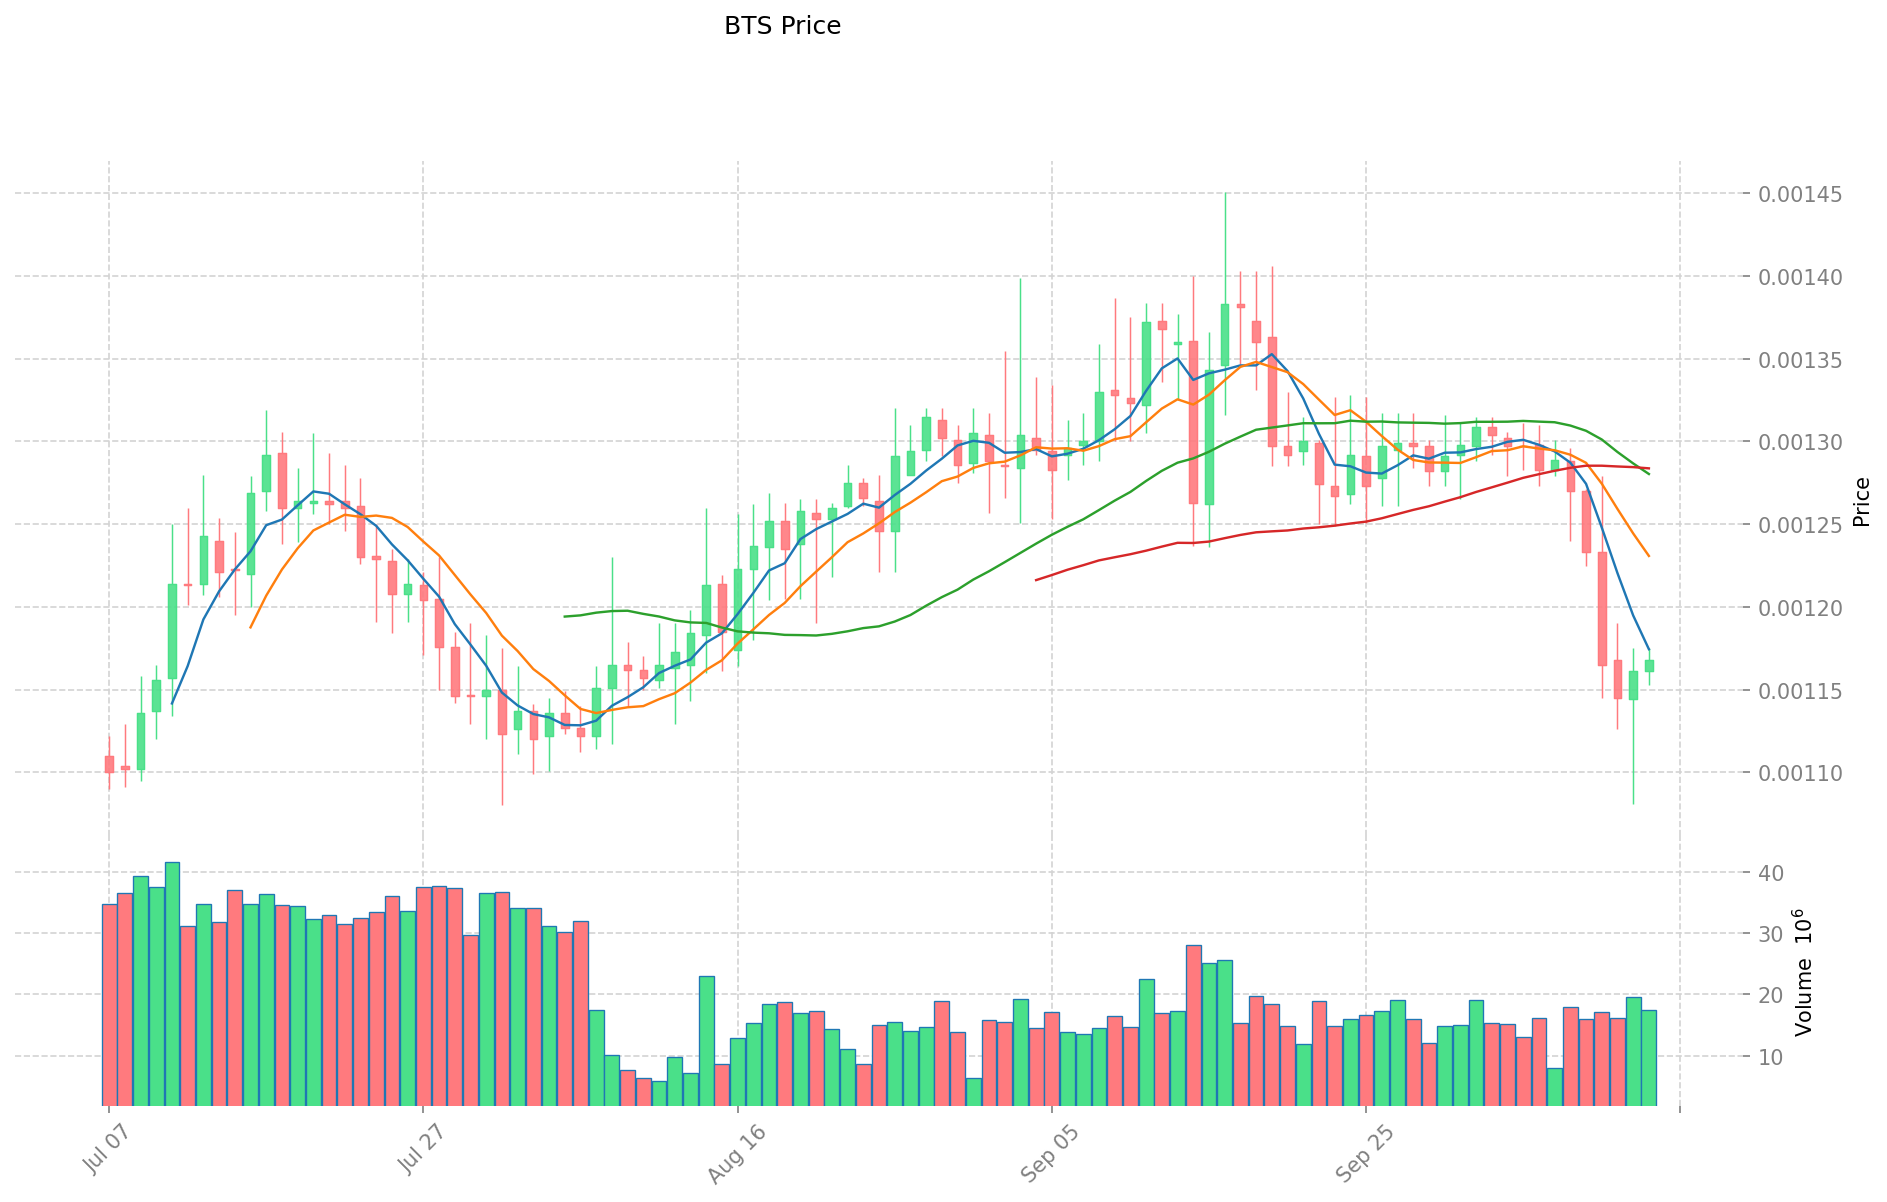
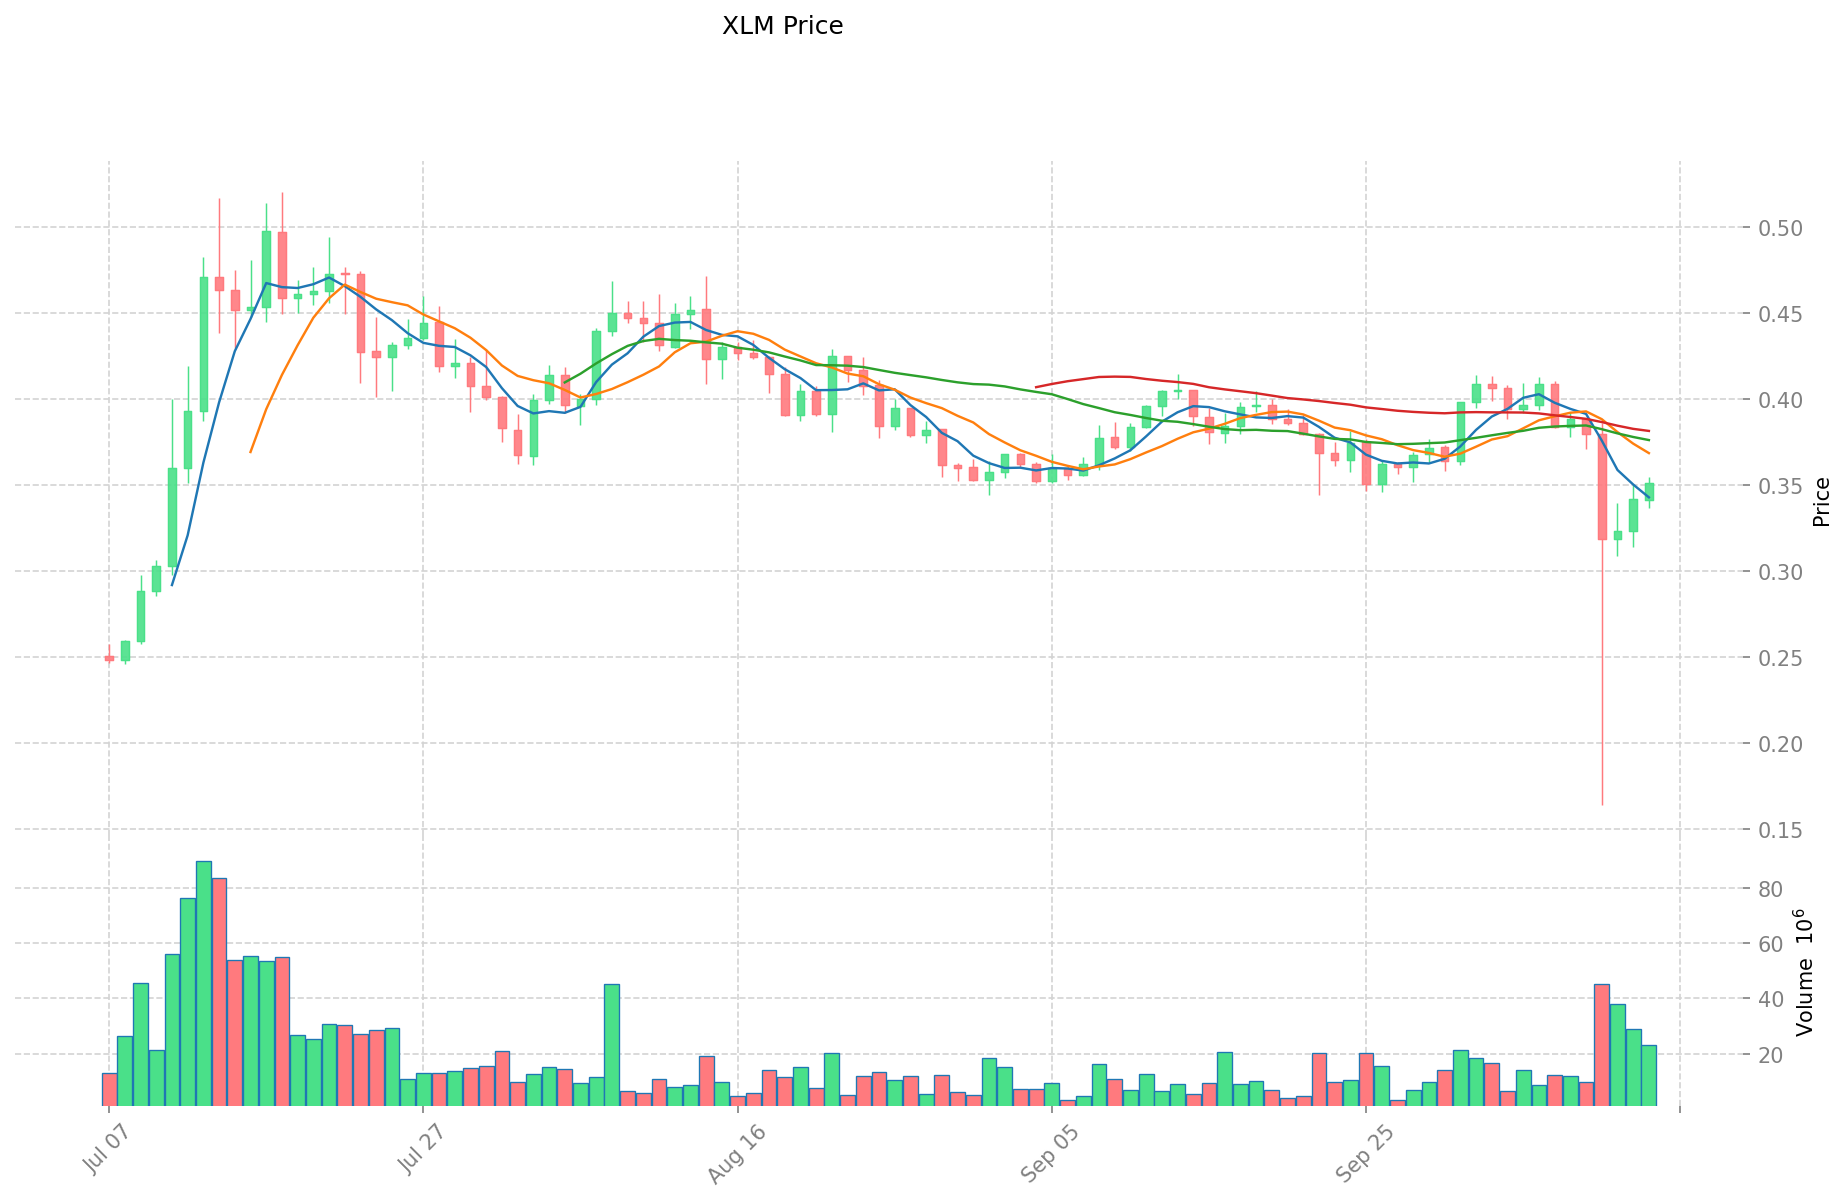
BitShares (BTS) and Stellar (XLM) Historical Price Trends
- 2018: XLM reached its all-time high of $0.875563 on January 3, 2018.
- 2015: XLM hit its all-time low of $0.00047612 on March 5, 2015.
- Comparative analysis: BTS's all-time high was $0.923921 on January 3, 2018, while its all-time low was $0.0000032 on September 18, 2025. XLM has shown a wider price range historically.
Current Market Situation (2025-10-14)
- BTS current price: $0.001169
- XLM current price: $0.35186
- 24-hour trading volume: BTS $20,410.51 vs XLM $7,953,806.57
- Market Sentiment Index (Fear & Greed Index): 38 (Fear)
Click to view real-time prices:
- Check BTS current price Market Price
- Check XLM current price Market Price
II. Key Factors Influencing Investment Value of BTS vs XLM
Supply Mechanism Comparison (Tokenomics)
- BTS: Fixed supply model with 2.6 billion BTS in circulation, designed to avoid inflation
- XLM: Uses a disinflationary model with initial 100 billion XLM supply; shifted from 1% annual inflation to no new XLM creation after 2019 vote
- 📌 Historical Pattern: Fixed supply assets like BTS tend to maintain value over time, while XLM's shift to a non-inflationary model was intended to preserve long-term value by preventing dilution.
Institutional Adoption and Market Applications
- Institutional Holdings: XLM has gained more institutional traction, with Stellar Development Foundation partnerships with financial institutions and payment providers
- Enterprise Adoption: XLM has stronger adoption in cross-border payments through Stellar network partnerships with MoneyGram and banking institutions; BTS has been used primarily within its own ecosystem
- Regulatory Stance: Both face varied regulatory approaches globally, though XLM's compliance-focused approach and work with established financial institutions has resulted in generally better regulatory reception
Technical Development and Ecosystem Building
- BTS Technical Status: Bitshares has maintained its decentralized exchange functionality but has seen limited major technical innovations in recent years
- XLM Technical Development: Continued development with Soroban smart contracts platform and regular protocol upgrades to enhance scalability and functionality
- Ecosystem Comparison: XLM has a more diverse ecosystem spanning payment solutions, asset tokenization, and emerging DeFi applications; BTS ecosystem primarily centers around its DEX functionality
Macroeconomic Factors and Market Cycles
- Inflation Performance: Both have potential inflation-resistant properties due to their limited supply mechanisms, though neither has been thoroughly tested as inflation hedges
- Monetary Policy Impact: Both cryptocurrencies show sensitivity to broader market conditions and central bank policies
- Geopolitical Factors: XLM's focus on cross-border payments potentially positions it to benefit from increasing demand for alternative international payment systems
III. 2025-2030 Price Prediction: BTS vs XLM
Short-term Prediction (2025)
- BTS: Conservative $0.00074752 - $0.001168 | Optimistic $0.001168 - $0.00131984
- XLM: Conservative $0.2706319 - $0.35147 | Optimistic $0.35147 - $0.3901317
Mid-term Prediction (2027)
- BTS may enter a growth phase, with prices expected in the range of $0.000981079704 - $0.001531078932
- XLM may enter a steady growth phase, with prices expected in the range of $0.3002559882875 - $0.3990744148125
- Key drivers: Institutional capital inflow, ETF, ecosystem development
Long-term Prediction (2030)
- BTS: Base scenario $0.001695116201751 - $0.002017188280083 | Optimistic scenario $0.002017188280083
- XLM: Base scenario $0.584563490184466 - $0.672248013712136 | Optimistic scenario $0.672248013712136
Disclaimer: The above predictions are based on historical data and market analysis. Cryptocurrency markets are highly volatile and subject to rapid changes. These projections should not be considered as financial advice. Always conduct your own research before making investment decisions.
BTS:
| 年份 | 预测最高价 | 预测平均价格 | 预测最低价 | 涨跌幅 |
|---|---|---|---|---|
| 2025 | 0.00131984 | 0.001168 | 0.00074752 | 0 |
| 2026 | 0.0017290488 | 0.00124392 | 0.0008583048 | 6 |
| 2027 | 0.001531078932 | 0.0014864844 | 0.000981079704 | 27 |
| 2028 | 0.00172001109924 | 0.001508781666 | 0.00110141061618 | 29 |
| 2029 | 0.001775836020882 | 0.00161439638262 | 0.00114622143166 | 38 |
| 2030 | 0.002017188280083 | 0.001695116201751 | 0.001373044123418 | 45 |
XLM:
| 年份 | 预测最高价 | 预测平均价格 | 预测最低价 | 涨跌幅 |
|---|---|---|---|---|
| 2025 | 0.3901317 | 0.35147 | 0.2706319 | 0 |
| 2026 | 0.3893408925 | 0.37080085 | 0.3003486885 | 5 |
| 2027 | 0.3990744148125 | 0.38007087125 | 0.3002559882875 | 8 |
| 2028 | 0.557088879534687 | 0.38957264303125 | 0.222056406527812 | 10 |
| 2029 | 0.695796219085964 | 0.473330761282968 | 0.241398688254314 | 34 |
| 2030 | 0.672248013712136 | 0.584563490184466 | 0.531952776067864 | 66 |
IV. Investment Strategy Comparison: BTS vs XLM
Long-term vs Short-term Investment Strategy
- BTS: Suitable for investors focused on decentralized exchange ecosystems and potential for financial smart contracts
- XLM: Suitable for investors interested in cross-border payment solutions and institutional adoption
Risk Management and Asset Allocation
- Conservative investors: BTS: 20% vs XLM: 80%
- Aggressive investors: BTS: 40% vs XLM: 60%
- Hedging tools: Stablecoin allocation, options, cross-currency portfolios
V. Potential Risk Comparison
Market Risk
- BTS: Limited market liquidity and vulnerability to broader crypto market trends
- XLM: Exposure to fluctuations in global remittance markets and competition from traditional financial institutions
Technical Risk
- BTS: Scalability, network stability
- XLM: Network congestion during high-volume periods, potential smart contract vulnerabilities
Regulatory Risk
- Global regulatory policies may have differing impacts on both assets, with XLM potentially facing more scrutiny due to its focus on integration with traditional finance
VI. Conclusion: Which Is the Better Buy?
📌 Investment Value Summary:
- BTS advantages: Established decentralized exchange functionality, fixed supply model
- XLM advantages: Strong institutional partnerships, growing ecosystem, focus on cross-border payments
✅ Investment Advice:
- New investors: Consider a higher allocation to XLM due to its broader adoption and clearer use case
- Experienced investors: Balanced portfolio with both assets, leveraging BTS for DEX exposure and XLM for payment solutions
- Institutional investors: Focus on XLM for its regulatory compliance and partnerships with established financial entities
⚠️ Risk Warning: Cryptocurrency markets are highly volatile, and this article does not constitute investment advice. None
VII. FAQ
Q1: What are the key differences between BitShares (BTS) and Stellar (XLM)? A: BitShares focuses on high-performance financial smart contracts and decentralized exchange functionality, while Stellar is designed for fast, low-cost cross-border payments and asset transfers. XLM has gained more institutional adoption and has a more diverse ecosystem.
Q2: Which cryptocurrency has shown better historical price performance? A: Historically, Stellar (XLM) has shown a wider price range. Its all-time high was $0.875563 on January 3, 2018, compared to BitShares' all-time high of $0.923921 on the same date. XLM's current price is also higher at $0.35186 versus BTS at $0.001169 as of 2025-10-14.
Q3: How do the supply mechanisms of BTS and XLM differ? A: BTS has a fixed supply model with 2.6 billion BTS in circulation, designed to avoid inflation. XLM initially had a disinflationary model but shifted to no new XLM creation after a 2019 vote, moving from a 1% annual inflation rate to a non-inflationary model.
Q4: Which cryptocurrency is considered more suitable for long-term investment? A: XLM is generally considered more suitable for long-term investment due to its stronger institutional adoption, growing ecosystem, and focus on cross-border payments. However, BTS may be attractive for investors interested in decentralized exchange ecosystems.
Q5: What are the potential risks associated with investing in BTS and XLM? A: Both face market risks related to crypto volatility. BTS has limited market liquidity, while XLM is exposed to fluctuations in global remittance markets. Technical risks include scalability for BTS and potential network congestion for XLM. Regulatory risks may impact both, with XLM potentially facing more scrutiny due to its integration with traditional finance.
Q6: How do the 2030 price predictions compare for BTS and XLM? A: For 2030, BTS is predicted to reach $0.001695116201751 - $0.002017188280083 in the base scenario, while XLM is expected to reach $0.584563490184466 - $0.672248013712136. XLM shows a higher potential price range and percentage increase from current levels.
Share
Content