BSCS vs DOT: Comparing Two Blockchain Platforms for Enterprise Solutions
Introduction: Investment Comparison of BSCS vs DOT
In the cryptocurrency market, the comparison between BSCS vs DOT has always been an unavoidable topic for investors. The two not only show significant differences in market cap ranking, application scenarios, and price performance, but also represent different positioning in the crypto asset space.
BSCS (BSCS): Since its launch, it has gained market recognition for its positioning as a fully decentralized protocol for launching new ideas.
Polkadot (DOT): Since its introduction in 2020, it has been hailed as a next-generation blockchain protocol that enables interoperability between different networks.
This article will comprehensively analyze the investment value comparison between BSCS vs DOT, focusing on historical price trends, supply mechanisms, institutional adoption, technical ecosystems, and future predictions, attempting to answer the question most concerning to investors:
"Which is the better buy right now?" Here is the requested report in English using the provided template:
I. Price History Comparison and Current Market Status
BSCS and DOT Historical Price Trends
- 2021: BSCS reached its all-time high of $1.17 due to the initial hype around the project launch.
- 2021: DOT hit its record high of $54.98 in November, driven by the parachain auctions on Polkadot.
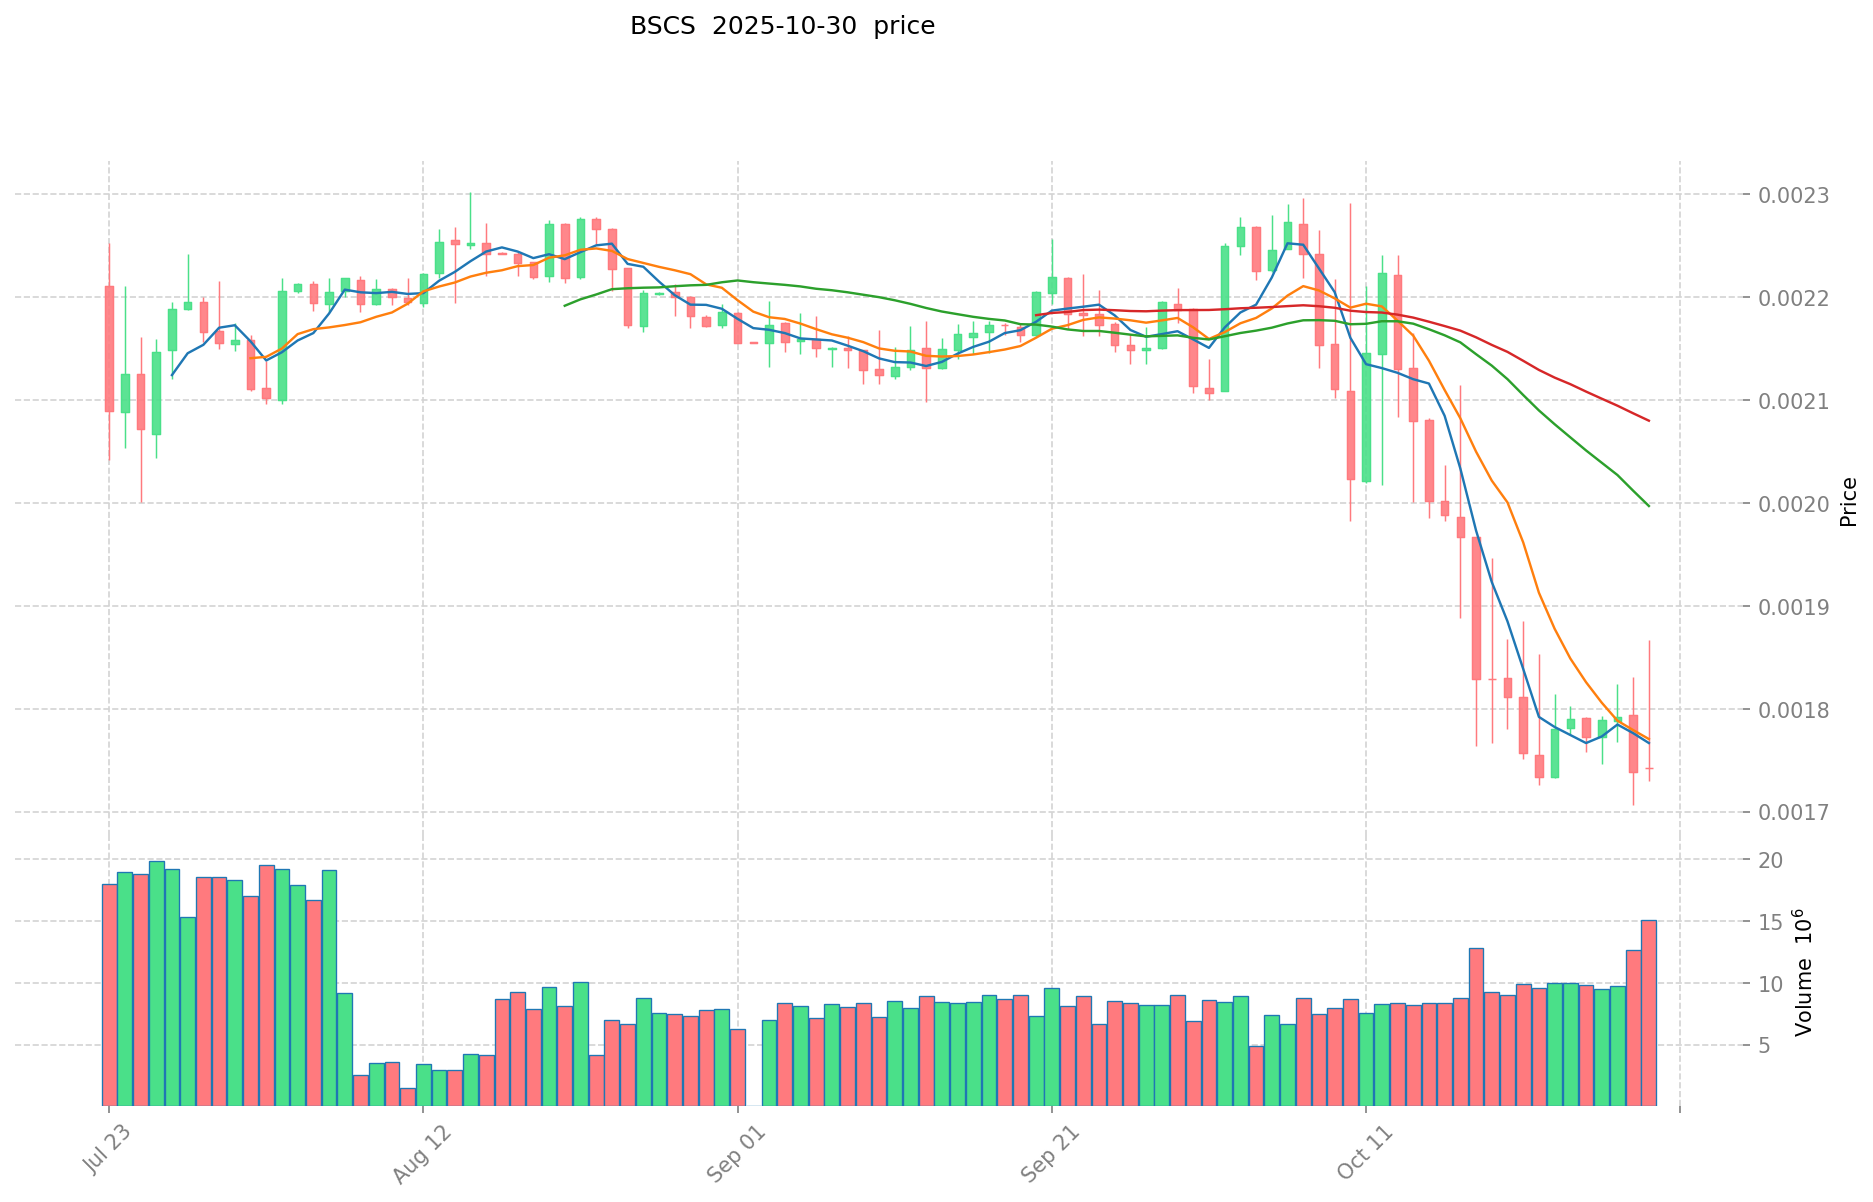
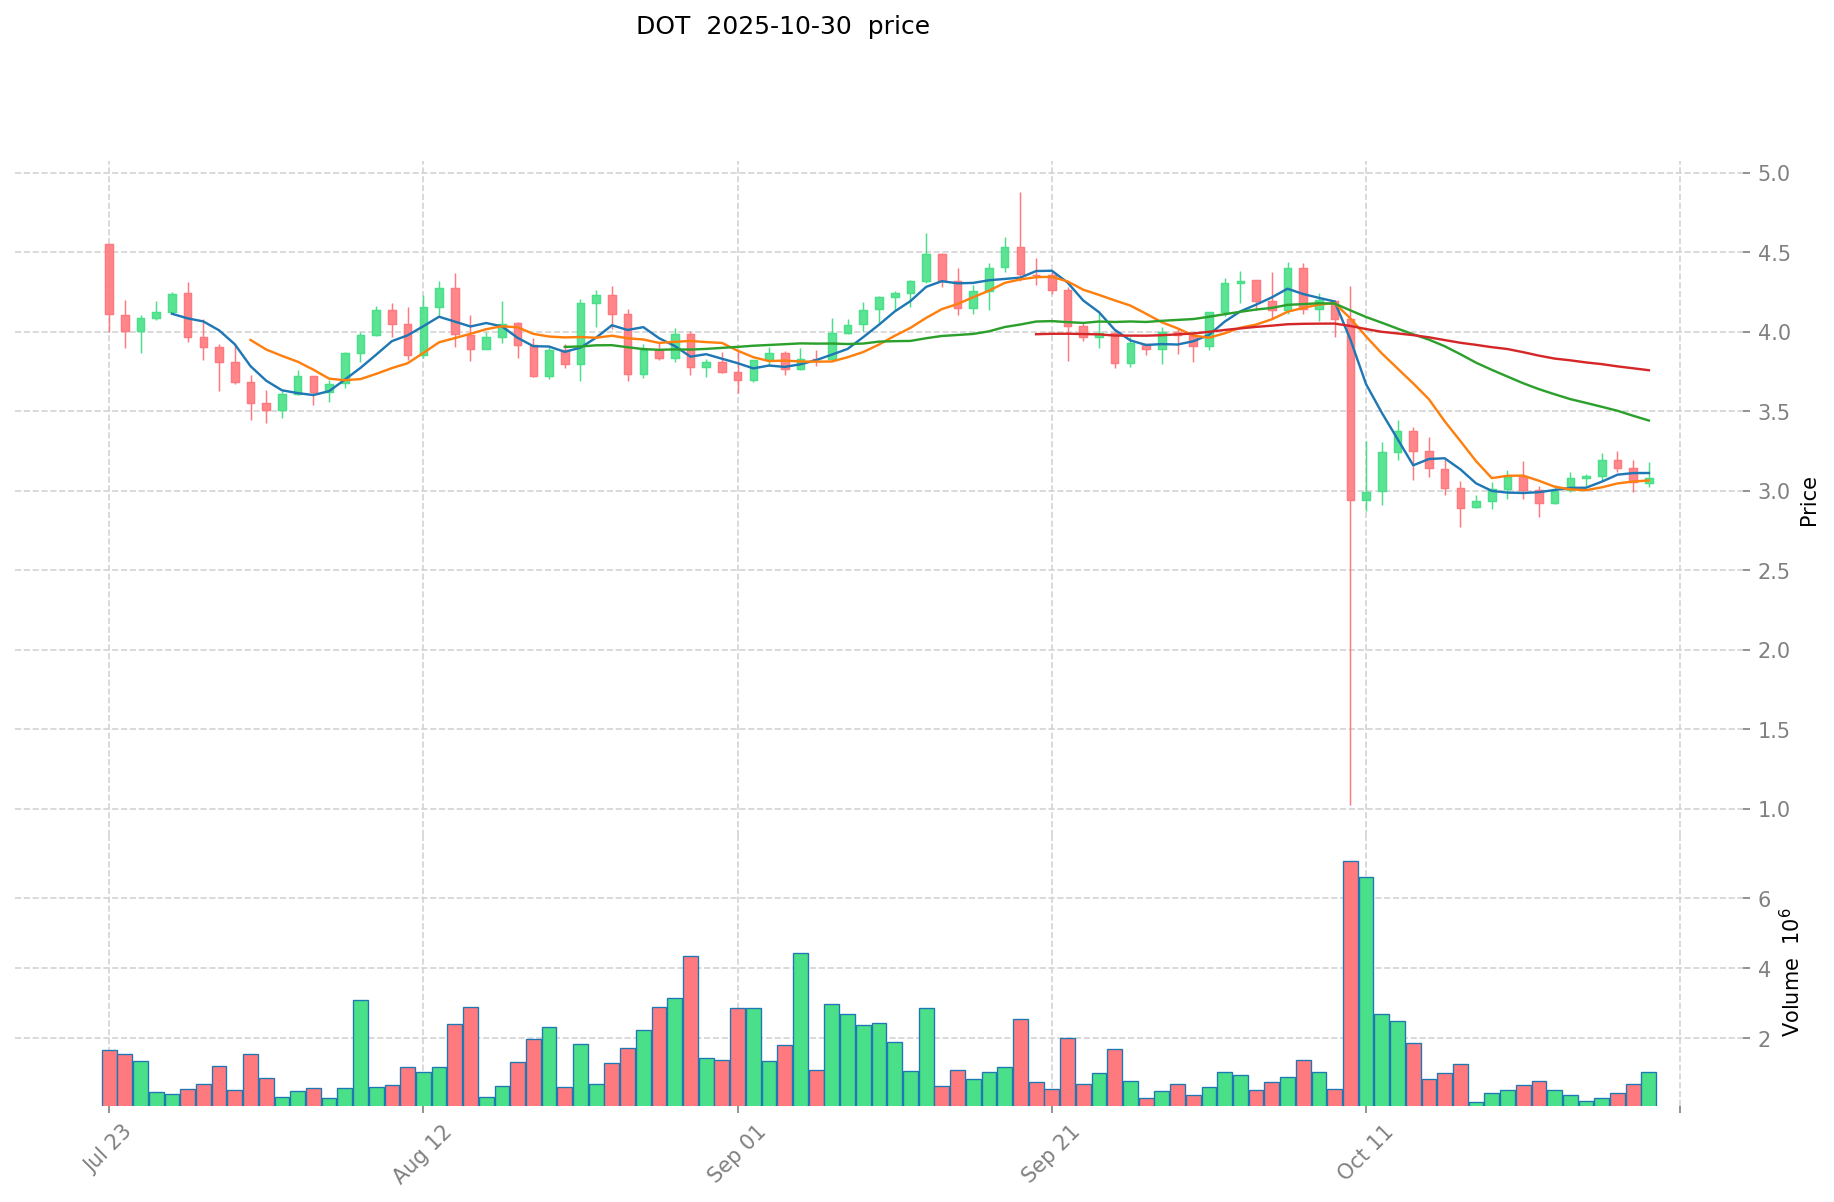
- Comparative analysis: During the 2022 bear market, BSCS dropped from its peak to a low of $0.00170639, while DOT declined from its all-time high to around $4.
Current Market Situation (2025-10-31)
- BSCS current price: $0.001727
- DOT current price: $2.871
- 24-hour trading volume: $18,308.59 (BSCS) vs $4,691,809.91 (DOT)
- Market sentiment index (Fear & Greed Index): 34 (Fear)
Click to view real-time prices:
- Check BSCS current price Market Price
- Check DOT current price Market Price
II. Core Factors Affecting BSCS vs DOT Investment Value
Supply Mechanism Comparison (Tokenomics)
- BSCS: First issued on April 23, 2021 with an opening price of $0.1689; investment return rate calculated based on crowdfunding price when available
- DOT: Features a staking mechanism that allows users to receive vDOT tokens when staking DOT, enabling both staking rewards and liquidity
- 📌 Historical pattern: The value proposition differs significantly - BSCS relies more on market performance and crowdfunding returns while DOT derives value from its staking mechanism.
Institutional Adoption and Market Applications
- Institutional holdings: Limited information in the provided materials
- Enterprise adoption: ChainSwap supports projects bridging between ETH, BSC, and HECO networks, with future plans to integrate DOT alongside BTC and SOL
- Regulatory attitudes: No specific information provided in the materials
Technical Development and Ecosystem Building
- BSCS technical upgrades: No specific information provided
- DOT technical development: The Bifrost platform enables DOT staking while maintaining liquidity through vDOT tokens
- Ecosystem comparison: DOT appears to be part of a cross-chain ecosystem that includes BTC and SOL, with ChainSwap working on providing seamless bridging between these networks
Macroeconomic and Market Cycles
- Inflation performance: No specific information provided
- Monetary policy effects: No specific information provided
- Geopolitical factors: No specific information provided
III. 2025-2030 Price Prediction: BSCS vs DOT
Short-term Prediction (2025)
- BSCS: Conservative $0.0015489 - $0.001721 | Optimistic $0.001721 - $0.00228893
- DOT: Conservative $2.13825 - $2.851 | Optimistic $2.851 - $3.87736
Mid-term Prediction (2027)
- BSCS may enter a growth phase, with estimated price range $0.00125109816 - $0.00339240078
- DOT may enter a bullish market, with estimated price range $2.78554104 - $5.28849096
- Key drivers: Institutional capital inflow, ETF, ecosystem development
Long-term Prediction (2030)
- BSCS: Base scenario $0.002541964249409 - $0.003389285665879 | Optimistic scenario $0.003389285665879 - $0.004304392795666
- DOT: Base scenario $6.22296674744976 - $6.620177390904 | Optimistic scenario $6.620177390904 - $9.73166076462888
Disclaimer: This analysis is for informational purposes only and should not be considered as financial advice. Cryptocurrency markets are highly volatile and unpredictable. Always conduct your own research before making any investment decisions.
BSCS:
| 年份 | 预测最高价 | 预测平均价格 | 预测最低价 | 涨跌幅 |
|---|---|---|---|---|
| 2025 | 0.00228893 | 0.001721 | 0.0015489 | 0 |
| 2026 | 0.002806951 | 0.002004965 | 0.00166412095 | 16 |
| 2027 | 0.00339240078 | 0.002405958 | 0.00125109816 | 39 |
| 2028 | 0.0030731301534 | 0.00289917939 | 0.0015365650767 | 67 |
| 2029 | 0.003792416560059 | 0.0029861547717 | 0.002000723697039 | 72 |
| 2030 | 0.004304392795666 | 0.003389285665879 | 0.002541964249409 | 96 |
DOT:
| 年份 | 预测最高价 | 预测平均价格 | 预测最低价 | 涨跌幅 |
|---|---|---|---|---|
| 2025 | 3.87736 | 2.851 | 2.13825 | 0 |
| 2026 | 4.709852 | 3.36418 | 2.3885678 | 17 |
| 2027 | 5.28849096 | 4.037016 | 2.78554104 | 40 |
| 2028 | 6.0149519892 | 4.66275348 | 4.4762433408 | 62 |
| 2029 | 7.901502047208 | 5.3388527346 | 4.591413351756 | 85 |
| 2030 | 9.73166076462888 | 6.620177390904 | 6.22296674744976 | 130 |
IV. Investment Strategy Comparison: BSCS vs DOT
Long-term vs Short-term Investment Strategies
- BSCS: Suitable for investors focused on decentralized protocols and new project launches
- DOT: Suitable for investors interested in interoperability and cross-chain ecosystems
Risk Management and Asset Allocation
- Conservative investors: BSCS: 20% vs DOT: 80%
- Aggressive investors: BSCS: 40% vs DOT: 60%
- Hedging tools: Stablecoin allocation, options, cross-currency portfolios
V. Potential Risk Comparison
Market Risks
- BSCS: High volatility due to lower market cap and trading volume
- DOT: Susceptible to broader crypto market trends and parachain auction dynamics
Technical Risks
- BSCS: Scalability, network stability
- DOT: Parachain integration challenges, potential security vulnerabilities in cross-chain operations
Regulatory Risks
- Global regulatory policies may have different impacts on both tokens, with DOT potentially facing more scrutiny due to its larger market presence
VI. Conclusion: Which Is the Better Buy?
📌 Investment Value Summary:
- BSCS advantages: Potential for high growth as a decentralized protocol for new projects
- DOT advantages: Established ecosystem, interoperability focus, and staking mechanism
✅ Investment Advice:
- New investors: Consider allocating a smaller portion to BSCS and a larger portion to DOT for better stability
- Experienced investors: Balanced approach with higher risk tolerance for BSCS
- Institutional investors: Focus on DOT for its more established ecosystem and potential for institutional adoption
⚠️ Risk Warning: The cryptocurrency market is highly volatile, and this article does not constitute investment advice. None
VII. FAQ
Q1: What are the main differences between BSCS and DOT? A: BSCS is positioned as a fully decentralized protocol for launching new ideas, while DOT is a next-generation blockchain protocol enabling interoperability between different networks. DOT has a larger market cap, higher trading volume, and a more established ecosystem.
Q2: How do the supply mechanisms of BSCS and DOT differ? A: BSCS relies more on market performance and crowdfunding returns, while DOT features a staking mechanism that allows users to receive vDOT tokens when staking DOT, enabling both staking rewards and liquidity.
Q3: Which token has performed better historically? A: Based on the information provided, DOT has shown better historical performance, reaching an all-time high of $54.98 in November 2021, compared to BSCS's all-time high of $1.17. However, both tokens experienced significant declines during the 2022 bear market.
Q4: What are the price predictions for BSCS and DOT by 2030? A: For BSCS, the base scenario predicts a range of $0.002541964249409 - $0.003389285665879, with an optimistic scenario of $0.003389285665879 - $0.004304392795666. For DOT, the base scenario predicts $6.22296674744976 - $6.620177390904, with an optimistic scenario of $6.620177390904 - $9.73166076462888.
Q5: How should investors allocate their portfolio between BSCS and DOT? A: For conservative investors, a suggested allocation is 20% BSCS and 80% DOT. For aggressive investors, the suggestion is 40% BSCS and 60% DOT. However, these are general guidelines, and individual investors should consider their own risk tolerance and investment goals.
Q6: What are the main risks associated with investing in BSCS and DOT? A: Both tokens face market risks due to the volatile nature of cryptocurrencies. BSCS has higher volatility due to its lower market cap and trading volume. DOT faces potential challenges with parachain integration and cross-chain security. Both tokens may be subject to regulatory risks, with DOT potentially facing more scrutiny due to its larger market presence.
Share
Content
Introduction: Investment Comparison of BSCS vs DOT
I. Price History Comparison and Current Market Status
II. Core Factors Affecting BSCS vs DOT Investment Value
III. 2025-2030 Price Prediction: BSCS vs DOT
IV. Investment Strategy Comparison: BSCS vs DOT
V. Potential Risk Comparison
VI. Conclusion: Which Is the Better Buy?
VII. FAQ

