ATH vs GRT: The Battle for Blockchain Supremacy in Decentralized Data Management
Introduction: ATH vs GRT Investment Comparison
In the cryptocurrency market, Aethir (ATH) vs The Graph (GRT) comparison has been an unavoidable topic for investors. The two not only show significant differences in market cap ranking, application scenarios, and price performance, but also represent different positioning in the crypto asset space.
Aethir (ATH): Since its launch, it has gained market recognition for its role in revolutionizing enterprise-grade GPU utilization and distribution for cloud computing infrastructure.
The Graph (GRT): Introduced in 2020, it has been hailed as the "Google of blockchains," serving as a decentralized protocol for indexing and querying blockchain data.
This article will provide a comprehensive analysis of the investment value comparison between ATH and GRT, focusing on historical price trends, supply mechanisms, institutional adoption, technological ecosystems, and future projections, attempting to answer the question most crucial to investors:
"Which is the better buy right now?"
I. Price History Comparison and Current Market Status
ATH and GRT Historical Price Trends
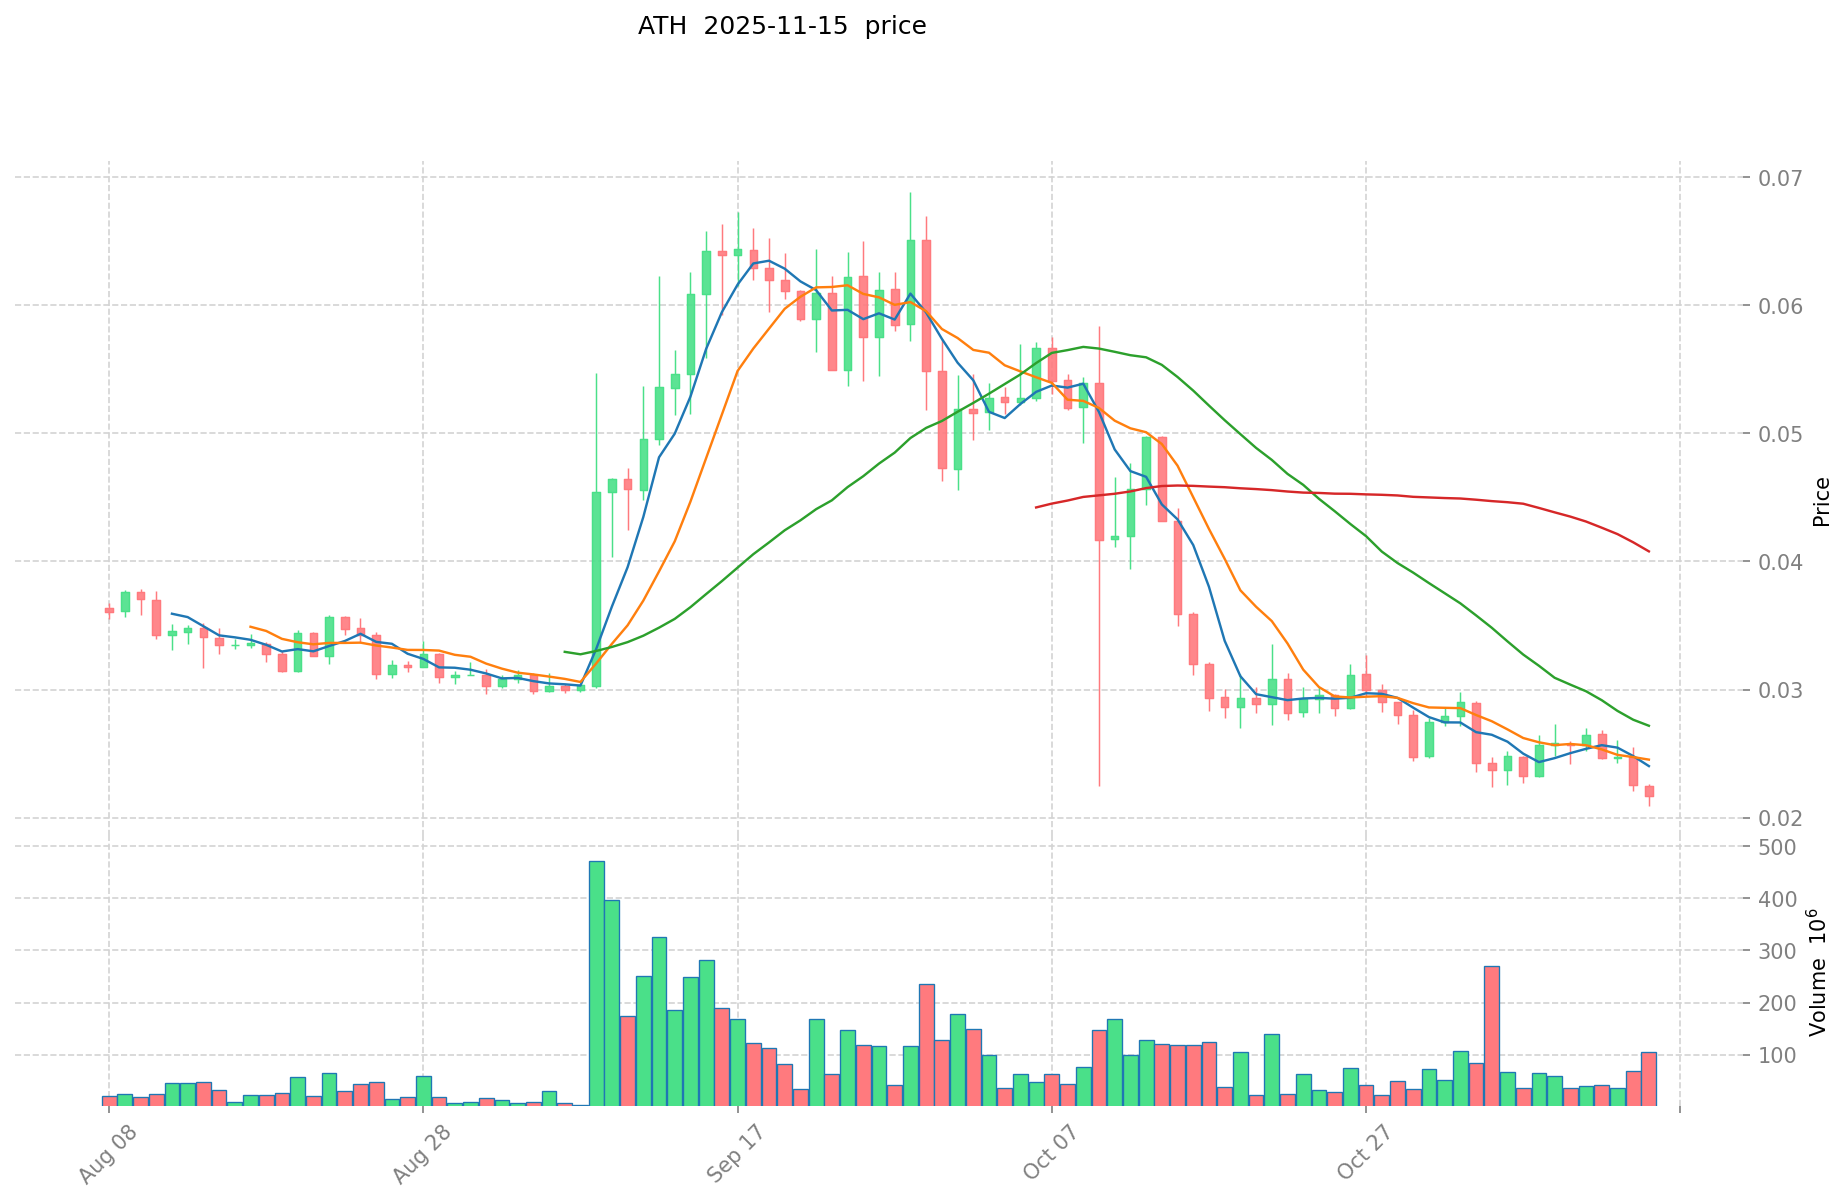
- 2024: ATH reached its all-time high of $0.14724 on June 12, 2024.
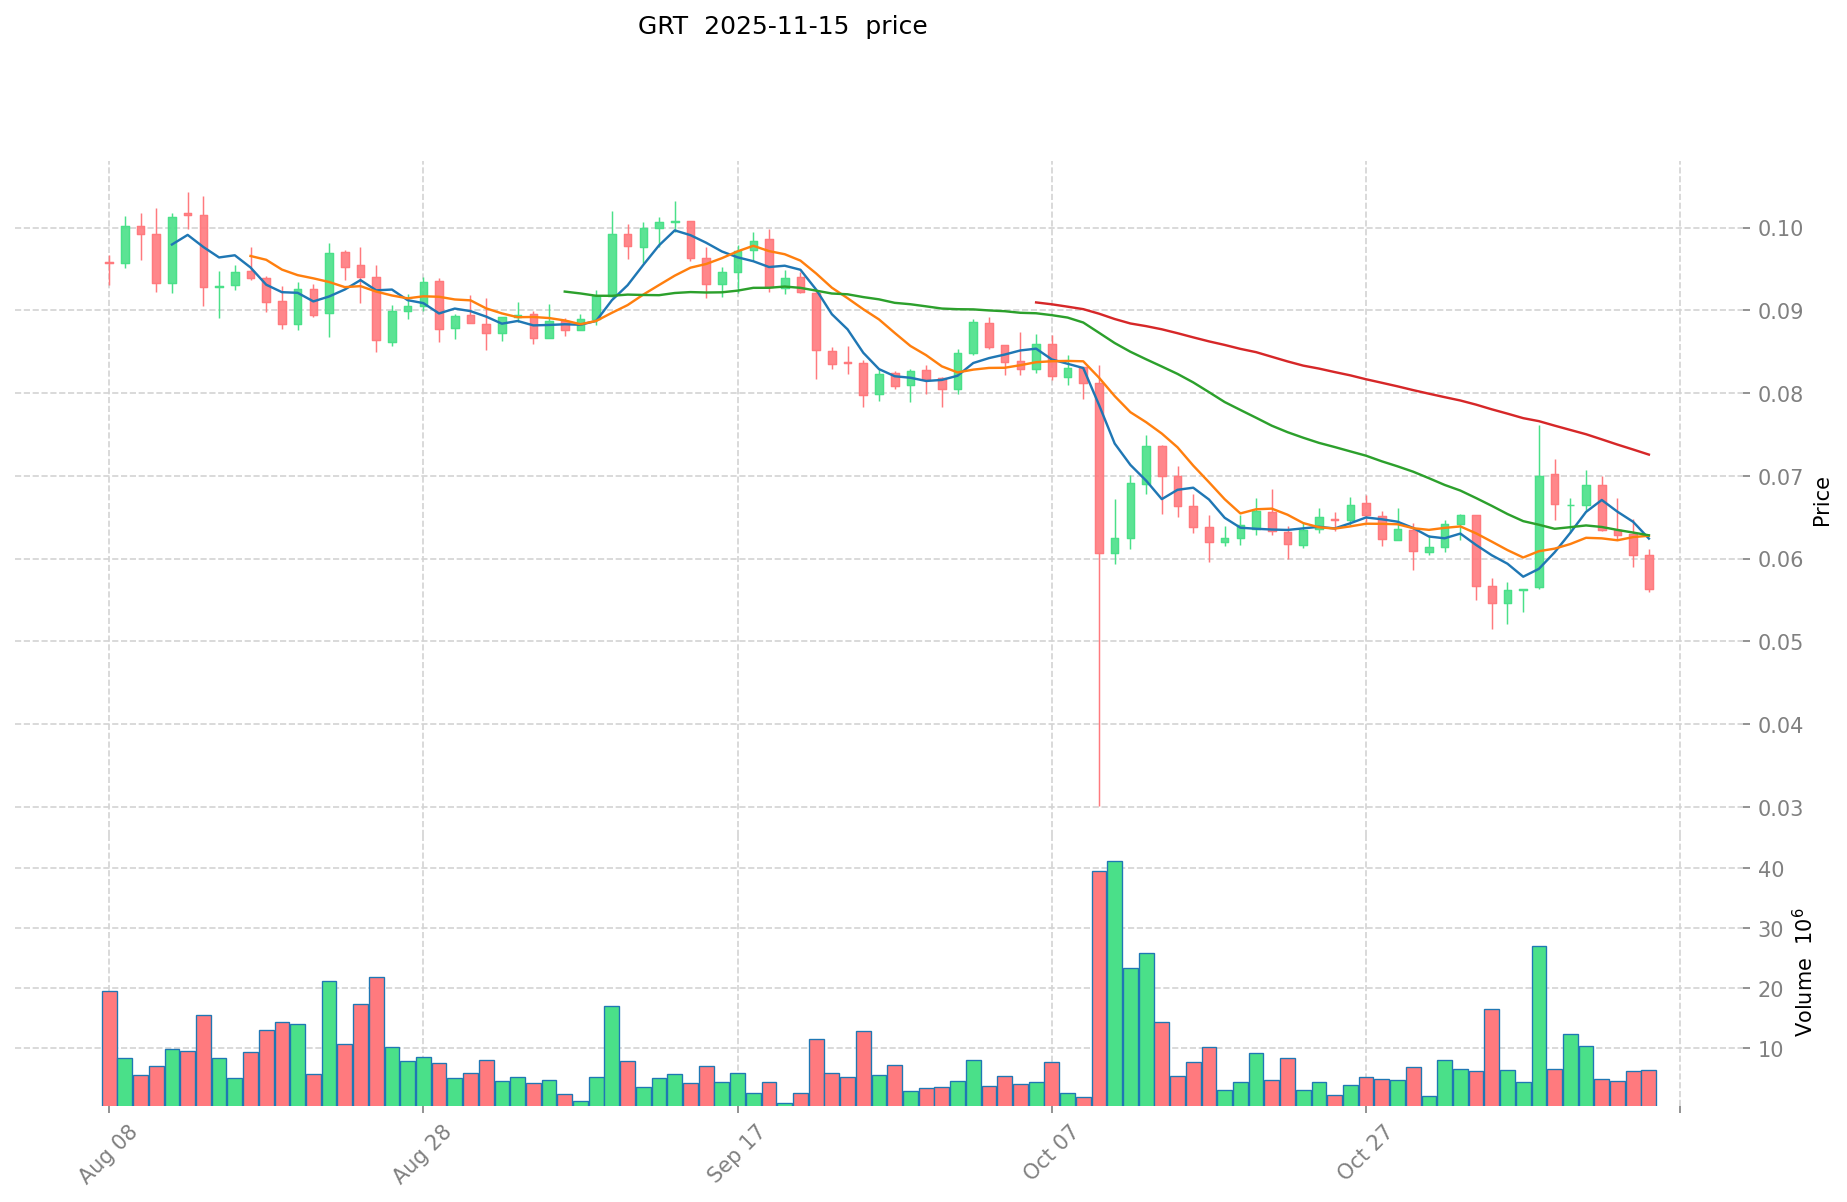
- 2021: GRT hit its all-time high of $2.84 on February 12, 2021.
- Comparative analysis: In the current market cycle, ATH has dropped from its peak of $0.14724 to a low of $0.02095, while GRT has fallen from its peak of $2.84 to a current price of $0.05713.
Current Market Situation (2025-11-15)
- ATH current price: $0.02233
- GRT current price: $0.05713
- 24-hour trading volume: ATH $1,710,725.95 vs GRT $371,704.87
- Market Sentiment Index (Fear & Greed Index): 10 (Extreme Fear)
Click to view real-time prices:
- View ATH current price Market Price
- View GRT current price Market Price


II. Core Factors Affecting Investment Value of ATH vs GRT
Supply Mechanism Comparison (Tokenomics)
- ATH: Fixed maximum supply of 350 million tokens, with 89% already in circulation, creating scarcity as adoption grows
- GRT: Maximum supply of 10 billion tokens with 10.6 billion currently in circulation, including an inflation rate of approximately 3% annually
- 📌 Historical Pattern: Fixed supply tokens like ATH typically demonstrate higher price volatility during bull markets, while GRT's larger supply with moderate inflation tends to create more stable but potentially lower percentage growth.
Institutional Adoption and Market Applications
- Institutional Holdings: GRT has stronger institutional backing with major investments from entities like Coinbase Ventures, Digital Currency Group, and Framework Ventures
- Enterprise Adoption: GRT has established itself as the backbone of Web3 data infrastructure, powering over 750 subgraphs and 500+ applications, while ATH's enterprise adoption remains more limited
- Regulatory Attitudes: Both tokens face similar regulatory environments as utility tokens, though GRT's established position as an indexing protocol gives it stronger regulatory positioning
Technical Development and Ecosystem Building
- ATH Technical Upgrades: Focus on enhancing decentralized exchange functionality and cross-chain interoperability
- GRT Technical Development: Continuous improvements to indexing protocol, implementation of subnets for specialized indexing, and enhanced query processing capabilities
- Ecosystem Comparison: GRT has a significantly more developed ecosystem as the dominant indexing solution for blockchain data, while ATH's ecosystem is more concentrated in specialized DeFi applications
Macroeconomic Factors and Market Cycles
- Performance During Inflation: Neither token has demonstrated significant inflation-hedge properties, though GRT's utility value provides some protection during market downturns
- Macroeconomic Monetary Policy: Both are similarly affected by interest rate changes and USD index movements, with high correlation to broader crypto market cycles
- Geopolitical Factors: GRT's infrastructure role makes it somewhat less susceptible to regional regulatory changes, while ATH may benefit from increased DeFi adoption in regions with limited traditional financial access
III. 2025-2030 Price Prediction: ATH vs GRT
Short-term Prediction (2025)
- ATH: Conservative $0.021631 - $0.0223 | Optimistic $0.0223 - $0.030997
- GRT: Conservative $0.0537586 - $0.05719 | Optimistic $0.05719 - $0.0829255
Mid-term Prediction (2027)
- ATH may enter a growth phase, with expected price range of $0.0249110178 - $0.0340887612
- GRT may enter a bullish market, with expected price range of $0.055857044075 - $0.1067119648
- Key drivers: Institutional capital inflow, ETF, ecosystem development
Long-term Prediction (2030)
- ATH: Base scenario $0.036521500398613 - $0.04246686092862 | Optimistic scenario $0.04246686092862 - $0.044165535365764
- GRT: Base scenario $0.110048354396458 - $0.11961777651789 | Optimistic scenario $0.11961777651789 - $0.136364265230394
Disclaimer: This analysis is based on historical data and market projections. Cryptocurrency markets are highly volatile and unpredictable. This information should not be considered as financial advice. Always conduct your own research before making investment decisions.
ATH:
| 年份 | 预测最高价 | 预测平均价格 | 预测最低价 | 涨跌幅 |
|---|---|---|---|---|
| 2025 | 0.030997 | 0.0223 | 0.021631 | 0 |
| 2026 | 0.03890681 | 0.0266485 | 0.02238474 | 19 |
| 2027 | 0.0340887612 | 0.032777655 | 0.0249110178 | 46 |
| 2028 | 0.044131834692 | 0.0334332081 | 0.024406241913 | 49 |
| 2029 | 0.04615120046124 | 0.038782521396 | 0.02288168762364 | 73 |
| 2030 | 0.044165535365764 | 0.04246686092862 | 0.036521500398613 | 90 |
GRT:
| 年份 | 预测最高价 | 预测平均价格 | 预测最低价 | 涨跌幅 |
|---|---|---|---|---|
| 2025 | 0.0829255 | 0.05719 | 0.0537586 | 0 |
| 2026 | 0.096679695 | 0.07005775 | 0.0469386925 | 22 |
| 2027 | 0.1067119648 | 0.0833687225 | 0.055857044075 | 45 |
| 2028 | 0.140659708602 | 0.09504034365 | 0.0826850989755 | 66 |
| 2029 | 0.12138552690978 | 0.117850026126 | 0.10488652325214 | 106 |
| 2030 | 0.136364265230394 | 0.11961777651789 | 0.110048354396458 | 109 |
IV. Investment Strategy Comparison: ATH vs GRT
Long-term vs Short-term Investment Strategies
- ATH: Suitable for investors focused on DeFi applications and potential growth in decentralized cloud computing
- GRT: Suitable for investors looking for established blockchain infrastructure projects with wide ecosystem adoption
Risk Management and Asset Allocation
- Conservative investors: ATH: 20% vs GRT: 80%
- Aggressive investors: ATH: 40% vs GRT: 60%
- Hedging tools: Stablecoin allocation, options, cross-token portfolio diversification
V. Potential Risk Comparison
Market Risks
- ATH: Higher volatility due to smaller market cap and less liquidity
- GRT: Susceptible to overall blockchain market trends and competition from other indexing solutions
Technical Risks
- ATH: Scalability challenges, network stability in early stages
- GRT: Centralization concerns in indexing nodes, potential security vulnerabilities in smart contracts
Regulatory Risks
- Global regulatory policies may impact both tokens, with GRT potentially facing less scrutiny due to its established infrastructure role
VI. Conclusion: Which Is the Better Buy?
📌 Investment Value Summary:
- ATH advantages: Fixed supply, potential for high growth in specialized DeFi and cloud computing markets
- GRT advantages: Established ecosystem, strong institutional backing, essential infrastructure for Web3
✅ Investment Advice:
- Novice investors: Consider a higher allocation to GRT due to its established position and lower volatility
- Experienced investors: Balanced portfolio with both tokens, potentially higher weight on ATH for growth potential
- Institutional investors: Focus on GRT for its infrastructure role, consider ATH as a high-potential, higher-risk allocation
⚠️ Risk Warning: Cryptocurrency markets are highly volatile. This article does not constitute investment advice. None
VII. FAQ
Q1: What are the main differences between ATH and GRT in terms of supply mechanisms? A: ATH has a fixed maximum supply of 350 million tokens with 89% already in circulation, creating scarcity. GRT has a maximum supply of 10 billion tokens with 10.6 billion currently in circulation and an annual inflation rate of about 3%.
Q2: How do ATH and GRT compare in terms of institutional adoption? A: GRT has stronger institutional backing with investments from major entities like Coinbase Ventures and Digital Currency Group. It powers over 750 subgraphs and 500+ applications. ATH's enterprise adoption is more limited in comparison.
Q3: What are the price predictions for ATH and GRT in 2030? A: For ATH, the base scenario predicts $0.036521500398613 - $0.04246686092862, with an optimistic scenario of $0.04246686092862 - $0.044165535365764. For GRT, the base scenario predicts $0.110048354396458 - $0.11961777651789, with an optimistic scenario of $0.11961777651789 - $0.136364265230394.
Q4: How do the investment strategies differ for ATH and GRT? A: ATH is suitable for investors focused on DeFi applications and potential growth in decentralized cloud computing. GRT is suitable for those looking for established blockchain infrastructure projects with wide ecosystem adoption.
Q5: What are the main risks associated with investing in ATH and GRT? A: ATH faces higher volatility due to its smaller market cap and less liquidity, as well as potential scalability challenges. GRT is susceptible to overall blockchain market trends and faces potential centralization concerns in indexing nodes.
Q6: How should different types of investors allocate their investments between ATH and GRT? A: Conservative investors might consider 20% ATH and 80% GRT, while aggressive investors might opt for 40% ATH and 60% GRT. Novice investors may want to allocate more to GRT due to its established position, while experienced investors might balance both tokens in their portfolio.
Share
Content