ASTR vs SNX: Comparing Two DeFi Protocols for Yield Optimization
Introduction: ASTR vs SNX Investment Comparison
In the cryptocurrency market, the comparison between ASTR and SNX has been an unavoidable topic for investors. The two not only show significant differences in market cap ranking, application scenarios, and price performance but also represent different positions in the crypto asset landscape.
Astar Token (ASTR): Launched in 2022, it has gained market recognition for its role in driving web3 adoption and bridging ecosystems.
Synthetix (SNX): Since its inception in 2018, it has been hailed as a platform for creating synthetic assets, becoming one of the pioneering projects in decentralized finance (DeFi).
This article will comprehensively analyze the investment value comparison between ASTR and SNX, focusing on historical price trends, supply mechanisms, institutional adoption, technological ecosystems, and future predictions, attempting to answer the question investors are most concerned about:
"Which is the better buy right now?"
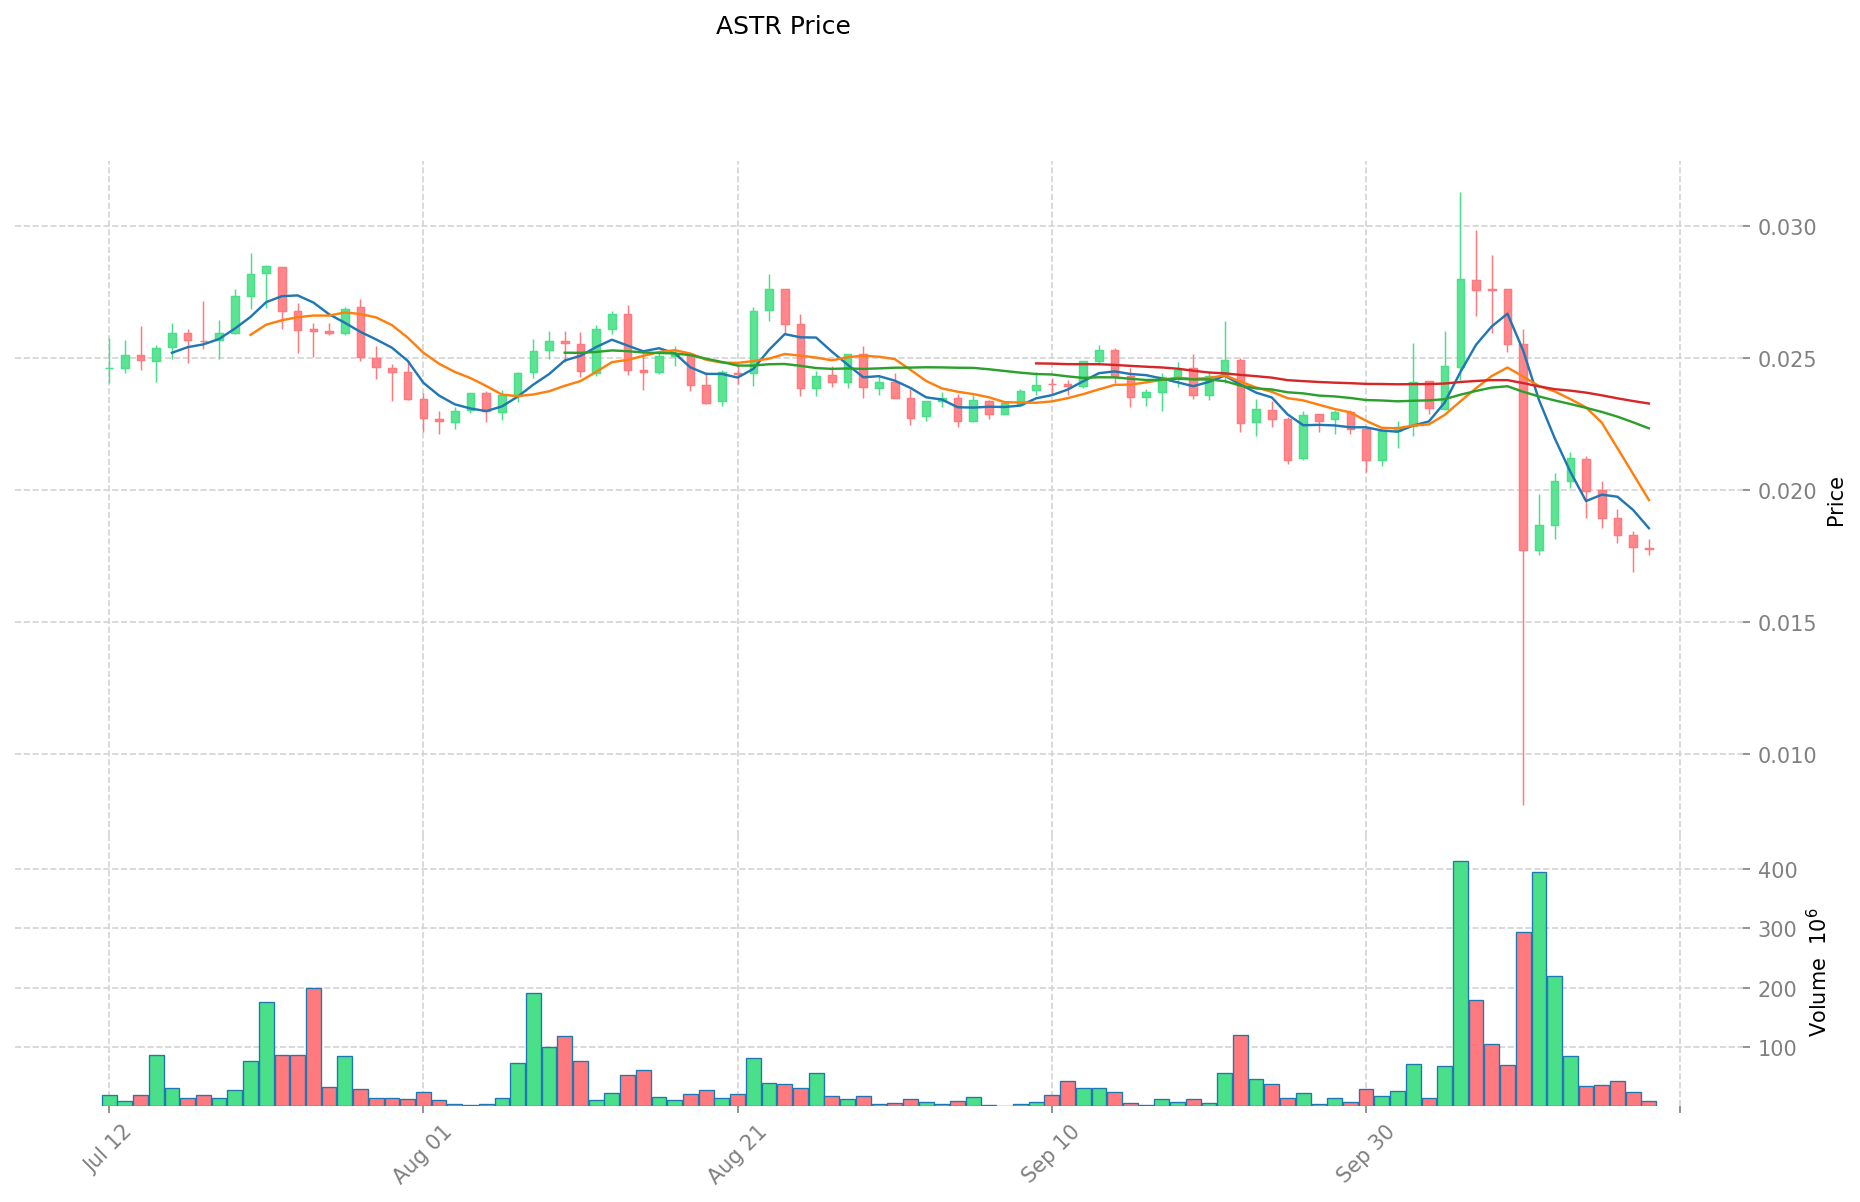
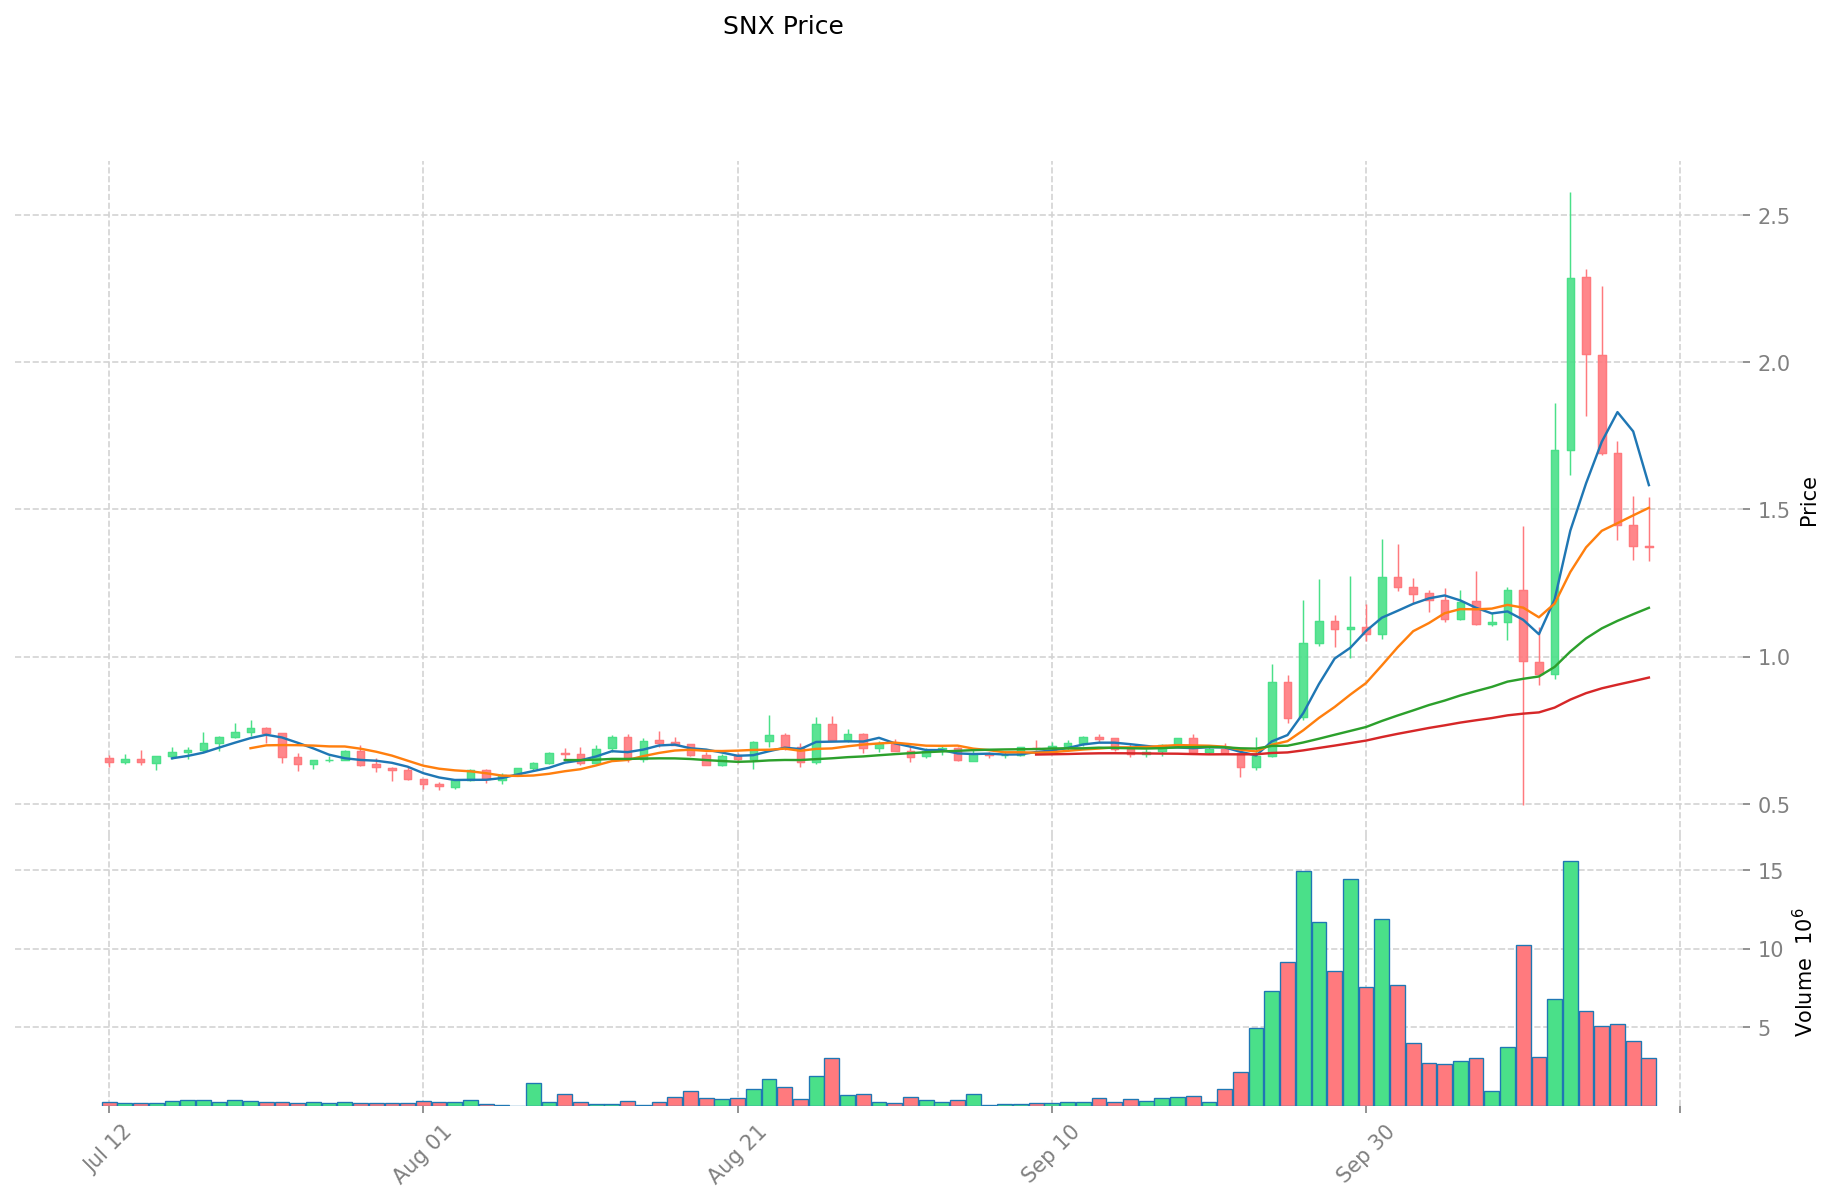
I. Price History Comparison and Current Market Status
ASTR and SNX Historical Price Trends
- 2022: ASTR reached its all-time high of $0.421574 on January 17, 2022.
- 2021: SNX hit its all-time high of $28.53 on February 14, 2021.
- Comparative analysis: ASTR has fallen from its all-time high to a current price of $0.01771, while SNX has declined from its peak to $1.3798.
Current Market Situation (2025-10-19)
- ASTR current price: $0.01771
- SNX current price: $1.3798
- 24-hour trading volume: ASTR $170,278.32 vs SNX $4,203,273.87
- Market Sentiment Index (Fear & Greed Index): 29 (Fear)
Click to view real-time prices:
- View ASTR current price Market Price
- View SNX current price Market Price
II. Core Factors Affecting Investment Value of ASTR vs SNX
Supply Mechanism Comparison (Tokenomics)
- ASTR: Fixed maximum supply of 7 billion tokens with inflationary mechanism in early years. Astar operates a dApp staking model where developers receive ASTR rewards from the token inflation.
- SNX: Initially inflationary with weekly token releases to incentivize stakers. Moving to a disinflationary model with the V3 upgrade, reducing emissions substantially.
- 📌 Historical pattern: Synthetics' controlled inflation model has historically created staking incentives while Astar's fixed maximum cap may provide long-term scarcity value.
Institutional Adoption and Market Applications
- Institutional holdings: SNX has broader institutional recognition with integration into DeFi index funds and institutional staking programs.
- Enterprise adoption: Astar has stronger enterprise partnerships through Polkadot's ecosystem and Japanese corporate connections, while Synthetix focuses on DeFi infrastructure adoption.
- Regulatory attitude: Japan has shown favorable regulatory stance toward Astar as a local project, while Synthetix faces greater regulatory uncertainty due to its derivatives focus.
Technical Development and Ecosystem Building
- ASTAR technical upgrades: Implementing zk-rollups and XVM for cross-virtual machine operability, enhancing Polkadot parachains interoperability.
- SNX technical development: V3 upgrade introduces permissionless pools, spot markets, and improved oracle infrastructure, significantly enhancing capital efficiency.
- Ecosystem comparison: Astar focuses on providing infrastructure for dApps and Web3 with strong Japan/Asia presence, while Synthetix specializes in DeFi derivatives infrastructure with deeper liquidity in trading protocols.
Macroeconomic Factors and Market Cycles
- Performance in inflationary environments: SNX potentially benefits from increased derivatives trading during market volatility, while ASTR depends more on overall blockchain adoption cycles.
- Macroeconomic monetary policy: Both tokens show sensitivity to broader crypto market cycles, with SNX more directly correlated to DeFi sentiment and trading volumes.
- Geopolitical factors: Astar's strong positioning in Asian markets provides regional diversification, while Synthetix remains more exposed to global DeFi regulatory developments.
III. 2025-2030 Price Prediction: ASTR vs SNX
Short-term Prediction (2025)
- ASTR: Conservative $0.0125 - $0.0176 | Optimistic $0.0176 - $0.0189
- SNX: Conservative $1.22 - $1.37 | Optimistic $1.37 - $2.05
Mid-term Prediction (2027)
- ASTR may enter a growth phase, with expected price range of $0.0190 - $0.0239
- SNX may enter a consolidation phase, with expected price range of $1.25 - $2.41
- Key drivers: Institutional capital inflow, ETF developments, ecosystem growth
Long-term Prediction (2030)
- ASTR: Base scenario $0.0280 - $0.0334 | Optimistic scenario $0.0334 - $0.0394
- SNX: Base scenario $1.23 - $2.36 | Optimistic scenario $2.36 - $2.76
Disclaimer: The above predictions are based on historical data and market analysis. Cryptocurrency markets are highly volatile and subject to rapid changes. These projections should not be considered as financial advice. Always conduct your own research before making investment decisions.
ASTR:
| 年份 | 预测最高价 | 预测平均价格 | 预测最低价 | 涨跌幅 |
|---|---|---|---|---|
| 2025 | 0.0188641 | 0.01763 | 0.0125173 | 0 |
| 2026 | 0.024086106 | 0.01824705 | 0.012407994 | 3 |
| 2027 | 0.02391823314 | 0.021166578 | 0.0190499202 | 19 |
| 2028 | 0.0320102159094 | 0.02254240557 | 0.0114966268407 | 27 |
| 2029 | 0.039550650572565 | 0.0272763107397 | 0.01636578644382 | 54 |
| 2030 | 0.039427907174236 | 0.033413480656132 | 0.028067323751151 | 88 |
SNX:
| 年份 | 预测最高价 | 预测平均价格 | 预测最低价 | 涨跌幅 |
|---|---|---|---|---|
| 2025 | 2.045323 | 1.3727 | 1.221703 | 0 |
| 2026 | 2.08499403 | 1.7090115 | 1.315938855 | 23 |
| 2027 | 2.40919351155 | 1.897002765 | 1.2520218249 | 37 |
| 2028 | 2.47606285901625 | 2.153098138275 | 1.377982808496 | 56 |
| 2029 | 2.40716371859145 | 2.314580498645625 | 1.458185714146743 | 67 |
| 2030 | 2.762220367083688 | 2.360872108618537 | 1.227653496481639 | 71 |
IV. Investment Strategy Comparison: ASTR vs SNX
Long-term vs Short-term Investment Strategy
- ASTR: Suitable for investors focused on Web3 adoption and ecosystem growth
- SNX: Suitable for investors interested in DeFi derivatives and synthetic assets
Risk Management and Asset Allocation
- Conservative investors: ASTR: 30% vs SNX: 70%
- Aggressive investors: ASTR: 60% vs SNX: 40%
- Hedging tools: Stablecoin allocation, options, cross-token portfolios
V. Potential Risk Comparison
Market Risks
- ASTR: Highly dependent on Polkadot ecosystem success and adoption
- SNX: Vulnerable to DeFi market fluctuations and liquidity risks
Technical Risks
- ASTR: Scalability, network stability in the Polkadot ecosystem
- SNX: Smart contract vulnerabilities, oracle reliability
Regulatory Risks
- Global regulatory policies may impact SNX more due to its focus on synthetic assets, while ASTR may benefit from favorable Japanese regulations
VI. Conclusion: Which Is the Better Buy?
📌 Investment Value Summary:
- ASTR advantages: Strong positioning in Asian markets, fixed supply cap, Web3 infrastructure focus
- SNX advantages: Established DeFi presence, V3 upgrade improving capital efficiency, potential benefits from market volatility
✅ Investment Advice:
- New investors: Consider a balanced approach with a slight bias towards SNX due to its established market position
- Experienced investors: Explore a higher allocation to ASTR for potential growth in the Web3 sector
- Institutional investors: Consider a diversified portfolio including both tokens, with emphasis on SNX for DeFi exposure and ASTR for Web3 infrastructure play
⚠️ Risk Warning: Cryptocurrency markets are highly volatile, and this article does not constitute investment advice. None
VII. FAQ
Q1: What are the main differences between ASTR and SNX? A: ASTR is focused on web3 adoption and bridging ecosystems, while SNX is a platform for creating synthetic assets in DeFi. ASTR has a fixed maximum supply of 7 billion tokens, while SNX is moving towards a disinflationary model. ASTR is more closely tied to the Polkadot ecosystem, while SNX is deeply integrated into the broader DeFi landscape.
Q2: Which token has performed better historically? A: SNX reached its all-time high of $28.53 in February 2021, while ASTR's all-time high was $0.421574 in January 2022. Both have since declined significantly, with SNX currently trading at $1.3798 and ASTR at $0.01771 as of 2025-10-19.
Q3: How do the future price predictions compare for ASTR and SNX? A: By 2030, ASTR is predicted to reach $0.0280 - $0.0394 in optimistic scenarios, while SNX is expected to be in the range of $1.23 - $2.76. These predictions suggest potentially higher percentage growth for ASTR, although SNX is predicted to maintain a higher absolute price.
Q4: What are the key factors affecting the investment value of ASTR and SNX? A: Key factors include supply mechanisms, institutional adoption, technical development, ecosystem building, and macroeconomic factors. ASTR benefits from its role in the Polkadot ecosystem and Asian market presence, while SNX leverages its established position in DeFi and potential benefits from market volatility.
Q5: How do the risks compare between ASTR and SNX? A: ASTR faces risks related to Polkadot ecosystem adoption and network stability. SNX is more exposed to DeFi market fluctuations, smart contract vulnerabilities, and potential regulatory challenges due to its focus on synthetic assets.
Q6: Which token might be more suitable for different types of investors? A: New investors might consider a balanced approach with a slight bias towards SNX due to its established market position. Experienced investors could explore a higher allocation to ASTR for potential growth in the Web3 sector. Institutional investors might benefit from a diversified portfolio including both tokens.
Q7: How do institutional adoption and regulatory attitudes differ for ASTR and SNX? A: SNX has broader institutional recognition and integration into DeFi index funds. ASTR has stronger enterprise partnerships through the Polkadot ecosystem and Japanese corporate connections. Regulatory-wise, ASTR may benefit from favorable attitudes in Japan, while SNX faces greater uncertainty due to its focus on derivatives.
Share
Content