AIA vs OP: The Battle for Supremacy in Digital Insurance Innovation
Introduction: AIA vs OP Investment Comparison
In the cryptocurrency market, DeAgentAI (AIA) vs Optimism (OP) comparison has been an unavoidable topic for investors. The two not only show significant differences in market cap ranking, application scenarios, and price performance, but also represent different cryptocurrency asset positioning.
DeAgentAI (AIA): Since its launch, it has gained market recognition for its AI Agent infrastructure across multiple ecosystems.
Optimism (OP): Introduced in 2022, it has been hailed as a low-cost, lightning-fast Ethereum Layer 2 blockchain solution.
This article will comprehensively analyze the investment value comparison between AIA and OP, focusing on historical price trends, supply mechanisms, institutional adoption, technological ecosystems, and future predictions, attempting to answer the question investors care about most:
"Which is the better buy right now?"
I. Price History Comparison and Current Market Status
DeAgentAI (AIA) and Optimism (OP) Historical Price Trends
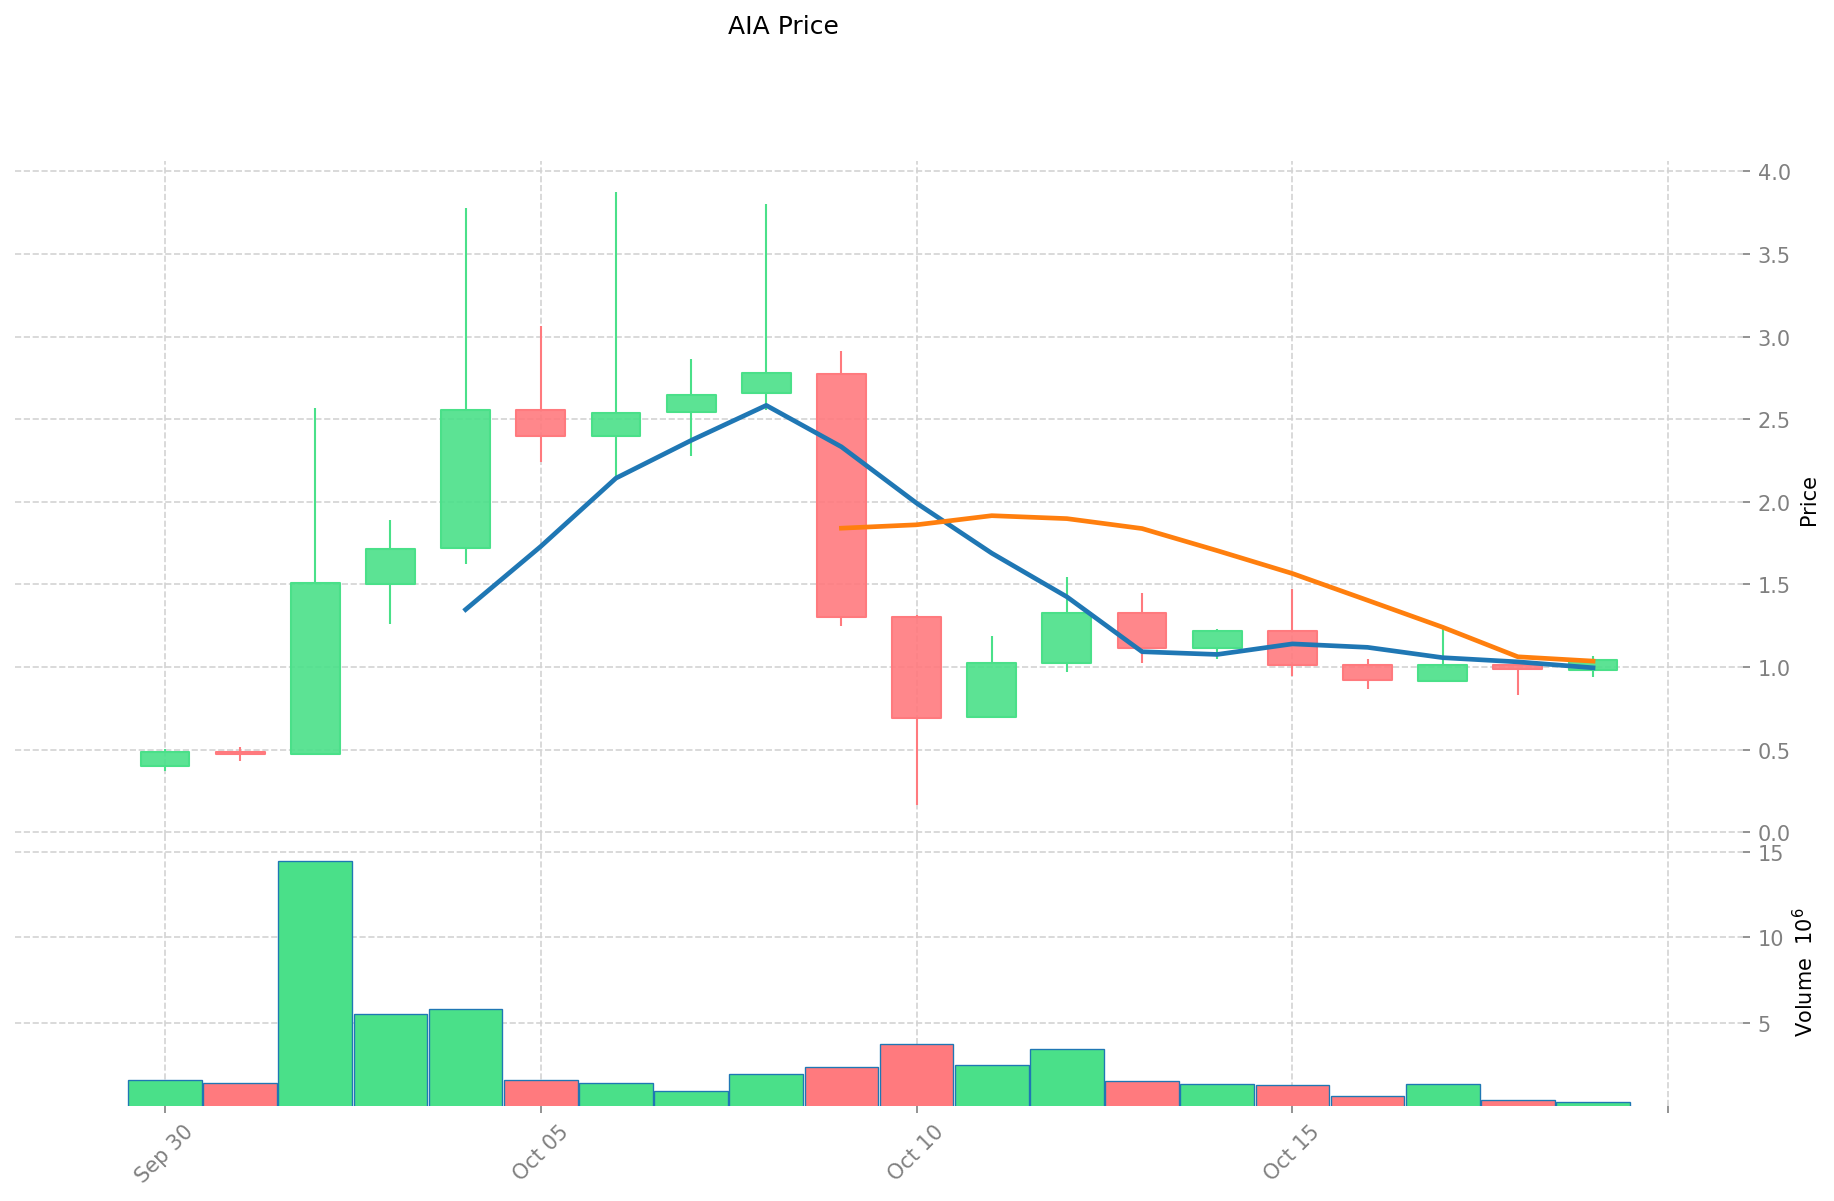
- 2025: AIA reached its all-time high of $3.87689 on October 6, but quickly dropped to its all-time low of $0.16356 on October 10, showing extreme volatility.
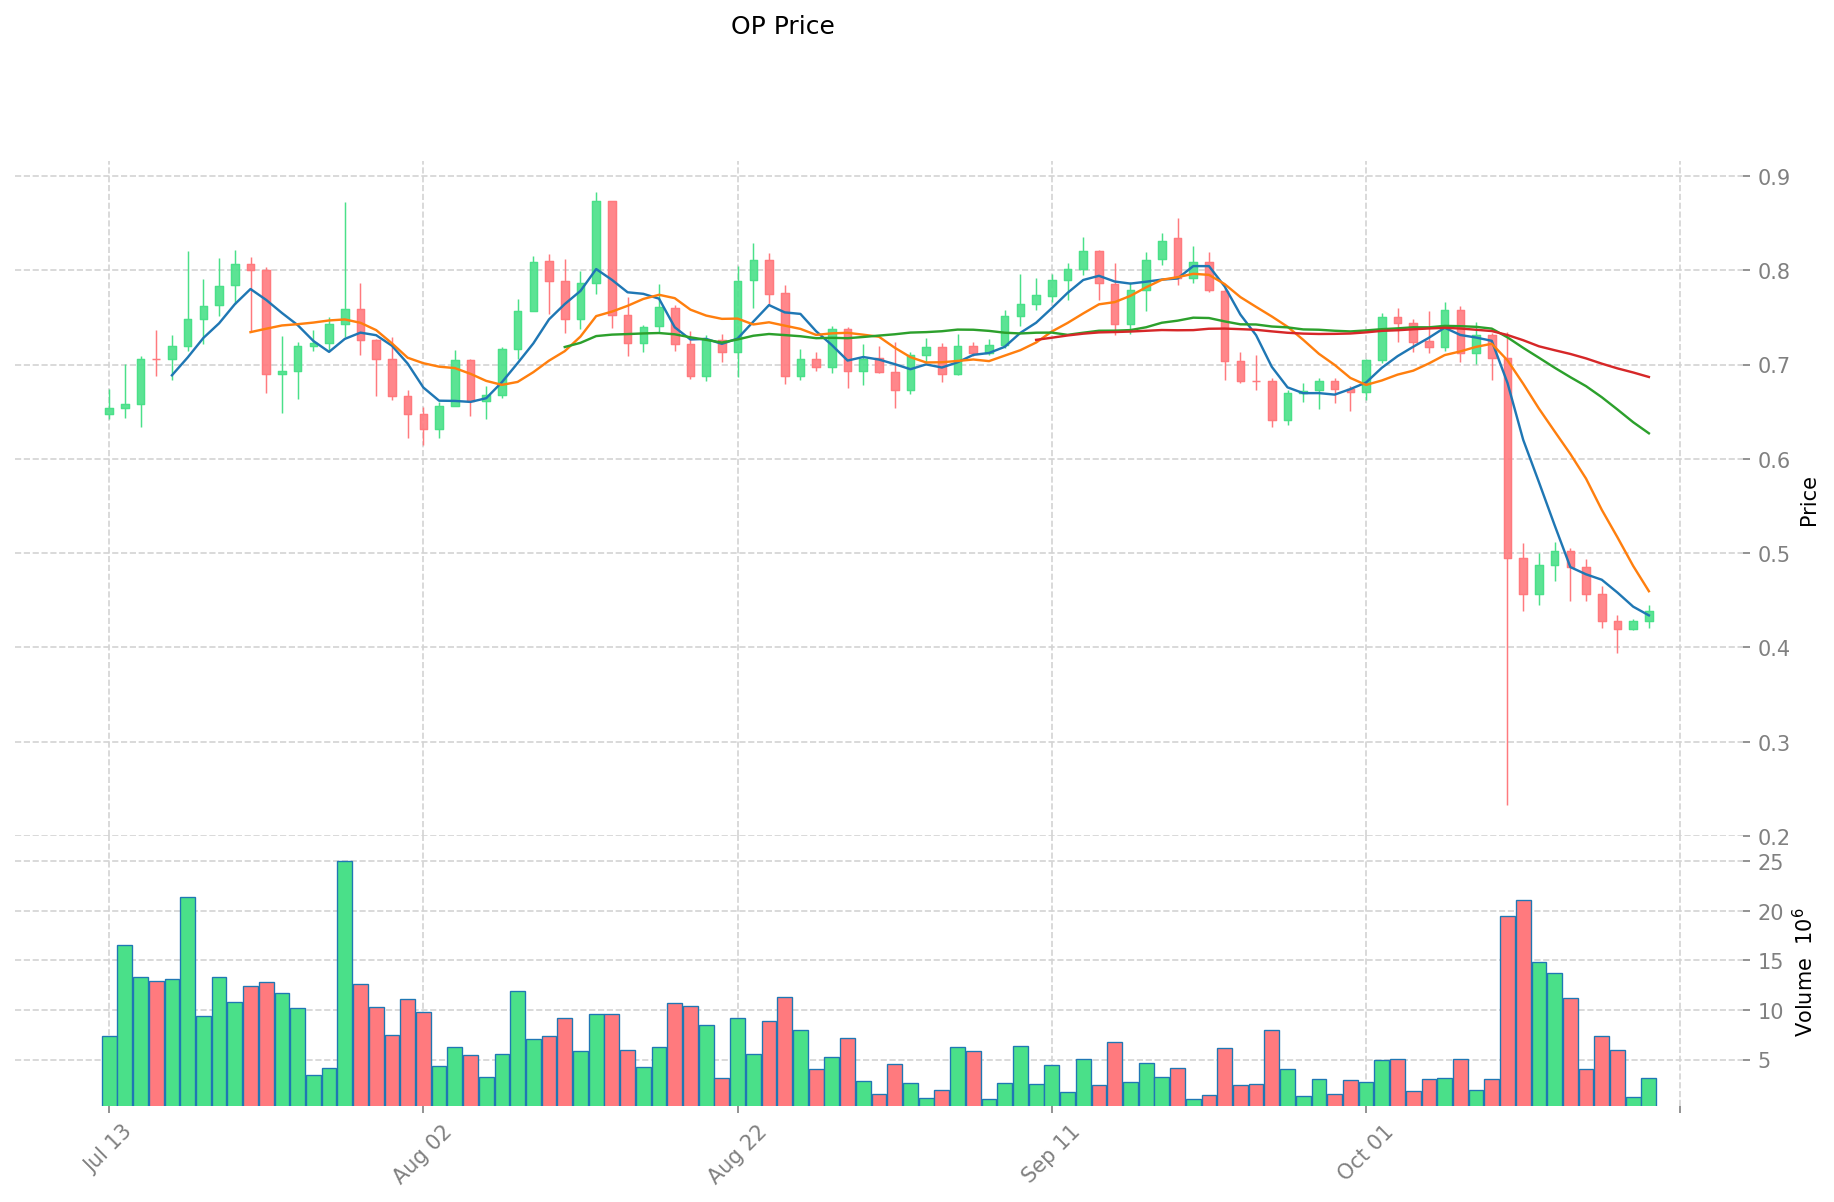
- 2024: OP hit its all-time high of $4.84 on March 6, demonstrating significant growth in the earlier part of the year.
- Comparative Analysis: In the recent market cycle, AIA experienced a dramatic swing from $3.87689 to $0.16356 within a week, while OP has seen a more gradual decline from its peak in 2024 to its current price.
Current Market Situation (2025-10-20)
- AIA current price: $1.01794
- OP current price: $0.4317
- 24-hour trading volume: AIA $379,710.96 vs OP $1,444,808.26
- Market Sentiment Index (Fear & Greed Index): 29 (Fear)
Click to view real-time prices:
- Check AIA current price Market Price
- Check OP current price Market Price
II. Core Factors Influencing AIA vs OP Investment Value
Supply Mechanisms Comparison (Tokenomics)
- AIA: Capped supply of 10 billion tokens with a deflationary model where tokens are burned through transaction fees
- OP: Uncapped supply with scheduled emissions through governance and retroactive funding programs (RetroPGF)
- 📌 Historical pattern: Deflationary tokens like AIA typically show stronger price appreciation during bull markets, while OP's gradual release may create selling pressure but ensures continuous ecosystem funding.
Institutional Adoption and Market Applications
- Institutional holdings: OP has attracted more institutional investment with backing from a16z and other major VCs, while AIA has seen growing interest from trading firms
- Enterprise adoption: OP has stronger enterprise adoption through partnerships with Coinbase (Base) and Reddit's community points system; AIA focuses on DeFi applications
- Regulatory attitudes: Both tokens face regulatory uncertainty, but OP's governance-focused structure may present fewer regulatory challenges than AIA's utility model
Technical Development and Ecosystem Building
- AIA technical upgrades: Implementing zkRollup technology to improve scalability and transaction throughput
- OP technical development: Continuous improvement of the OP Stack, optimistic rollup technology, and expansion through the Superchain vision
- Ecosystem comparison: OP has a more diverse ecosystem with strong DeFi, NFT, and gaming applications across multiple chains (Optimism, Base, etc.), while AIA focuses on specialized DeFi applications with fewer but more focused use cases
Macroeconomic Factors and Market Cycles
- Inflation performance: AIA's capped supply model positions it better as an inflation hedge compared to OP's uncapped model
- Macro monetary policy: Both tokens show high correlation with broader crypto market trends following Fed policy changes
- Geopolitical factors: AIA's focus on borderless finance offers advantages during regional restrictions, while OP's more structured governance system may provide stability during uncertain times III. 2025-2030 Price Prediction: AIA vs OP
Short-term Prediction (2025)
- AIA: Conservative $0.59-$1.03 | Optimistic $1.03-$1.08
- OP: Conservative $0.23-$0.43 | Optimistic $0.43-$0.48
Mid-term Prediction (2027)
- AIA may enter a growth phase, with estimated prices of $0.95-$1.26
- OP may enter a growth phase, with estimated prices of $0.39-$0.61
- Key drivers: Institutional capital inflow, ETFs, ecosystem development
Long-term Prediction (2030)
- AIA: Base scenario $0.94-$1.54 | Optimistic scenario $1.54-$1.93
- OP: Base scenario $0.65-$0.81 | Optimistic scenario $0.81-$1.06
Disclaimer
AIA:
| 年份 | 预测最高价 | 预测平均价格 | 预测最低价 | 涨跌幅 |
|---|---|---|---|---|
| 2025 | 1.078329 | 1.02698 | 0.5853786 | 0 |
| 2026 | 1.273711945 | 1.0526545 | 0.557906885 | 3 |
| 2027 | 1.2562378803 | 1.1631832225 | 0.95381024245 | 14 |
| 2028 | 1.342778712054 | 1.2097105514 | 1.112933707288 | 18 |
| 2029 | 1.81226737705234 | 1.276244631727 | 1.23795729277519 | 25 |
| 2030 | 1.930320005487087 | 1.54425600438967 | 0.941996162677698 | 51 |
OP:
| 年份 | 预测最高价 | 预测平均价格 | 预测最低价 | 涨跌幅 |
|---|---|---|---|---|
| 2025 | 0.483504 | 0.4317 | 0.228801 | 0 |
| 2026 | 0.58573056 | 0.457602 | 0.2745612 | 6 |
| 2027 | 0.6103495476 | 0.52166628 | 0.39124971 | 20 |
| 2028 | 0.786751000182 | 0.5660079138 | 0.36790514397 | 31 |
| 2029 | 0.9469312397874 | 0.676379456991 | 0.41259146876451 | 56 |
| 2030 | 1.063268506389852 | 0.8116553483892 | 0.64932427871136 | 88 |
IV. Investment Strategy Comparison: AIA vs OP
Long-term vs Short-term Investment Strategies
- AIA: Suitable for investors focused on AI infrastructure potential and deflationary tokenomics
- OP: Suitable for investors interested in Ethereum scaling solutions and layer 2 ecosystem growth
Risk Management and Asset Allocation
- Conservative investors: AIA: 30% vs OP: 70%
- Aggressive investors: AIA: 60% vs OP: 40%
- Hedging tools: Stablecoin allocation, options, cross-token portfolio diversification
V. Potential Risk Comparison
Market Risks
- AIA: High volatility, potential for rapid price swings
- OP: Competitive landscape in Layer 2 solutions, market saturation risk
Technical Risks
- AIA: Scalability challenges, network stability during high demand
- OP: Dependency on Ethereum's development, potential vulnerabilities in optimistic rollup technology
Regulatory Risks
- Global regulatory policies may impact both tokens differently, with OP's governance structure potentially offering more regulatory clarity
VI. Conclusion: Which Is the Better Buy?
📌 Investment Value Summary:
- AIA advantages: Deflationary model, AI-focused infrastructure, potential for high growth in bull markets
- OP advantages: Strong institutional backing, established ecosystem, continuous technical improvements
✅ Investment Advice:
- New investors: Consider a balanced approach with a slight bias towards OP for its more established ecosystem
- Experienced investors: Explore a higher allocation to AIA for potential higher returns, balanced with OP for stability
- Institutional investors: Consider OP for its governance structure and institutional adoption, while keeping an eye on AIA's growth potential
⚠️ Risk Warning: The cryptocurrency market is highly volatile. This article does not constitute investment advice. None
VII. FAQ
Q1: What are the key differences between AIA and OP in terms of supply mechanisms? A: AIA has a capped supply of 10 billion tokens with a deflationary model, while OP has an uncapped supply with scheduled emissions through governance and retroactive funding programs.
Q2: How do the institutional adoptions of AIA and OP compare? A: OP has attracted more institutional investment with backing from major VCs like a16z, while AIA has seen growing interest from trading firms. OP also has stronger enterprise adoption through partnerships with Coinbase and Reddit.
Q3: What are the main technical developments for AIA and OP? A: AIA is implementing zkRollup technology to improve scalability, while OP is continuously improving its OP Stack, optimistic rollup technology, and expanding through the Superchain vision.
Q4: How do the ecosystems of AIA and OP differ? A: OP has a more diverse ecosystem with strong DeFi, NFT, and gaming applications across multiple chains, while AIA focuses on specialized DeFi applications with fewer but more focused use cases.
Q5: What are the long-term price predictions for AIA and OP by 2030? A: For AIA, the base scenario predicts $0.94-$1.54, with an optimistic scenario of $1.54-$1.93. For OP, the base scenario predicts $0.65-$0.81, with an optimistic scenario of $0.81-$1.06.
Q6: How should investors allocate their portfolio between AIA and OP? A: Conservative investors might consider 30% AIA and 70% OP, while aggressive investors might opt for 60% AIA and 40% OP. However, individual risk tolerance and investment goals should guide allocation decisions.
Q7: What are the main risks associated with investing in AIA and OP? A: AIA faces high volatility and potential rapid price swings, while OP faces competition in the Layer 2 solutions market. Both tokens are subject to technical risks and regulatory uncertainties in the crypto space.