ADX vs APT: Comparing Technical Indicators for Effective Trading Strategies
Introduction: ADX vs APT Investment Comparison
In the cryptocurrency market, AdEx vs Aptos comparison has always been a topic that investors can't ignore. The two not only have significant differences in market cap ranking, application scenarios, and price performance, but also represent different cryptocurrency asset positions.
AdEx (ADX): Since its launch in 2017, it has gained market recognition for its innovative web3 marketing platform.
Aptos (APT): Since its inception in 2022, it has been hailed as a high-performance PoS Layer 1 blockchain, and is one of the cryptocurrencies with high global trading volume and market capitalization.
This article will comprehensively analyze the investment value comparison between AdEx and Aptos, focusing on historical price trends, supply mechanisms, institutional adoption, technological ecosystems, and future predictions, and attempt to answer the question that investors are most concerned about:
"Which is the better buy right now?"
I. Price History Comparison and Current Market Status
ADX and APT Historical Price Trends
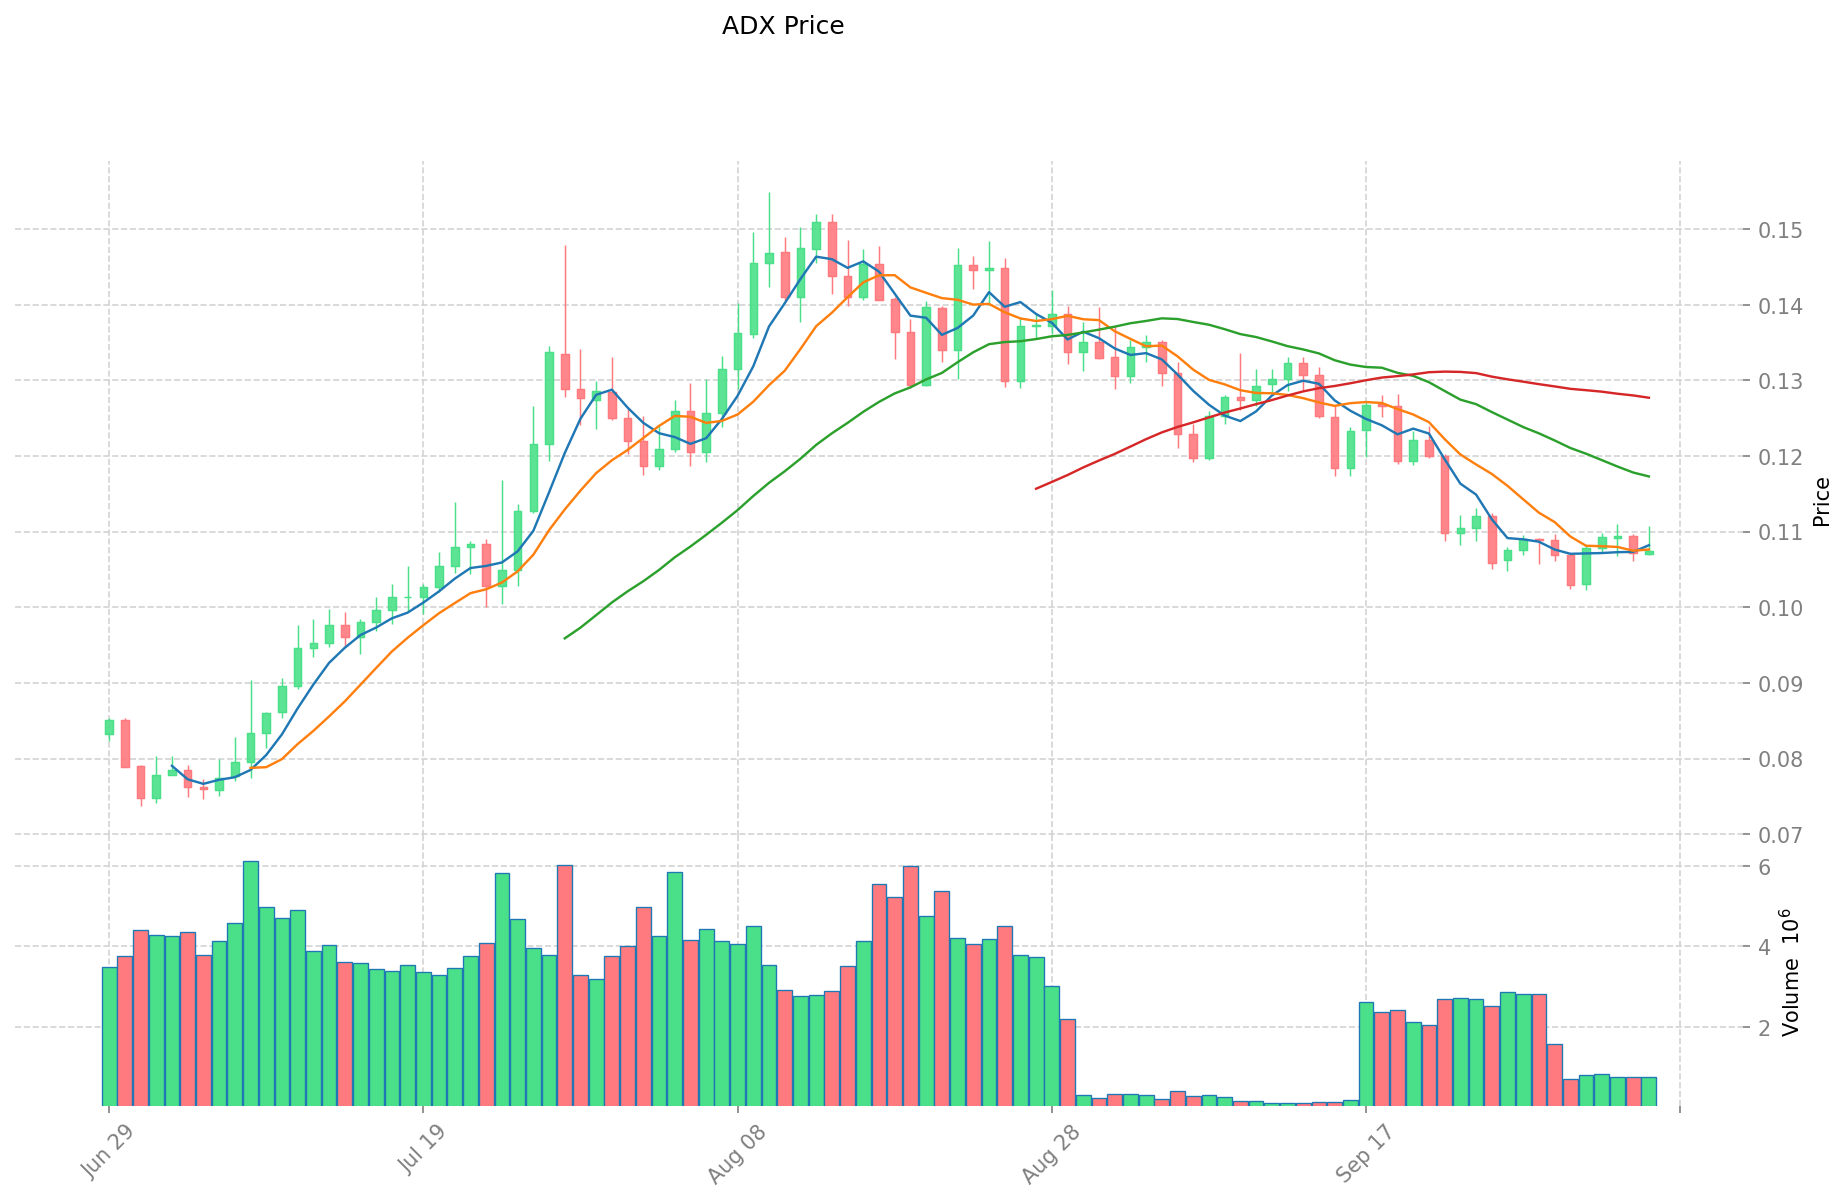
- 2023: ADX experienced significant price volatility due to overall crypto market conditions.
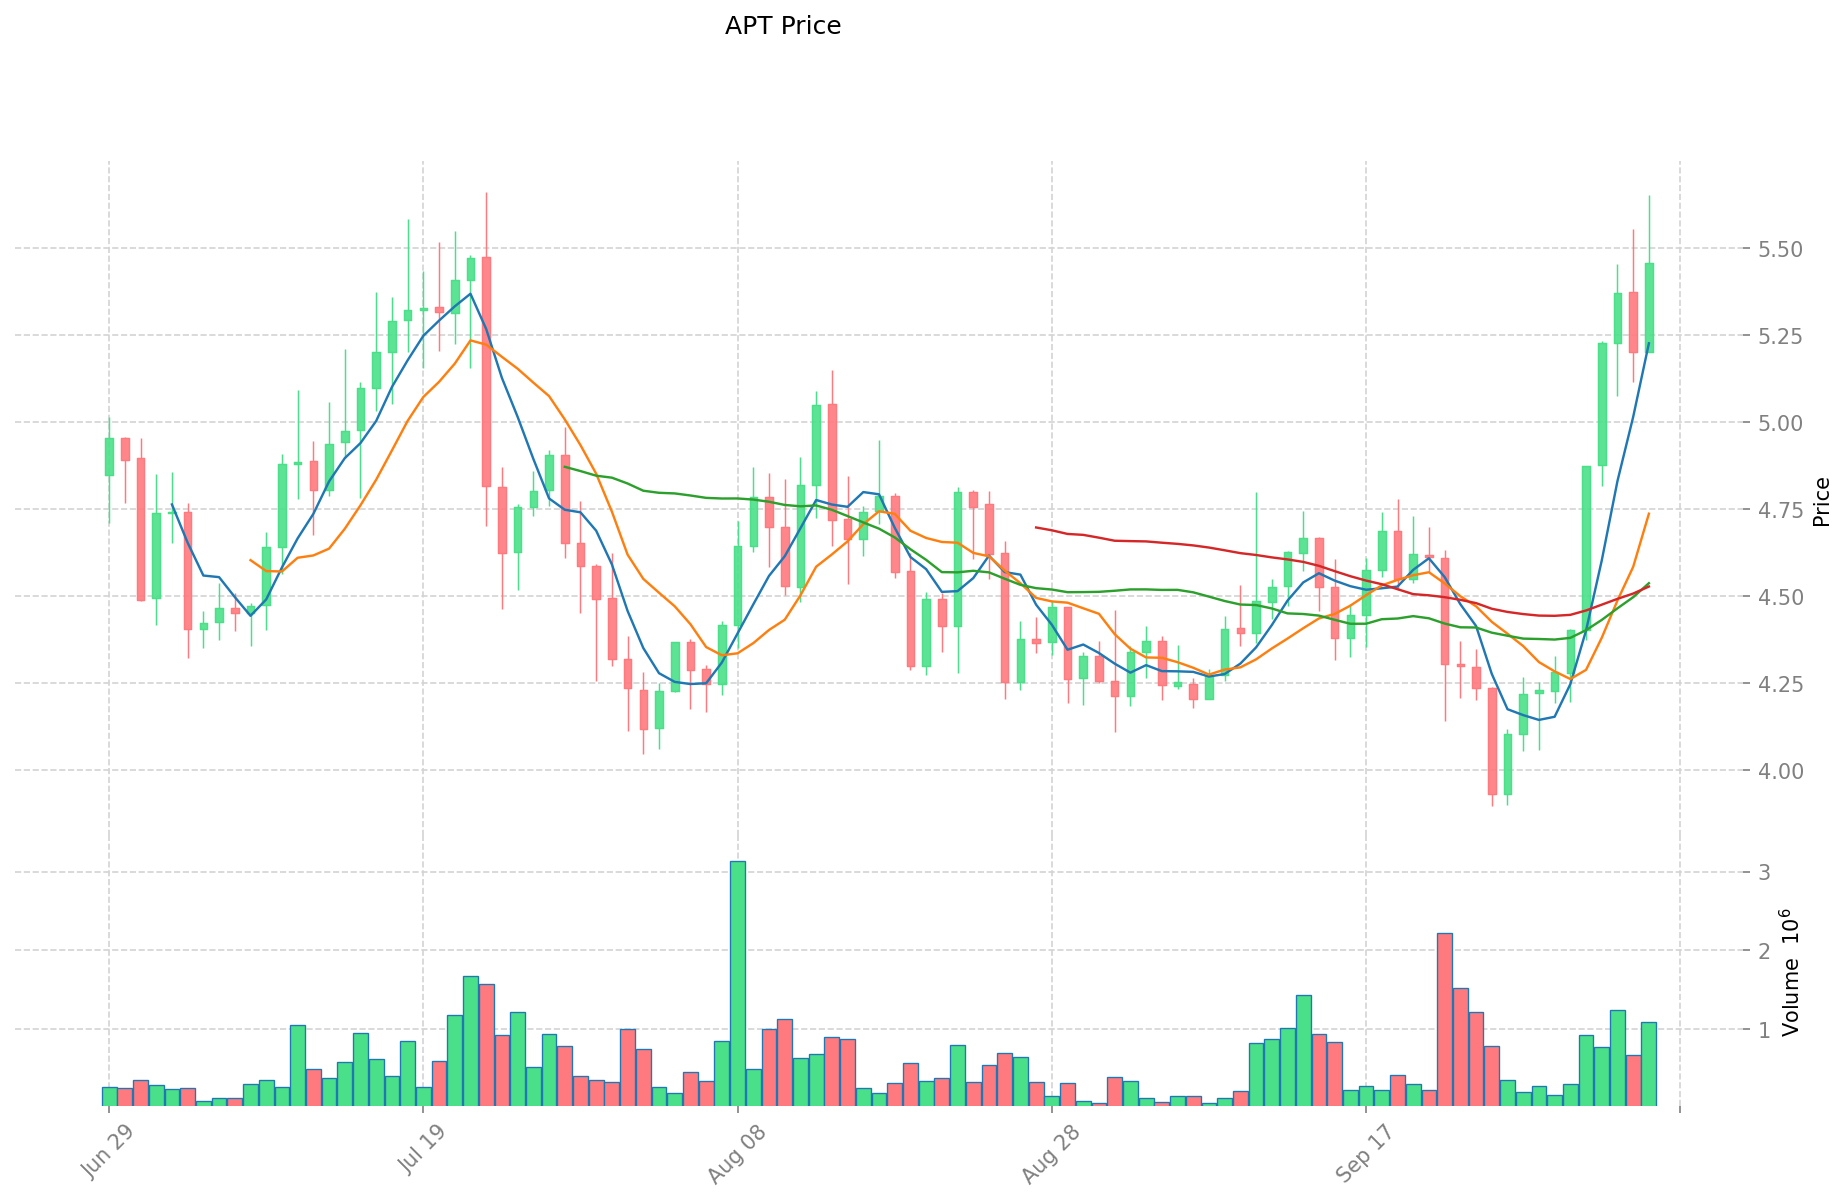
- 2023: APT saw price fluctuations influenced by its mainnet launch and ecosystem development.
- Comparative analysis: During the recent market cycle, ADX dropped from its all-time high of $3.49 to a low of $0.03, while APT demonstrated relatively stronger performance since its launch.
Current Market Situation (2025-10-06)
- ADX current price: $0.1075
- APT current price: $5.429
- 24-hour trading volume: ADX $82,601 vs APT $6,145,530
- Market Sentiment Index (Fear & Greed Index): 74 (Greed)
Click to view real-time prices:
- View ADX current price Market Price
- View APT current price Market Price
II. Key Factors Affecting ADX vs APT Investment Value
Market Dynamics and Technical Analysis
- ADX: Focuses on measuring the strength of market trends without indicating direction
- APT: Associated with price volatility and trading opportunities, as seen in butterfly pattern formations in trading
- 📌 Historical Pattern: Both are influenced by investor sentiment, sudden events, and exhibit high randomness with complex non-linear structures
Institutional Adoption and Market Applications
- Institutional Investment: Notable investors in the ecosystem include OKX, Matrixport, Hashkey, and SevenX with $15 million raised across two funding rounds
- Market Needs: In the Web3 ecosystem, social interaction and trust are identified as critical factors
- Traditional platforms like Facebook present limitations that these technologies aim to address
Technical Development and Ecosystem Building
- Social Infrastructure: Both technologies appear to address needs within the social and trust frameworks of Web3
- Technology Integration: Quantitative investment models are evolving with computer technology advancement, potentially benefiting both tokens
- Trading Analysis: APT shows specific technical patterns (butterfly formations) that traders use for market entry points
Macroeconomic and Market Cycles
- Price Prediction Challenges: Asset prices are affected by multiple factors including investor sentiment and unexpected events
- Market Complexity: The high randomness and non-linear structure make precise prediction difficult
- Trading Opportunities: Technical analysis frameworks provide structured approaches to identifying potential market opportunities
III. 2025-2030 Price Prediction: ADX vs APT
Short-term Prediction (2025)
- ADX: Conservative $0.0601832 - $0.10747 | Optimistic $0.10747 - $0.1149929
- APT: Conservative $3.55608 - $5.388 | Optimistic $5.388 - $6.14232
Mid-term Prediction (2027)
- ADX may enter a growth phase, with an expected price range of $0.064102684635 - $0.15837133851
- APT may enter a consolidation phase, with an expected price range of $6.362430576 - $8.364094128
- Key drivers: Institutional capital inflow, ETF, ecosystem development
Long-term Prediction (2030)
- ADX: Base scenario $0.146463529543548 - $0.212265984845722 | Optimistic scenario $0.212265984845722 - $0.303540358329383
- APT: Base scenario $8.04211617990312 - $8.4653854525296 | Optimistic scenario $8.4653854525296 - $11.936193488066736
Disclaimer
ADX:
| 年份 | 预测最高价 | 预测平均价格 | 预测最低价 | 涨跌幅 |
|---|---|---|---|---|
| 2025 | 0.1149929 | 0.10747 | 0.0601832 | 0 |
| 2026 | 0.140151627 | 0.11123145 | 0.1034452485 | 3 |
| 2027 | 0.15837133851 | 0.1256915385 | 0.064102684635 | 16 |
| 2028 | 0.2045252714472 | 0.142031438505 | 0.12072672272925 | 32 |
| 2029 | 0.251253614715345 | 0.1732783549761 | 0.12129484848327 | 61 |
| 2030 | 0.303540358329383 | 0.212265984845722 | 0.146463529543548 | 97 |
APT:
| 年份 | 预测最高价 | 预测平均价格 | 预测最低价 | 涨跌幅 |
|---|---|---|---|---|
| 2025 | 6.14232 | 5.388 | 3.55608 | 0 |
| 2026 | 8.5324368 | 5.76516 | 4.8427344 | 6 |
| 2027 | 8.364094128 | 7.1487984 | 6.362430576 | 31 |
| 2028 | 8.06670411456 | 7.756446264 | 4.18848098256 | 42 |
| 2029 | 9.0191957157792 | 7.91157518928 | 4.0349033465328 | 45 |
| 2030 | 11.936193488066736 | 8.4653854525296 | 8.04211617990312 | 55 |
IV. Investment Strategy Comparison: ADX vs APT
Long-term vs Short-term Investment Strategies
- ADX: Suitable for investors focused on Web3 marketing and advertising ecosystems
- APT: Suitable for investors interested in high-performance Layer 1 blockchain platforms
Risk Management and Asset Allocation
- Conservative investors: ADX: 30% vs APT: 70%
- Aggressive investors: ADX: 50% vs APT: 50%
- Hedging tools: Stablecoin allocation, options, cross-currency portfolios
V. Potential Risk Comparison
Market Risk
- ADX: Volatility due to relatively low market cap and trading volume
- APT: Susceptibility to broader crypto market trends and sentiment
Technical Risk
- ADX: Scalability, network stability
- APT: Potential centralization issues, security vulnerabilities
Regulatory Risk
- Global regulatory policies may have differing impacts on both tokens
VI. Conclusion: Which Is the Better Buy?
📌 Investment Value Summary:
- ADX advantages: Innovative Web3 marketing platform, potential for growth in digital advertising
- APT advantages: High-performance PoS blockchain, strong institutional backing, larger ecosystem
✅ Investment Advice:
- Novice investors: Consider a balanced approach with a higher allocation to APT due to its larger market presence
- Experienced investors: Explore a diversified portfolio including both ADX and APT based on risk tolerance
- Institutional investors: Conduct thorough due diligence on both projects, with potential for higher allocation to APT given its institutional adoption
⚠️ Risk Warning: The cryptocurrency market is highly volatile, and this article does not constitute investment advice. None
FAQ
Q1: What are the main differences between ADX and APT? A: ADX is focused on web3 marketing and advertising, while APT is a high-performance PoS Layer 1 blockchain. ADX has a lower market cap and trading volume, whereas APT has stronger institutional backing and a larger ecosystem.
Q2: Which cryptocurrency has performed better historically? A: Based on the available information, APT has demonstrated relatively stronger performance since its launch in 2022. ADX experienced significant price volatility, dropping from its all-time high of $3.49 to a low of $0.03.
Q3: What are the price predictions for ADX and APT by 2030? A: For ADX, the base scenario predicts a range of $0.146 to $0.212, with an optimistic scenario of $0.212 to $0.303. For APT, the base scenario predicts a range of $8.04 to $8.46, with an optimistic scenario of $8.46 to $11.93.
Q4: How do institutional adoptions differ between ADX and APT? A: APT has notable institutional investors including OKX, Matrixport, Hashkey, and SevenX, with $15 million raised across two funding rounds. Specific information about ADX's institutional adoption is not provided in the given context.
Q5: What are the main risks associated with investing in ADX and APT? A: For ADX, risks include volatility due to low market cap and trading volume, scalability, and network stability. For APT, risks include susceptibility to broader crypto market trends, potential centralization issues, and security vulnerabilities. Both face regulatory risks depending on global policies.
Q6: How should investors allocate their portfolio between ADX and APT? A: Conservative investors might consider allocating 30% to ADX and 70% to APT, while aggressive investors might opt for a 50-50 split. However, the exact allocation should depend on individual risk tolerance and investment goals.
Q7: Which cryptocurrency is recommended for novice investors? A: For novice investors, a balanced approach with a higher allocation to APT is suggested due to its larger market presence and stronger institutional backing. However, it's important to note that all cryptocurrency investments carry significant risks.
Share
Content