ACA vs STX: Comparative Analysis of Investment Performance in Blockchain Asset Management
Introduction: ACA vs STX Investment Comparison
In the cryptocurrency market, the comparison between Acala (ACA) vs Stacks (STX) has always been a topic that investors cannot ignore. The two not only have significant differences in market cap ranking, application scenarios, and price performance, but also represent different cryptocurrency positioning.
Acala (ACA): Since its launch in 2022, it has gained market recognition as a distributed finance network and liquidity hub for Polkadot.
Stacks (STX): Launched in 2019, it has been hailed as a new decentralized internet for applications, aiming to become the "Google" of blockchain.
This article will comprehensively analyze the investment value comparison between ACA and STX, focusing on historical price trends, supply mechanisms, institutional adoption, technical ecosystems, and future predictions, and attempt to answer the question that investors are most concerned about:
"Which is the better buy right now?"
I. Price History Comparison and Current Market Status
ACA and STX Historical Price Trends
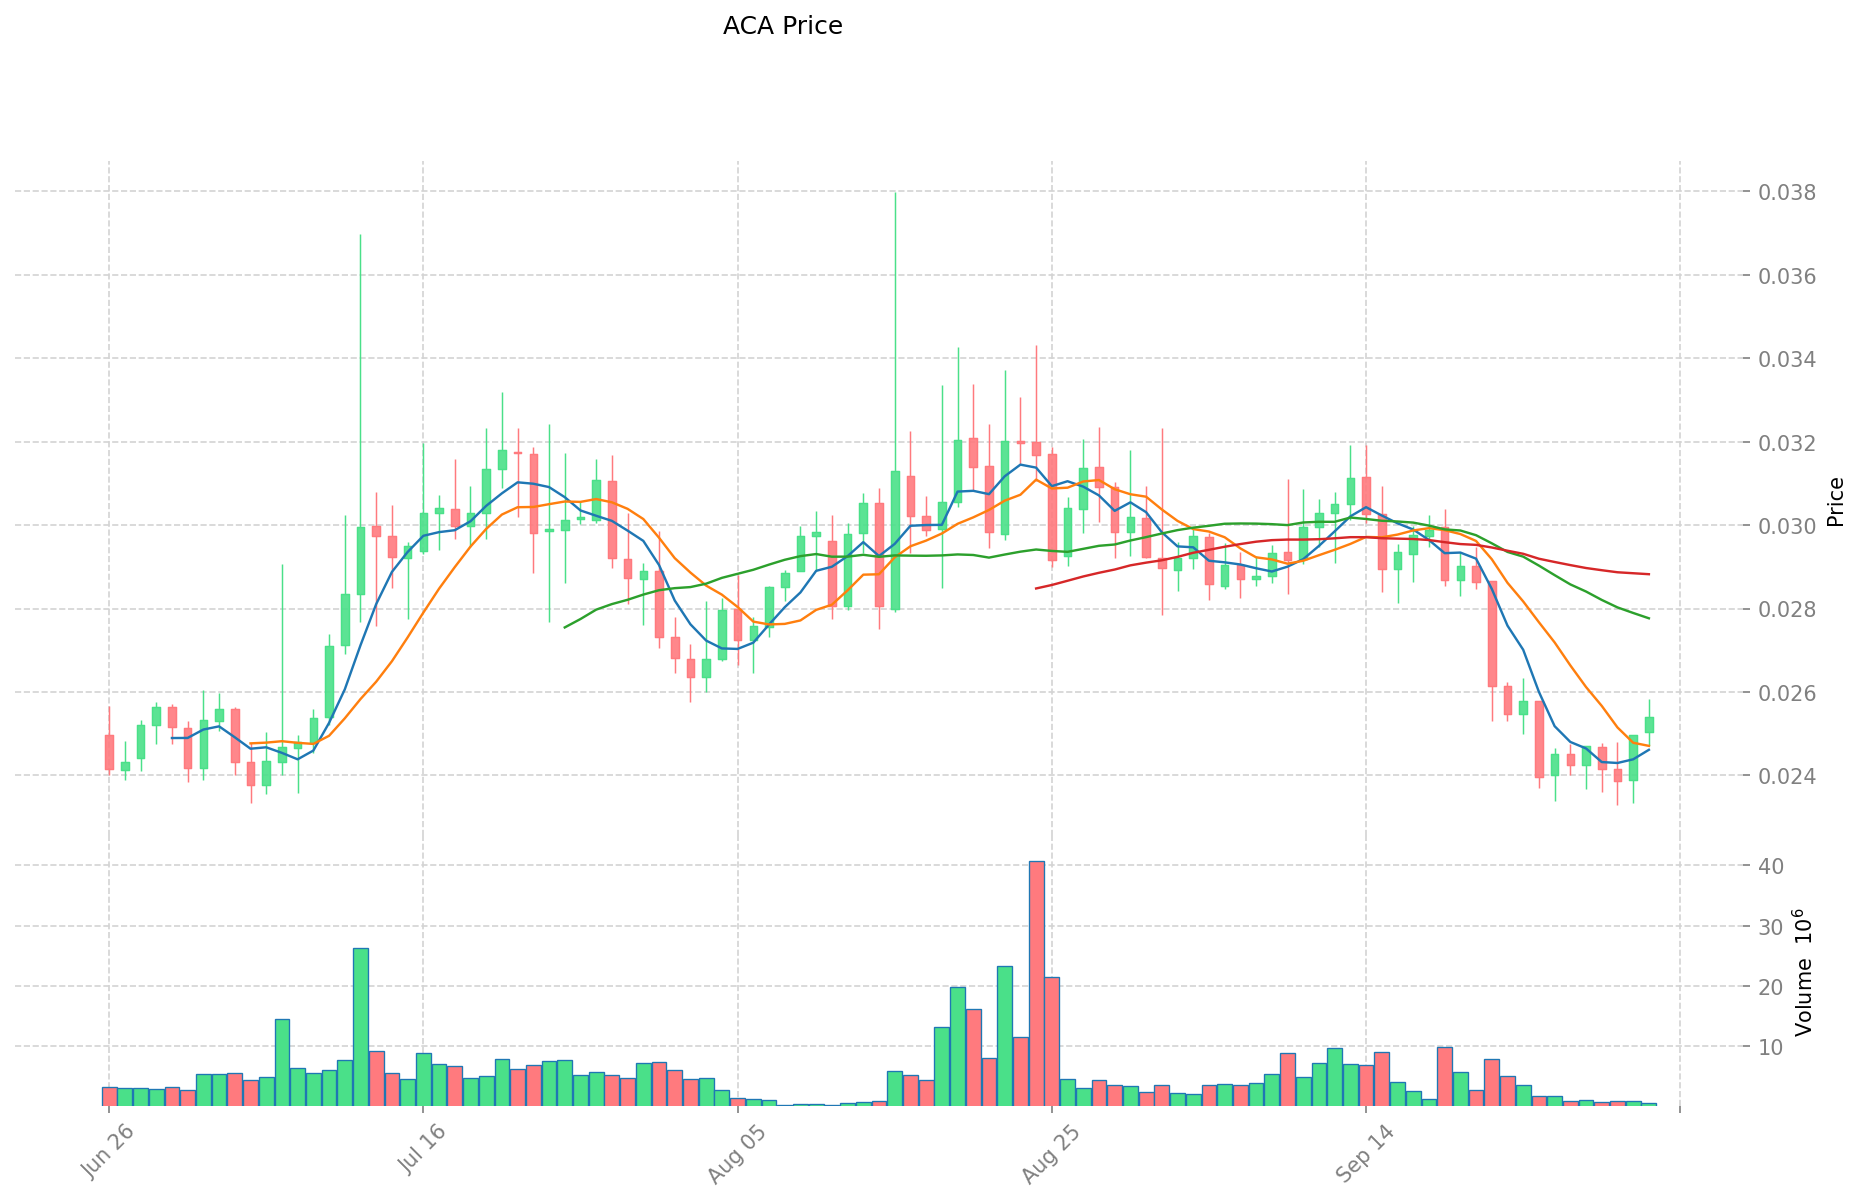
- 2022: ACA reached its all-time high of $2.79, then experienced a significant decline.
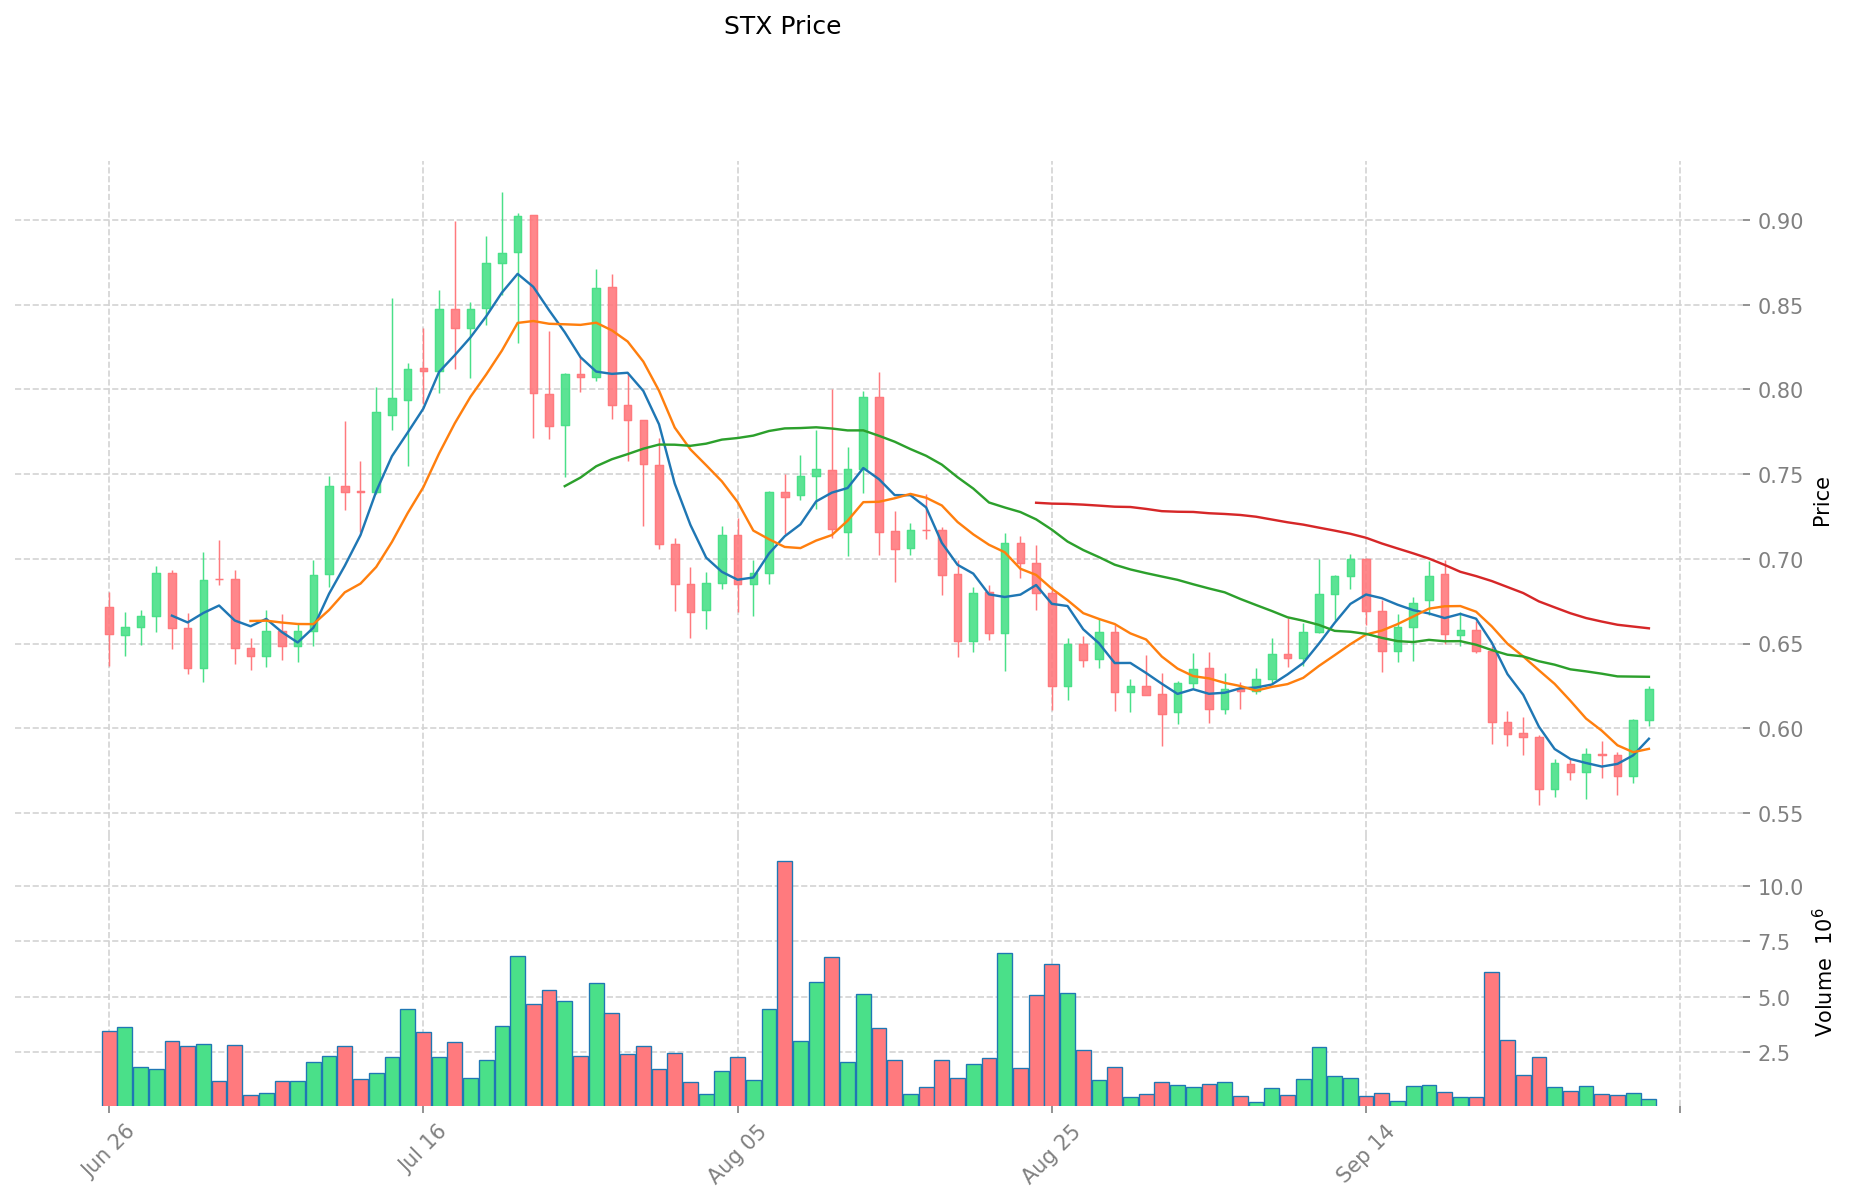
- 2024: STX hit its peak price of $3.86, showing strong growth in the crypto market.
- Comparative analysis: During the recent market cycle, ACA dropped from its high of $2.79 to a low of $0.02224974, while STX demonstrated more resilience, maintaining a higher price range.
Current Market Situation (2025-10-03)
- ACA current price: $0.02508
- STX current price: $0.6107
- 24-hour trading volume: ACA $15,511.18 vs STX $246,907.61
- Market Sentiment Index (Fear & Greed Index): 64 (Greed)
Click to view real-time prices:
- Check ACA current price Market Price
- Check STX current price Market Price
II. Core Factors Affecting ACA vs STX Investment Value
Supply Mechanisms Comparison (Tokenomics)
-
ACA: Focuses on connecting traditional finance with Web3, with its stablecoin aUSD reshaping value exchange paradigms across multiple chains
-
STX: Value dependent on growth of Stacks ecosystem and demand for Clarity smart contracts
-
📌 Historical pattern: Long-term crypto value is determined by ecosystem development, while short-term value is driven by trading activity.
Institutional Adoption and Market Applications
- Institutional Holdings: Limited information available on institutional preferences between these assets
- Enterprise Adoption: ACA positions itself as a bridge between traditional finance and Web3, offering cross-border payments and enterprise-level DeFi solutions
- Regulatory Policies: Limited information on specific regulatory approaches to these assets across different jurisdictions
Technical Development and Ecosystem Building
- ACA Technical Focus: Technical advancement aimed at connecting traditional finance with Web3, developing infrastructure for cross-border payments and enterprise DeFi
- STX Technical Development: Features the Clarity smart contract language, though ecosystem development appears relatively slow with limited developer and user growth
- Ecosystem Comparison: ACA emphasizes cross-chain value exchange paradigms, while STX ecosystem shows slower development with limited growth in developers and actual users
Macroeconomic Factors and Market Cycles
- Performance During Inflation: Limited information on inflation-resistant properties
- Monetary Policy Impact: Limited information on how interest rates and USD index affect these assets specifically
- Geopolitical Factors: ACA positioned to benefit from cross-border transaction demand through its focus on connecting traditional finance with Web3
III. 2025-2030 Price Prediction: ACA vs STX
Short-term Prediction (2025)
- ACA: Conservative $0.018855 - $0.02514 | Optimistic $0.02514 - $0.0359502
- STX: Conservative $0.580735 - $0.6113 | Optimistic $0.6113 - $0.831368
Mid-term Prediction (2027)
- ACA may enter a growth phase, with expected prices ranging from $0.0234586368 to $0.0516823092
- STX may enter a bullish market, with expected prices ranging from $0.686709968 to $1.050262304
- Key drivers: Institutional capital inflow, ETF, ecosystem development
Long-term Prediction (2030)
- ACA: Base scenario $0.05416789838544 - $0.075293378755761 | Optimistic scenario $0.075293378755761+
- STX: Base scenario $1.3417747248864 - $1.690636153356864 | Optimistic scenario $1.690636153356864+
Disclaimer: This analysis is based on historical data and current market trends. Cryptocurrency markets are highly volatile and unpredictable. This information should not be considered as financial advice. Always conduct your own research before making investment decisions.
ACA:
| 年份 | 预测最高价 | 预测平均价格 | 预测最低价 | 涨跌幅 |
|---|---|---|---|---|
| 2025 | 0.0359502 | 0.02514 | 0.018855 | 0 |
| 2026 | 0.04276314 | 0.0305451 | 0.01832706 | 21 |
| 2027 | 0.0516823092 | 0.03665412 | 0.0234586368 | 46 |
| 2028 | 0.054768586104 | 0.0441682146 | 0.036659618118 | 76 |
| 2029 | 0.05886739641888 | 0.049468400352 | 0.0321544602288 | 97 |
| 2030 | 0.075293378755761 | 0.05416789838544 | 0.048209429563041 | 115 |
STX:
| 年份 | 预测最高价 | 预测平均价格 | 预测最低价 | 涨跌幅 |
|---|---|---|---|---|
| 2025 | 0.831368 | 0.6113 | 0.580735 | 0 |
| 2026 | 0.89445416 | 0.721334 | 0.54821384 | 18 |
| 2027 | 1.050262304 | 0.80789408 | 0.686709968 | 32 |
| 2028 | 1.22638321344 | 0.929078192 | 0.58531926096 | 52 |
| 2029 | 1.6058187470528 | 1.07773070272 | 0.8406299481216 | 76 |
| 2030 | 1.690636153356864 | 1.3417747248864 | 1.046584285411392 | 119 |
IV. Investment Strategy Comparison: ACA vs STX
Long-term vs Short-term Investment Strategies
- ACA: Suitable for investors focused on DeFi and cross-chain interoperability
- STX: Suitable for investors interested in decentralized internet applications
Risk Management and Asset Allocation
- Conservative investors: ACA: 30% vs STX: 70%
- Aggressive investors: ACA: 60% vs STX: 40%
- Hedging tools: Stablecoin allocation, options, cross-currency combinations
V. Potential Risk Comparison
Market Risk
- ACA: High volatility, limited market adoption
- STX: Market competition from other smart contract platforms
Technical Risk
- ACA: Scalability, network stability
- STX: Ecosystem growth, developer adoption
Regulatory Risk
- Global regulatory policies may impact both assets differently, with potential implications for cross-border transactions and decentralized applications
VI. Conclusion: Which Is the Better Buy?
📌 Investment Value Summary:
- ACA advantages: Focus on DeFi and cross-chain interoperability, potential for growth in cross-border transactions
- STX advantages: Established ecosystem, potential for decentralized internet applications
✅ Investment Advice:
- New investors: Consider a balanced approach with a slight preference for STX due to its more established ecosystem
- Experienced investors: Explore opportunities in both assets, with a focus on their respective technological advancements
- Institutional investors: Evaluate both assets based on their specific use cases and potential for integration with existing financial systems
⚠️ Risk Warning: Cryptocurrency markets are highly volatile. This article does not constitute investment advice. None
VII. FAQ
Q1: What are the main differences between ACA and STX? A: ACA focuses on connecting traditional finance with Web3 and cross-chain interoperability, while STX aims to become a decentralized internet for applications. ACA is built on Polkadot, while STX is its own blockchain platform.
Q2: Which cryptocurrency has shown better price performance historically? A: Based on historical data, STX has demonstrated more resilience in price performance. While ACA dropped from its all-time high of $2.79 to a low of $0.02224974, STX maintained a higher price range and reached its peak of $3.86 in 2024.
Q3: What are the key factors affecting the investment value of ACA and STX? A: Key factors include supply mechanisms, institutional adoption, technical development, ecosystem building, and macroeconomic factors such as inflation and geopolitical events.
Q4: What are the price predictions for ACA and STX in 2030? A: For ACA, the base scenario predicts a range of $0.05416789838544 to $0.075293378755761. For STX, the base scenario predicts a range of $1.3417747248864 to $1.690636153356864. However, these are speculative and should not be considered financial advice.
Q5: How do the investment strategies differ for ACA and STX? A: ACA is suitable for investors focused on DeFi and cross-chain interoperability, while STX is suitable for those interested in decentralized internet applications. Conservative investors might allocate 30% to ACA and 70% to STX, while aggressive investors might do the opposite.
Q6: What are the potential risks associated with investing in ACA and STX? A: Both face market risks such as volatility and competition. Technical risks include scalability and ecosystem growth. Regulatory risks may impact both assets differently, particularly regarding cross-border transactions and decentralized applications.
Q7: Which cryptocurrency is considered the better buy? A: The better buy depends on individual investment goals and risk tolerance. New investors might prefer a balanced approach with a slight preference for STX due to its more established ecosystem. Experienced investors could explore opportunities in both assets, focusing on their respective technological advancements.
Share
Content
Introduction: ACA vs STX Investment Comparison
I. Price History Comparison and Current Market Status
II. Core Factors Affecting ACA vs STX Investment Value
III. 2025-2030 Price Prediction: ACA vs STX
IV. Investment Strategy Comparison: ACA vs STX
V. Potential Risk Comparison
VI. Conclusion: Which Is the Better Buy?
VII. FAQ

