2025 VT Price Prediction: Bullish Trends and Key Factors Shaping the Future of Virtual Token Markets
Introduction: VT's Market Position and Investment Value
Vtrading (VT), as an AI-driven quantitative trading platform in the digital asset space, has been making strides since its inception. As of 2025, VT's market capitalization stands at $281,190, with a circulating supply of approximately 210,000,000 tokens, and a price hovering around $0.001339. This asset, often referred to as a "revolution in AI-powered quantitative trading services," is playing an increasingly crucial role in the field of automated trading strategies and asset management.
This article will provide a comprehensive analysis of VT's price trends from 2025 to 2030, considering historical patterns, market supply and demand, ecosystem development, and macroeconomic factors to offer professional price predictions and practical investment strategies for investors.
I. VT Price History Review and Current Market Status
VT Historical Price Evolution Trajectory
- 2024: Initial launch, price reached all-time high of $0.225 on May 28
- 2025: Market downturn, price dropped to all-time low of $0.001026 on July 17
- 2025: Gradual recovery, current price stabilizing around $0.001339
VT Current Market Situation
As of October 31, 2025, VT is trading at $0.001339, with a 24-hour trading volume of $9,828.46. The token has experienced a slight decline of 0.81% in the past 24 hours. However, it shows positive momentum in other time frames, with a 2.52% increase in the last hour and a 6.02% gain over the past week.
VT's market capitalization currently stands at $281,190, ranking it at 3995 in the global cryptocurrency market. The circulating supply is 210,000,000 VT, which represents 21% of the total supply of 1,000,000,000 VT. The fully diluted market cap is $1,339,000.
Despite the recent positive short-term trends, VT has seen a significant decline of 94.17% over the past year, indicating a challenging long-term performance.
Click to view the current VT market price

VT Market Sentiment Indicator
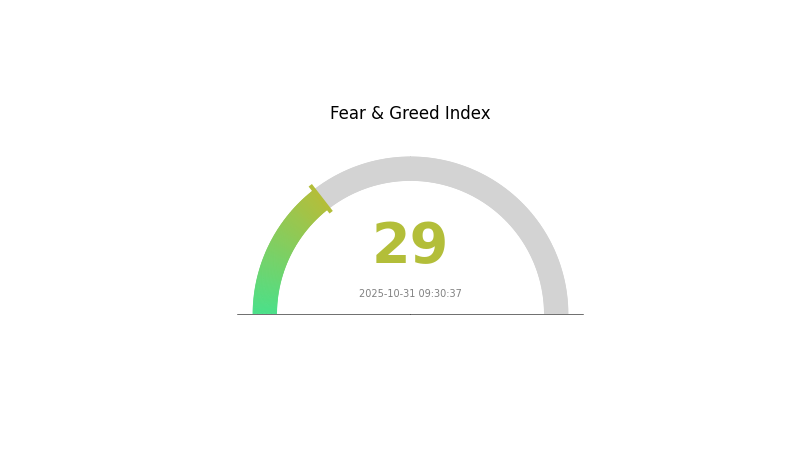
2025-10-31 Fear and Greed Index: 29 (Fear)
Click to view the current Fear & Greed Index
The crypto market sentiment remains cautious as the Fear and Greed Index hovers at 29, indicating a state of fear. This suggests investors are wary and potentially looking for buying opportunities. However, it's crucial to remember that market sentiment can shift rapidly. While fear may present potential entry points for long-term investors, it's essential to conduct thorough research and manage risks carefully. As always, diversification and a well-thought-out investment strategy are key in navigating volatile crypto markets.
VT Holdings Distribution
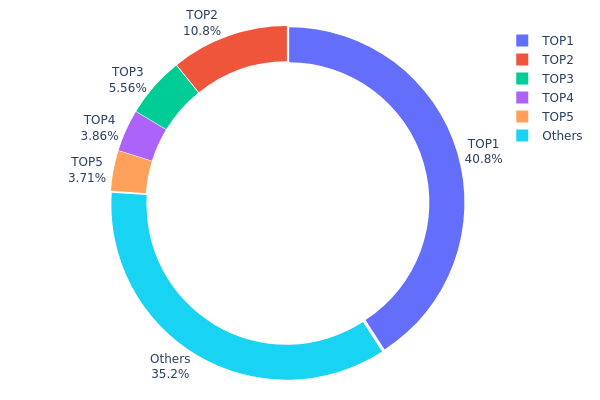
The address holdings distribution data provides crucial insights into the concentration of VT tokens among different addresses. Based on the given data, we observe a significant concentration of VT tokens in a few top addresses. The top address holds 40.83% of the total supply, while the top 5 addresses collectively control 64.73% of VT tokens.
This high concentration raises concerns about potential market manipulation and price volatility. With a single address holding over 40% of the supply, there's a risk of large-scale sell-offs or buying pressure that could dramatically impact VT's market price. Furthermore, the top 5 addresses controlling nearly two-thirds of the supply indicates a low level of decentralization, which may affect the token's governance and overall market stability.
Despite these concerns, it's worth noting that 35.27% of VT tokens are distributed among other addresses, suggesting some level of broader market participation. However, the current distribution structure points to a relatively centralized token ecosystem, which could impact VT's long-term sustainability and market dynamics.
Click to view the current VT Holdings Distribution
| Top | Address | Holding Qty | Holding (%) |
|---|---|---|---|
| 1 | 0xc882...84f071 | 147004.42K | 40.83% |
| 2 | 0x9642...2f5d4e | 38868.01K | 10.79% |
| 3 | 0x5da9...b22d23 | 20000.00K | 5.55% |
| 4 | 0x331d...ada33f | 13900.00K | 3.86% |
| 5 | 0x0d07...b492fe | 13345.12K | 3.70% |
| - | Others | 126882.45K | 35.27% |
II. Key Factors Affecting VT's Future Price
Macroeconomic Environment
- Monetary Policy Impact: Major central banks are expected to enter an interest rate cutting cycle, which could increase the attractiveness of VT as interest rates decline.
- Inflation Hedging Properties: As a global equity ETF, VT may serve as a potential hedge against inflation, though its effectiveness may vary depending on global economic conditions.
- Geopolitical Factors: Ongoing tensions in the Middle East, such as the Iran-Israel conflict, could impact global markets and consequently affect VT's performance.
Technical Development and Ecosystem Building
- Market Sentiment: The apparent prosperity of the stock market in 2025 seems to be driven more by policy factors than productivity or profits, which could be a cause for caution among market participants.
III. VT Price Prediction for 2025-2030
2025 Outlook
- Conservative prediction: $0.00088 - $0.00134
- Neutral prediction: $0.00134 - $0.00146
- Optimistic prediction: $0.00146 - $0.00158 (requires positive market sentiment)
2027 Mid-term Outlook
- Market phase expectation: Potential growth phase
- Price range forecast:
- 2026: $0.00142 - $0.00185
- 2027: $0.00152 - $0.00191
- Key catalysts: Increased adoption and technological advancements
2030 Long-term Outlook
- Base scenario: $0.00219 - $0.00303 (assuming steady market growth)
- Optimistic scenario: $0.00303 - $0.00350 (assuming strong market performance)
- Transformative scenario: $0.00350 - $0.00400 (assuming breakthrough in technology and widespread adoption)
- 2030-12-31: VT $0.00303 (potential peak price)
| 年份 | 预测最高价 | 预测平均价格 | 预测最低价 | 涨跌幅 |
|---|---|---|---|---|
| 2025 | 0.00158 | 0.00134 | 0.00088 | 0 |
| 2026 | 0.00185 | 0.00146 | 0.00142 | 9 |
| 2027 | 0.00191 | 0.00166 | 0.00152 | 23 |
| 2028 | 0.00223 | 0.00178 | 0.00167 | 32 |
| 2029 | 0.00238 | 0.002 | 0.00118 | 49 |
| 2030 | 0.00303 | 0.00219 | 0.00118 | 63 |
IV. Professional Investment Strategies and Risk Management for VT
VT Investment Methodology
(1) Long-term Holding Strategy
- Suitable for: Long-term investors with high risk tolerance
- Operation suggestions:
- Accumulate VT during market dips
- Set price targets and regularly review portfolio
- Store tokens in secure hardware wallets
(2) Active Trading Strategy
- Technical analysis tools:
- Moving Averages: Use to identify trends and support/resistance levels
- RSI (Relative Strength Index): Identify overbought/oversold conditions
- Key points for swing trading:
- Monitor trading volume for potential trend reversals
- Use stop-loss orders to manage downside risk
VT Risk Management Framework
(1) Asset Allocation Principles
- Conservative investors: 1-3% of crypto portfolio
- Aggressive investors: 5-10% of crypto portfolio
- Professional investors: Up to 15% of crypto portfolio
(2) Risk Hedging Solutions
- Diversification: Spread investments across multiple cryptocurrencies
- Options trading: Use put options for downside protection
(3) Secure Storage Solutions
- Hot wallet recommendation: Gate Web3 wallet
- Cold storage solution: Use hardware wallets for long-term holdings
- Security precautions: Enable 2FA, use strong passwords, and regularly update software
V. Potential Risks and Challenges for VT
VT Market Risks
- High volatility: VT price can experience significant fluctuations
- Limited liquidity: Low trading volume may lead to slippage
- Market sentiment: Susceptible to broader crypto market trends
VT Regulatory Risks
- Regulatory uncertainty: Potential for new regulations affecting AI-driven trading platforms
- Compliance issues: Risk of non-compliance with evolving crypto regulations
- Cross-border restrictions: Possible limitations on international usage of the platform
VT Technical Risks
- Smart contract vulnerabilities: Potential for exploits in the underlying code
- AI model limitations: Risk of strategy underperformance due to market changes
- Platform downtime: Possible disruptions in trading services
VI. Conclusion and Action Recommendations
VT Investment Value Assessment
VT presents a high-risk, high-potential investment in the AI-driven quantitative trading sector. While offering innovative solutions, it faces significant market, regulatory, and technical challenges.
VT Investment Recommendations
✅ Beginners: Consider small, experimental positions after thorough research ✅ Experienced investors: Implement strict risk management and diversify across AI trading tokens ✅ Institutional investors: Conduct in-depth due diligence and consider as part of a broader crypto portfolio
VT Trading Participation Methods
- Spot trading: Buy and hold VT tokens on Gate.com
- Automated trading: Utilize VT's AI-driven strategies on supported platforms
- Staking: Participate in potential future staking programs for passive income
Cryptocurrency investments carry extremely high risks, and this article does not constitute investment advice. Investors should make decisions cautiously based on their own risk tolerance and are advised to consult professional financial advisors. Never invest more than you can afford to lose.
FAQ
Is VT ETF a buy?
Yes, VT ETF is a buy. It offers global market exposure, low costs, and minimal turnover. Its diversified portfolio reduces volatility, making it ideal for long-term investors seeking stable growth.
Is VTS a good stock to buy for long term?
Yes, VTS is a good long-term investment. It offers low fees, broad market exposure, and a solid track record of growth, making it an attractive option for investors seeking long-term value.
Is Vistra a good buy for 2025?
Based on its strong performance and growth potential, Vistra could be a good buy for 2025. However, consider its current valuation and market conditions before investing.
Is VT better than VOO?
VT offers broader global diversification, while VOO focuses on US stocks. As of 2025, VT has slightly outperformed VOO with a 17.27% return compared to VOO's 13.71%. Choose based on your investment goals.
Share
Content
Introduction: VT's Market Position and Investment Value
I. VT Price History Review and Current Market Status
II. Key Factors Affecting VT's Future Price
III. VT Price Prediction for 2025-2030
IV. Professional Investment Strategies and Risk Management for VT
V. Potential Risks and Challenges for VT
VI. Conclusion and Action Recommendations
FAQ

