2025 UMA Price Prediction: Analyzing Market Trends and Future Growth Potential in the DeFi Sector
Introduction: UMA's Market Position and Investment Value
UMA (UMA), as a decentralized financial contract platform, has made significant strides in promoting financial innovations since its inception in 2020. As of 2025, UMA's market capitalization has reached $105,200,426, with a circulating supply of approximately 90,146,038 tokens, and a price hovering around $1.167. This asset, often referred to as a "financial innovation enabler," is playing an increasingly crucial role in creating unique standardized financial products and contracts.
This article will comprehensively analyze UMA's price trends from 2025 to 2030, combining historical patterns, market supply and demand, ecosystem development, and macroeconomic factors to provide investors with professional price predictions and practical investment strategies.
I. UMA Price History Review and Current Market Status
UMA Historical Price Evolution Trajectory
- 2020: UMA launched, price fluctuated around $1
- 2021: Bull market peak, price reached all-time high of $41.56 on February 4
- 2022-2023: Crypto winter, price declined significantly
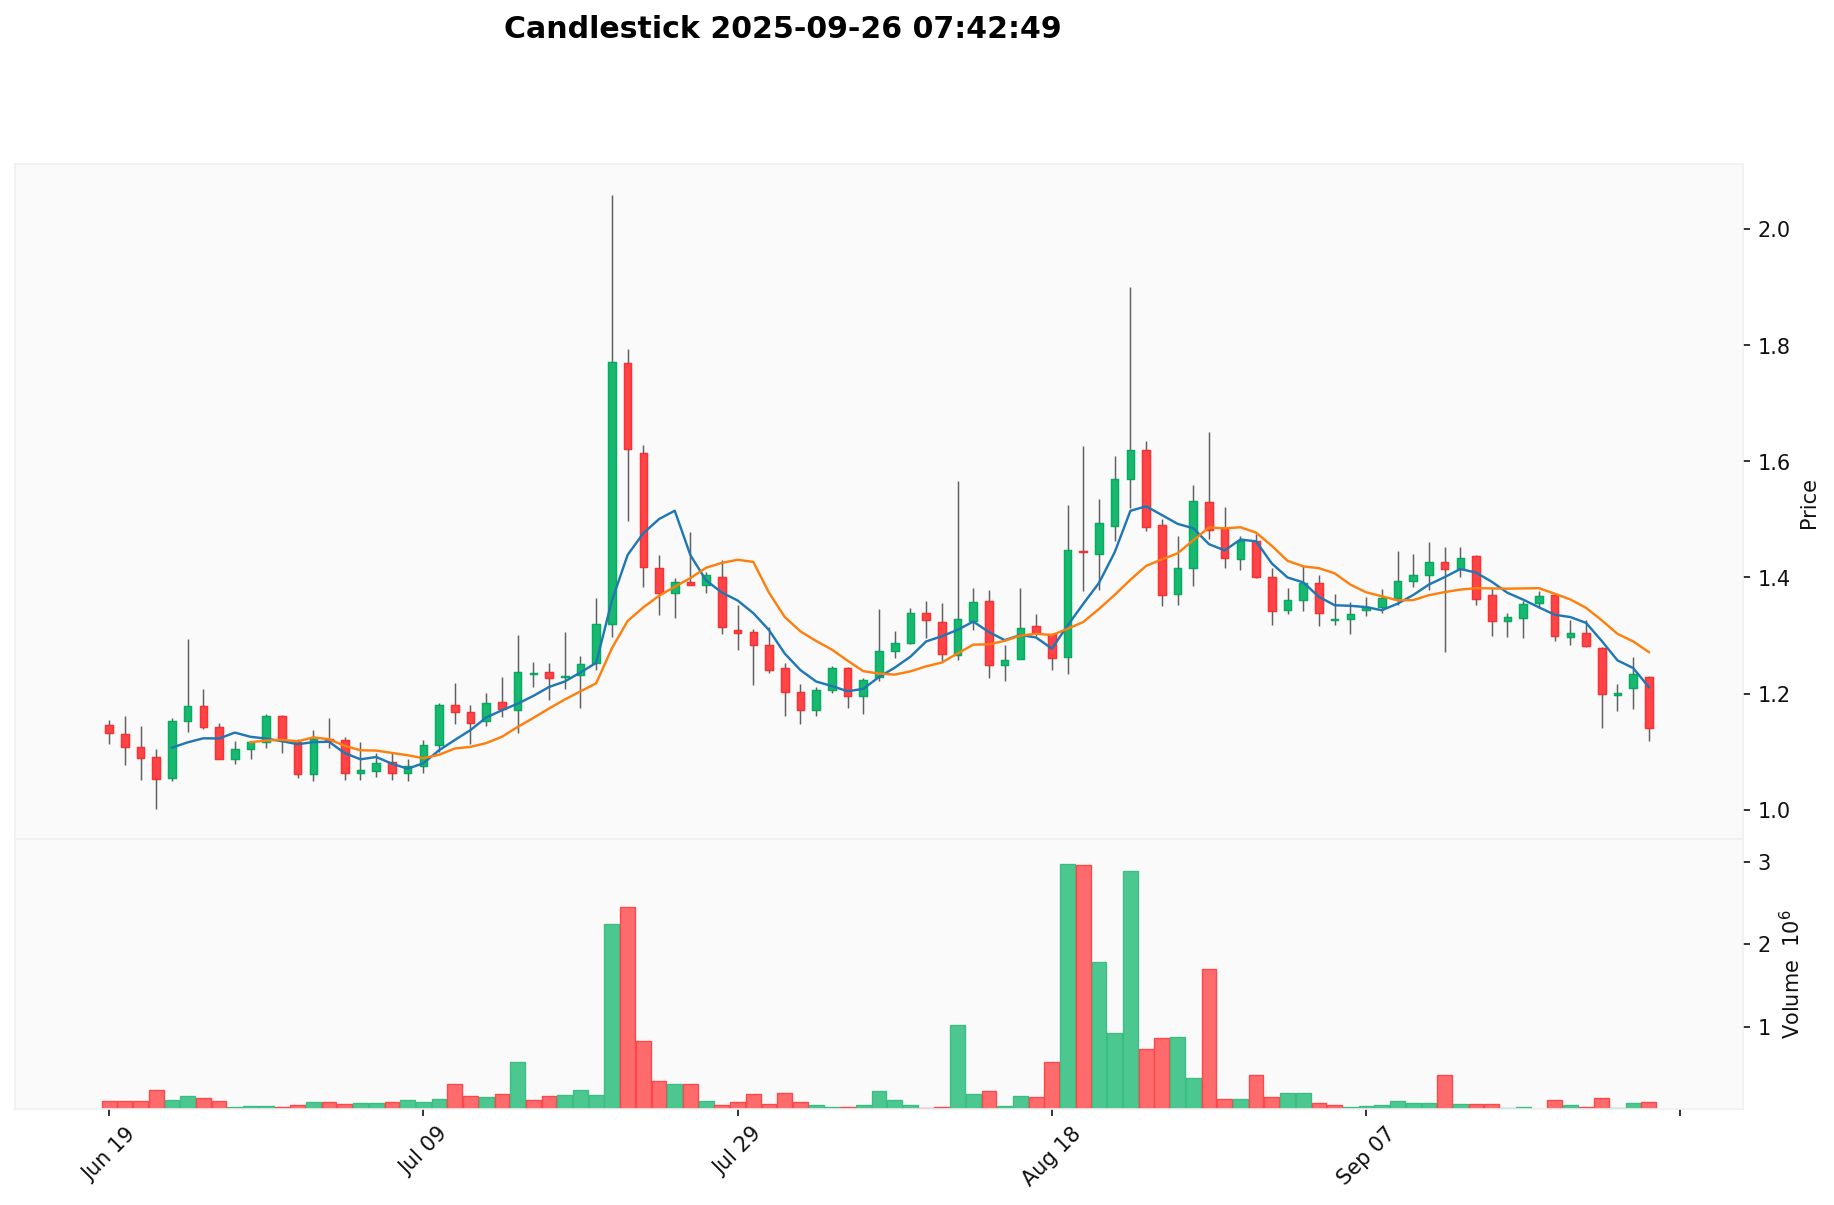
UMA Current Market Situation
As of September 26, 2025, UMA is trading at $1.167, with a 24-hour trading volume of $117,885. The token has experienced a 2.34% decrease in the last 24 hours. UMA's market cap currently stands at $105,200,426, ranking it 429th in the crypto market. The circulating supply is 90,146,038 UMA tokens, representing 78.67% of the total supply of 126,179,974 UMA. The token is currently trading 97.19% below its all-time high of $41.56, set on February 4, 2021. Over the past year, UMA has seen a significant decline of 49.78%, reflecting the broader market downturn.
Click to view the current UMA market price
UMA Market Sentiment Indicator
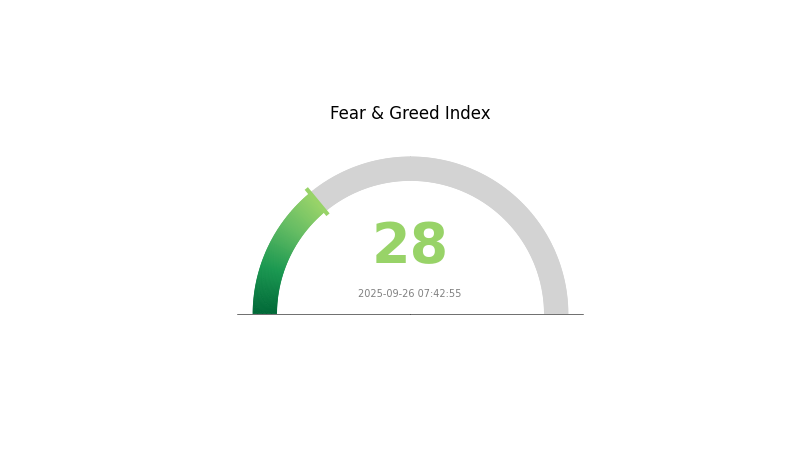
2025-09-26 Fear and Greed Index: 28 (Fear)
Click to view the current Fear & Greed Index
The crypto market sentiment for UMA is currently in a state of fear, with the Fear and Greed Index registering at 28. This indicates a cautious atmosphere among investors, potentially signaling undervaluation and a buying opportunity for contrarian traders. However, it's crucial to conduct thorough research and consider multiple factors before making investment decisions. The fear sentiment could be influenced by various market factors, including regulatory news, macroeconomic conditions, or recent price movements. As always, diversification and risk management remain key in navigating the volatile crypto landscape.
UMA Holdings Distribution
The address holdings distribution data provides insights into the concentration of UMA tokens among different wallet addresses. Analysis of this data reveals a significant concentration of UMA tokens among the top holders. The top two addresses collectively control over 53% of the total UMA supply, with 27.27% and 26.09% respectively. This high concentration raises concerns about potential market manipulation and volatility.
The top five addresses together hold approximately 65.65% of all UMA tokens, leaving only 34.35% distributed among other holders. This level of concentration suggests a relatively centralized token distribution, which could impact market dynamics and price movements. Such a distribution pattern may lead to increased price volatility if large holders decide to sell or move their holdings.
While this concentration does not necessarily indicate malicious intent, it does highlight potential risks to the token's stability and decentralization efforts. The current distribution structure may affect UMA's on-chain governance and decision-making processes, potentially giving disproportionate influence to a small number of large token holders.
Click to view the current UMA Holdings Distribution
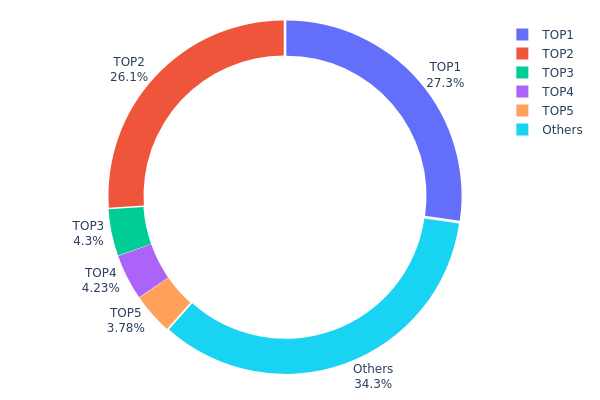
| Top | Address | Holding Qty | Holding (%) |
|---|---|---|---|
| 1 | 0x7b29...463fa8 | 34413.11K | 27.27% |
| 2 | 0x0043...bd34ac | 32919.09K | 26.09% |
| 3 | 0x61d6...5c9fcd | 5424.86K | 4.29% |
| 4 | 0xf977...41acec | 5332.83K | 4.22% |
| 5 | 0x8bd1...6e370c | 4775.29K | 3.78% |
| - | Others | 43309.21K | 34.35% |
II. Key Factors Influencing UMA's Future Price
Supply Mechanism
- Market Demand: The supply and demand dynamics in the cryptocurrency market significantly impact UMA's price.
- Historical Pattern: Past supply changes have shown a correlation with price movements.
- Current Impact: The current supply changes are expected to influence UMA's price based on market sentiment and adoption rates.
Institutional and Whale Dynamics
- Institutional Holdings: Major institutions' holdings in UMA can affect its price stability and market perception.
- Corporate Adoption: Companies adopting UMA for various use cases can drive its value and utility.
- Government Policies: Regulatory changes and government stances on cryptocurrencies can impact UMA's adoption and price.
Macroeconomic Environment
- Monetary Policy Impact: Central bank policies, especially those of the Federal Reserve, can influence crypto markets including UMA.
- Inflation Hedging Properties: UMA's performance as a potential hedge against inflation in various economic scenarios.
- Geopolitical Factors: International political and economic situations can affect UMA's global adoption and value.
Technological Development and Ecosystem Building
- DeFi Growth: The expansion of the decentralized finance sector can significantly impact UMA's utility and demand.
- Protocol Upgrades: Any improvements or upgrades to the UMA protocol can enhance its capabilities and attract more users.
- Ecosystem Applications: The development of DApps and projects within the UMA ecosystem can drive its adoption and value.
III. UMA Price Prediction for 2025-2030
2025 Outlook
- Conservative prediction: $1.0764 - $1.17
- Neutral prediction: $1.17 - $1.40
- Optimistic prediction: $1.40 - $1.638 (requires favorable market conditions)
2027-2028 Outlook
- Market stage expectation: Potential volatility with overall growth trend
- Price range forecast:
- 2027: $0.75928 - $1.73759
- 2028: $0.89537 - $2.01458
- Key catalysts: Increased adoption of UMA protocol, market sentiment, and overall crypto market performance
2029-2030 Long-term Outlook
- Base scenario: $1.80673 - $1.83383 (assuming steady growth and adoption)
- Optimistic scenario: $2.00 - $2.54902 (assuming strong market performance and increased utility)
- Transformative scenario: $2.54902 - $3.00 (assuming breakthrough developments and mainstream adoption)
- 2030-12-31: UMA $1.83383 (potential stabilization point after years of growth)
| 年份 | 预测最高价 | 预测平均价格 | 预测最低价 | 涨跌幅 |
|---|---|---|---|---|
| 2025 | 1.638 | 1.17 | 1.0764 | 0 |
| 2026 | 1.51632 | 1.404 | 1.30572 | 20 |
| 2027 | 1.73759 | 1.46016 | 0.75928 | 25 |
| 2028 | 2.01458 | 1.59888 | 0.89537 | 37 |
| 2029 | 1.86093 | 1.80673 | 1.22858 | 54 |
| 2030 | 2.54902 | 1.83383 | 1.26534 | 57 |
IV. Professional Investment Strategies and Risk Management for UMA
UMA Investment Methodology
(1) Long-term Holding Strategy
- Suitable for: Risk-tolerant investors with a long-term horizon
- Operational suggestions:
- Accumulate UMA during market dips
- Set price targets for partial profit-taking
- Store UMA in a secure non-custodial wallet
(2) Active Trading Strategy
- Technical analysis tools:
- Moving Averages: Monitor short-term and long-term trends
- RSI (Relative Strength Index): Identify overbought and oversold conditions
- Key points for swing trading:
- Use stop-loss orders to limit potential losses
- Take profits at predetermined resistance levels
UMA Risk Management Framework
(1) Asset Allocation Principles
- Conservative investors: 1-3% of crypto portfolio
- Moderate investors: 3-5% of crypto portfolio
- Aggressive investors: 5-10% of crypto portfolio
(2) Risk Hedging Solutions
- Diversification: Balance UMA with other crypto assets
- Options trading: Use put options for downside protection
(3) Secure Storage Solutions
- Hardware wallet recommendation: Gate Web3 Wallet
- Cold storage solution: Paper wallet for long-term holding
- Security precautions: Enable two-factor authentication, use strong passwords
V. Potential Risks and Challenges for UMA
UMA Market Risks
- Volatility: Significant price fluctuations common in the crypto market
- Liquidity: Potential challenges in large-scale trading during market stress
- Competition: Emergence of similar DeFi projects could impact UMA's market share
UMA Regulatory Risks
- Uncertain regulations: Potential for stricter DeFi regulations globally
- Compliance challenges: Adapting to evolving regulatory requirements
- Legal status: Possible classification as a security in some jurisdictions
UMA Technical Risks
- Smart contract vulnerabilities: Potential for exploits or bugs in the protocol
- Scalability issues: Challenges in handling increased transaction volume
- Oracle reliability: Dependence on external data sources for contract execution
VI. Conclusion and Action Recommendations
UMA Investment Value Assessment
UMA presents a unique value proposition in the DeFi space with its innovative financial contracts platform. However, investors should be aware of the high volatility and regulatory uncertainties in the short term.
UMA Investment Recommendations
✅ Beginners: Start with small positions and focus on education ✅ Experienced investors: Consider a balanced approach with risk management ✅ Institutional investors: Conduct thorough due diligence and consider OTC trading
UMA Trading Participation Methods
- Spot trading: Buy and sell UMA on Gate.com
- DeFi participation: Engage with UMA protocol for synthetic asset creation
- Yield farming: Explore liquidity provision opportunities in UMA pools
Cryptocurrency investments are extremely high-risk, and this article does not constitute investment advice. Investors should make decisions based on their own risk tolerance and are advised to consult professional financial advisors. Never invest more than you can afford to lose.
FAQ
Is uma a good crypto?
UMA shows potential as a long-term investment. Its innovative oracle system and growing DeFi applications make it promising for future growth.
What is the prediction for Uma in 2025?
UMA is predicted to trade between $0.85 and $1.05 in 2025, based on current market trends and analyst forecasts.
What is the all time high of Uma coin?
The all-time high of UMA coin is $44.06, which was reached on a previous date.
What is the price prediction for Mana 2025?
The predicted price for Mana in 2025 is around $0.32821117 on average, based on market analysis.
Share
Content
Introduction: UMA's Market Position and Investment Value
I. UMA Price History Review and Current Market Status
II. Key Factors Influencing UMA's Future Price
III. UMA Price Prediction for 2025-2030
IV. Professional Investment Strategies and Risk Management for UMA
V. Potential Risks and Challenges for UMA
VI. Conclusion and Action Recommendations
FAQ

