2025 STEP Price Prediction: Analyzing Market Trends and Future Growth Potential for the Digital Asset
Introduction: STEP's Market Position and Investment Value
Step Finance (STEP) as a portfolio visualization platform for DeFi users, has made significant strides since its inception in 2021. As of 2025, STEP's market capitalization has reached $17,339,455, with a circulating supply of approximately 318,038,432 tokens, and a price hovering around $0.05452. This asset, often referred to as the "DeFi dashboard," is playing an increasingly crucial role in aggregating and visualizing decentralized finance investments.
This article will comprehensively analyze STEP's price trends from 2025 to 2030, combining historical patterns, market supply and demand, ecosystem development, and macroeconomic factors to provide investors with professional price predictions and practical investment strategies.
I. STEP Price History Review and Current Market Status
STEP Historical Price Evolution
- 2021: Initial launch, price reached all-time high of $10.2 on April 29
- 2022: Crypto winter, price dropped to all-time low of $0.00654111 on November 14
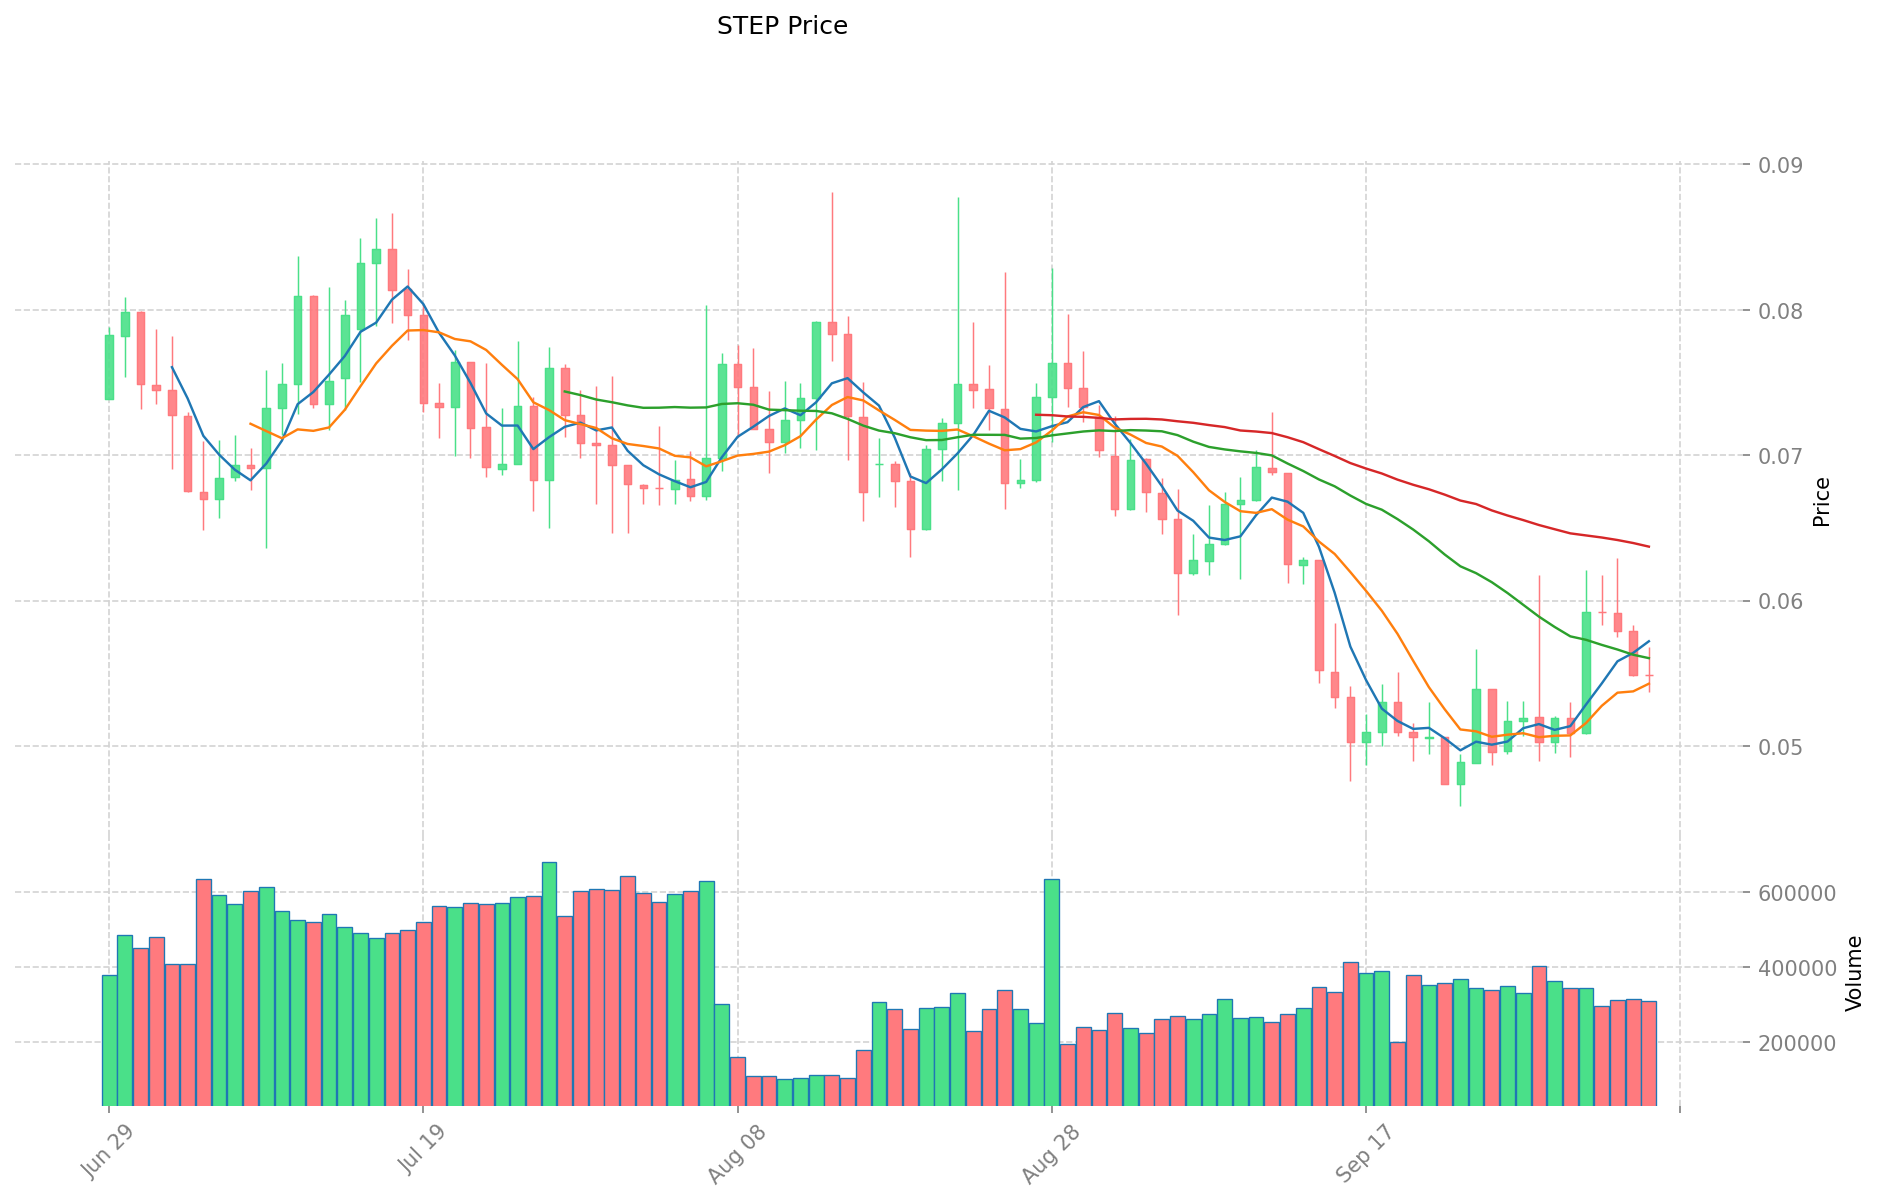
- 2023-2025: Gradual recovery, price fluctuating between $0.04 and $0.06
STEP Current Market Situation
As of October 6, 2025, STEP is trading at $0.05452, with a 24-hour trading volume of $16,610. The token has experienced a slight decline of 0.72% in the past 24 hours. However, it has shown positive momentum over the past week, with a 7.46% increase. The current market cap stands at $17,339,455, ranking STEP at 1166th position in the overall cryptocurrency market.
STEP's circulating supply is 318,038,432.6610835 tokens, which represents 50.47% of its total supply of 329,999,054.1257851. The fully diluted market cap is calculated at $34,353,422. Despite the recent positive weekly performance, STEP is still down 12.11% over the past 30 days, indicating some volatility in its medium-term price action.
The token is currently trading at 99.47% below its all-time high, suggesting significant room for potential growth if market conditions improve. The year-to-date performance shows a 22.86% increase, indicating a general upward trend in 2025 despite short-term fluctuations.
Click to view the current STEP market price
STEP Market Sentiment Indicator
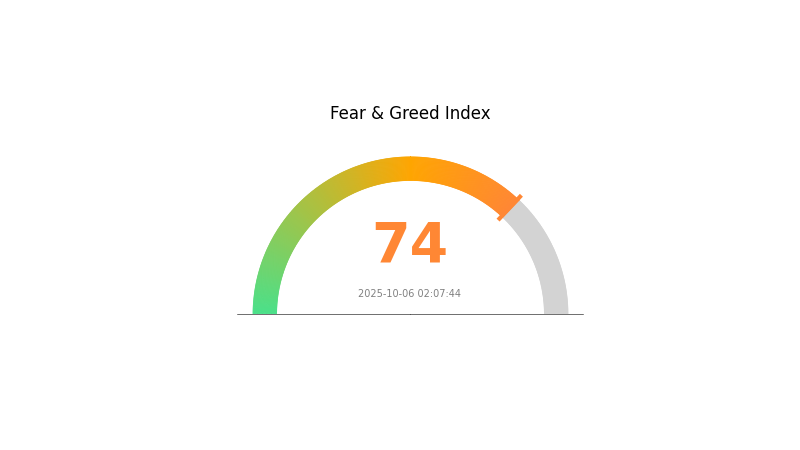
2025-10-06 Fear and Greed Index: 74 (Greed)
Click to view the current Fear & Greed Index
The crypto market is showing strong signs of greed, with the Fear and Greed Index reaching 74. This high level of greed suggests that investors are becoming increasingly optimistic about the market's prospects. However, it's important to remember that extreme greed can often precede market corrections. Traders should exercise caution and consider taking profits or implementing risk management strategies. As always, it's crucial to conduct thorough research and make informed decisions based on your own risk tolerance and investment goals.
STEP Holdings Distribution
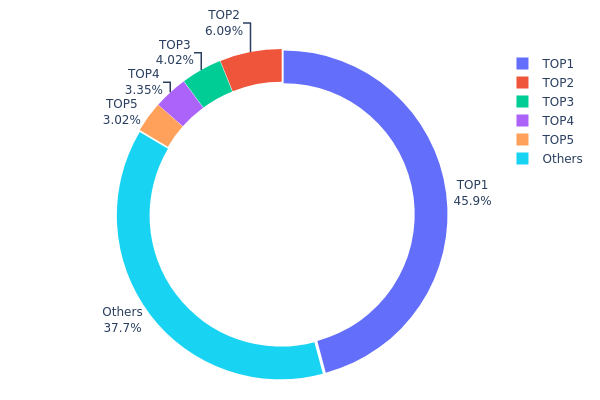
The address holdings distribution data reveals a significant concentration of STEP tokens. The top address holds an overwhelming 45.85% of the total supply, indicating a highly centralized ownership structure. This is followed by four addresses holding between 3% to 6% each, collectively accounting for 16.46% of the supply. The remaining 37.69% is distributed among other addresses.
This concentration pattern raises concerns about the token's decentralization and potential market vulnerabilities. With nearly half of the supply controlled by a single entity, there's a risk of market manipulation and increased volatility. The top holder could significantly influence price movements through large-scale buying or selling actions. Moreover, this centralization may impact governance decisions if STEP employs a token-based voting system.
While some level of concentration is common in many cryptocurrencies, STEP's current distribution suggests a need for increased diversification to enhance market stability and reduce manipulation risks. The high concentration in few hands could potentially deter new investors concerned about fair market practices and long-term sustainability.
Click to view the current STEP Holdings Distribution
| Top | Address | Holding Qty | Holding (%) |
|---|---|---|---|
| 1 | ANYxxG...9ABQJi | 151334.08K | 45.85% |
| 2 | HRr8EW...xWV7Jy | 20111.64K | 6.09% |
| 3 | DwQMju...doQStu | 13259.76K | 4.01% |
| 4 | FgpgcK...DznF4e | 11051.00K | 3.34% |
| 5 | EW3LJU...NXcSbk | 9982.00K | 3.02% |
| - | Others | 124260.58K | 37.69% |
II. Key Factors Influencing STEP's Future Price
Supply Mechanism
- Historical Patterns: Past supply changes have shown to impact price movements.
- Current Impact: The expected supply changes are likely to influence future price trends.
Institutional and Whale Dynamics
- Institutional Holdings: Major institutions' positions in STEP can affect market sentiment and price.
- Corporate Adoption: Companies adopting STEP technology may boost its value proposition.
- Government Policies: National-level policies related to cryptocurrencies can significantly impact STEP's price.
Macroeconomic Environment
- Monetary Policy Impact: Expected policies of major central banks may influence STEP's attractiveness as an investment.
- Inflation Hedging Properties: STEP's performance in inflationary environments could affect its demand.
- Geopolitical Factors: International geopolitical situations may impact STEP's perceived value and adoption.
Technical Development and Ecosystem Building
- Ecosystem Applications: Major DApps and ecosystem projects built on STEP can drive its utility and demand.
III. STEP Price Prediction for 2025-2030
2025 Outlook
- Conservative prediction: $0.04798 - $0.05452
- Neutral prediction: $0.05452 - $0.06024
- Optimistic prediction: $0.06024 - $0.06597 (requires favorable market conditions)
2027-2028 Outlook
- Market phase expectation: Potential growth and consolidation period
- Price range forecast:
- 2027: $0.03928 - $0.07656
- 2028: $0.05439 - $0.07514
- Key catalysts: Increased adoption, technological advancements, and overall crypto market trends
2030 Long-term Outlook
- Base scenario: $0.07335 - $0.08215 (assuming steady market growth)
- Optimistic scenario: $0.08215 - $0.11995 (assuming strong adoption and favorable market conditions)
- Transformative scenario: $0.11995+ (assuming breakthrough use cases and mass adoption)
- 2030-12-31: STEP $0.11995 (potential peak price for the year)
| 年份 | 预测最高价 | 预测平均价格 | 预测最低价 | 涨跌幅 |
|---|---|---|---|---|
| 2025 | 0.06597 | 0.05452 | 0.04798 | 0 |
| 2026 | 0.0729 | 0.06024 | 0.0482 | 10 |
| 2027 | 0.07656 | 0.06657 | 0.03928 | 22 |
| 2028 | 0.07514 | 0.07156 | 0.05439 | 31 |
| 2029 | 0.09096 | 0.07335 | 0.06822 | 34 |
| 2030 | 0.11995 | 0.08215 | 0.05176 | 50 |
IV. STEP Professional Investment Strategies and Risk Management
STEP Investment Methodology
(1) Long-term Holding Strategy
- Target investors: Risk-tolerant investors with a long-term perspective
- Operation suggestions:
- Accumulate STEP tokens during market dips
- Set price targets and rebalance portfolio periodically
- Store tokens in secure wallets with private key control
(2) Active Trading Strategy
- Technical analysis tools:
- Moving Averages: Use to identify trends and potential reversal points
- Relative Strength Index (RSI): Monitor overbought/oversold conditions
- Key points for swing trading:
- Set strict stop-loss orders to limit potential losses
- Take profits at predetermined levels to secure gains
STEP Risk Management Framework
(1) Asset Allocation Principles
- Conservative investors: 1-3% of crypto portfolio
- Aggressive investors: 5-10% of crypto portfolio
- Professional investors: Up to 15% of crypto portfolio
(2) Risk Hedging Solutions
- Diversification: Spread investments across multiple cryptocurrencies
- Stop-loss orders: Implement to limit potential losses
(3) Secure Storage Solutions
- Hot wallet recommendation: Gate Web3 Wallet
- Cold storage solution: Hardware wallets for long-term holdings
- Security precautions: Use two-factor authentication, regular security audits
V. Potential Risks and Challenges for STEP
STEP Market Risks
- Volatility: Extreme price fluctuations common in cryptocurrency markets
- Liquidity: Potential difficulties in executing large trades without affecting price
- Competition: Emerging projects in the DeFi space may impact STEP's market share
STEP Regulatory Risks
- Regulatory uncertainty: Changing government policies may affect STEP's operations
- Compliance requirements: Potential need for additional licensing or reporting
- Cross-border restrictions: Varying regulations across jurisdictions may limit adoption
STEP Technical Risks
- Smart contract vulnerabilities: Potential for exploits in the underlying code
- Scalability issues: Challenges in handling increased network load
- Interoperability: Difficulties in integrating with other blockchain networks
VI. Conclusion and Action Recommendations
STEP Investment Value Assessment
STEP offers potential long-term value as a DeFi portfolio visualization platform, but faces short-term risks from market volatility and regulatory uncertainties.
STEP Investment Recommendations
✅ Beginners: Start with small positions and focus on learning the technology ✅ Experienced investors: Consider dollar-cost averaging and set clear profit targets ✅ Institutional investors: Conduct thorough due diligence and consider OTC options
STEP Trading Participation Methods
- Spot trading: Purchase STEP tokens on Gate.com
- Staking: Participate in yield farming opportunities if available
- DeFi integration: Utilize STEP within the Step Finance ecosystem for additional utility
Cryptocurrency investments carry extremely high risks, and this article does not constitute investment advice. Investors should make decisions carefully based on their own risk tolerance and are advised to consult professional financial advisors. Never invest more than you can afford to lose.
FAQ
What is Pepe's price prediction for 2025?
Analysts predict PEPE will trade between $0.000014-$0.000020 in 2025 if meme sentiment improves. The market outlook remains bullish for meme coins.
What is the price target for step stock?
The average price target for StepStone Group stock is $68.71, with a high estimate of $84.00 based on analyst forecasts.
What price will Shiba Inu reach in 2030?
Analysts predict Shiba Inu could reach $0.00010 by 2030, based on market trends and ecosystem growth. This projection is speculative.
What crypto has the highest price prediction?
Bitcoin has the highest price prediction, with forecasts suggesting it could reach $140,652. Chainlink follows with a high prediction of $62.60.
Share
Content