2025 SMB Price Prediction: Analyzing Market Trends and Potential Growth Factors for Small and Medium Businesses
Introduction: SMB's Market Position and Investment Value
Social Master & Branch (SMB), as a pioneer in Web3 commerce and digital economy, has made significant strides since its inception. As of 2025, SMB's market capitalization has reached $670,121,779.20, with a circulating supply of approximately 6,972,000 tokens, and a price hovering around $0.59764. This asset, hailed as the "Web3 Commerce Innovator," is playing an increasingly crucial role in revolutionizing e-commerce and digital payments.
This article will comprehensively analyze SMB's price trends from 2025 to 2030, considering historical patterns, market supply and demand, ecosystem development, and macroeconomic factors, to provide investors with professional price predictions and practical investment strategies.
I. SMB Price History Review and Current Market Status
SMB Historical Price Evolution Trajectory
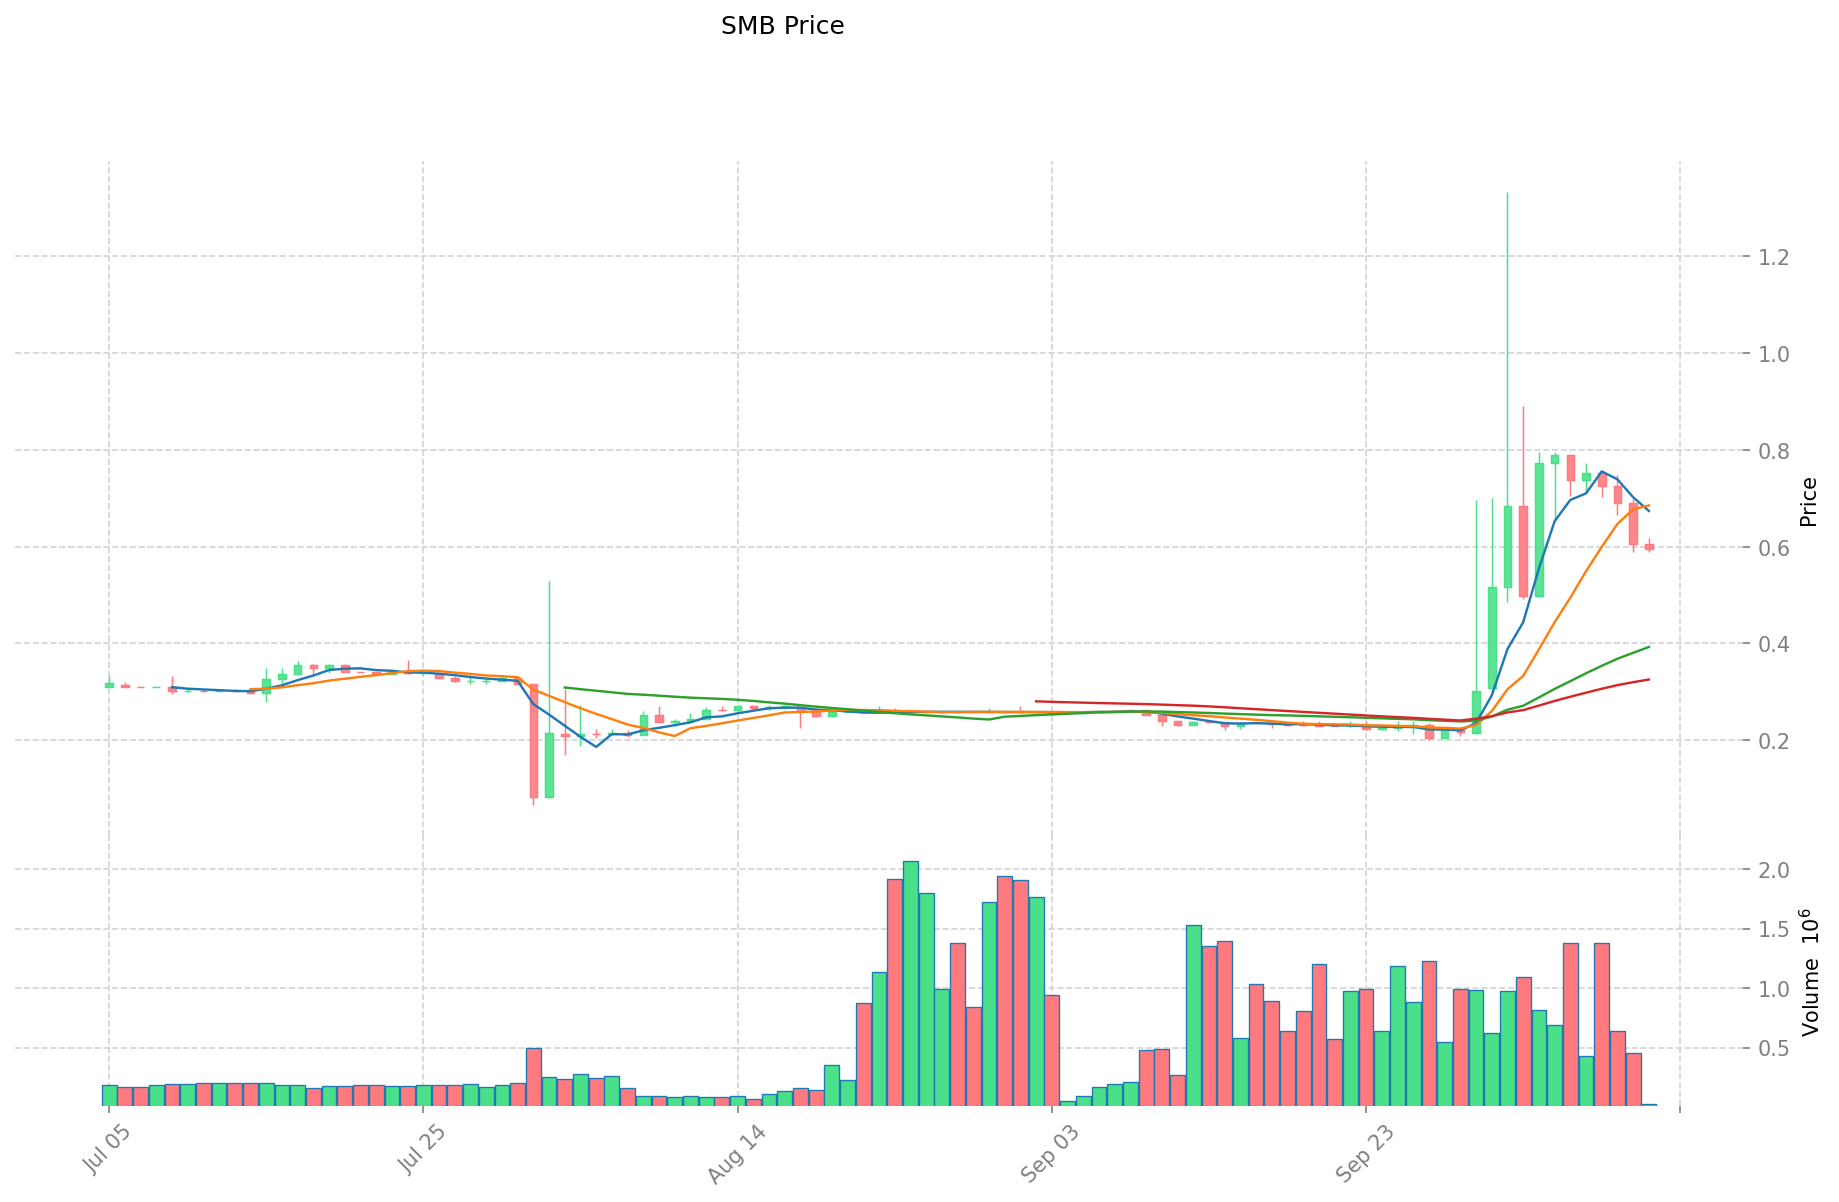
- 2025: SMB launched, price started at $0.07
- March 2025: SMB reached its all-time low of $0.02844
- October 2025: SMB hit its all-time high of $1.3332, followed by a correction
SMB Current Market Situation
As of October 12, 2025, SMB is trading at $0.59764, marking a 1.27% decrease in the last 24 hours. The token has experienced significant volatility, with a 15.09% decline over the past week. However, it has shown remarkable growth over the past month, with a 154.43% increase. SMB's current market cap stands at $4,166,746.08, ranking it at 1829 in the cryptocurrency market. The token's circulating supply is 6,972,000 SMB, which represents 0.62% of its total supply of 1,121,280,000 SMB. The fully diluted valuation of SMB is $670,121,779.20, indicating potential for growth if the entire supply enters circulation. The current market sentiment for SMB appears cautious, with the price hovering between its all-time high and all-time low.
Click to view the current SMB market price
SMB Market Sentiment Indicator
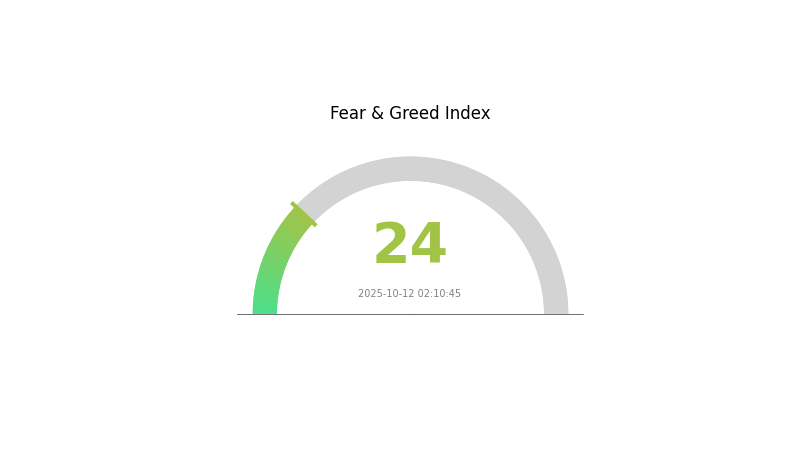
2025-10-12 Fear and Greed Index: 24 (Extreme Fear)
Click to view the current Fear & Greed Index
The crypto market is experiencing extreme fear, with the Fear and Greed Index plummeting to 24. This level of pessimism often signals a potential buying opportunity for contrarian investors. However, it's crucial to approach with caution and conduct thorough research. Historically, such extreme fear has preceded market rebounds, but past performance doesn't guarantee future results. Diversification and risk management remain key in navigating these turbulent waters. Stay informed and consider consulting with financial advisors before making any investment decisions.
SMB Holdings Distribution
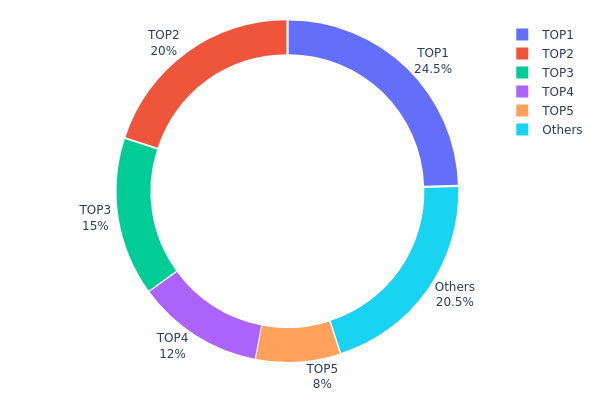
The address holdings distribution data reveals a highly concentrated ownership structure for SMB. The top five addresses collectively control 79.52% of the total supply, with the largest holder possessing 24.53%. This concentration level raises concerns about potential market manipulation and price volatility.
Such a concentrated distribution can significantly impact market dynamics. The top holders have substantial influence over price movements, potentially leading to increased volatility if large transactions occur. Additionally, this concentration may deter smaller investors due to perceived centralization risks. From a market structure perspective, the current distribution suggests a relatively low level of decentralization, which could be seen as contradictory to the principles of many blockchain projects.
The data indicates that SMB's on-chain structure stability heavily relies on the actions of a few key players. While this could provide some stability if major holders maintain their positions, it also introduces systemic risk should any of these addresses decide to liquidate their holdings. This concentration underscores the importance of monitoring large address movements for potential market impacts.
Click to view the current SMB Holdings Distribution
| Top | Address | Holding Qty | Holding (%) |
|---|---|---|---|
| 1 | 0xbe7d...fe3dab | 275095.89K | 24.53% |
| 2 | 0xfbb6...7aa2cf | 224256.00K | 20.00% |
| 3 | 0x8671...ed468b | 168086.88K | 14.99% |
| 4 | 0xb1b5...81158a | 134553.60K | 12.00% |
| 5 | 0xddfe...aaf192 | 89702.40K | 8.00% |
| - | Others | 229585.23K | 20.48% |
II. Key Factors Influencing Future SMB Prices
Supply Mechanism
- Market Factor (MKT): Reflects the overall market returns
- Size Factor (SMB): Represents the return difference between small-cap and large-cap companies
- Value Factor (HML): Indicates the return difference between high book-to-market value companies and low book-to-market value companies
Macroeconomic Environment
- Monetary Policy Impact: Changes in monetary cycles affect asset prices through dividend yields, growth rates, and discount rates
- Liquidity Effects: Expansionary monetary policy tends to increase market liquidity, influencing stock prices
Technical Development and Ecosystem Building
- Risk Factor Exposure: Isolated (iso) and non-cross-isolated (nis-c) double-sorted portfolios show significant exposure to SMB and UMD factors
III. SMB Price Prediction for 2025-2030
2025 Outlook
- Conservative prediction: $0.55554 - $0.59736
- Neutral prediction: $0.59736 - $0.68099
- Optimistic prediction: $0.68099 - $0.76462 (requires favorable market conditions)
2027-2028 Outlook
- Market stage expectation: Potential growth phase
- Price range forecast:
- 2027: $0.73125 - $1.0125
- 2028: $0.58114 - $1.35297
- Key catalysts: Increasing adoption and technological advancements
2030 Long-term Outlook
- Base scenario: $1.15125 - $1.2379 (assuming steady market growth)
- Optimistic scenario: $1.2379 - $1.78257 (assuming strong market performance)
- Transformative scenario: Above $1.78257 (extreme favorable conditions)
- 2030-12-31: SMB $1.78257 (potential peak)
| 年份 | 预测最高价 | 预测平均价格 | 预测最低价 | 涨跌幅 |
|---|---|---|---|---|
| 2025 | 0.76462 | 0.59736 | 0.55554 | 0 |
| 2026 | 0.92615 | 0.68099 | 0.62651 | 13 |
| 2027 | 1.0125 | 0.80357 | 0.73125 | 34 |
| 2028 | 1.35297 | 0.90803 | 0.58114 | 51 |
| 2029 | 1.3453 | 1.1305 | 0.73483 | 89 |
| 2030 | 1.78257 | 1.2379 | 1.15125 | 107 |
IV. SMB Professional Investment Strategies and Risk Management
SMB Investment Methodology
(1) Long-term Holding Strategy
- Suitable for: Conservative investors seeking exposure to Web3 commerce
- Operational advice:
- Accumulate SMB tokens during market dips
- Set price targets for partial profit-taking
- Store tokens in a secure non-custodial wallet
(2) Active Trading Strategy
- Technical analysis tools:
- Moving Averages: Monitor short-term and long-term trends
- RSI: Identify overbought and oversold conditions
- Key points for swing trading:
- Use stop-loss orders to limit potential losses
- Take profits at predetermined resistance levels
SMB Risk Management Framework
(1) Asset Allocation Principles
- Conservative investors: 1-3% of crypto portfolio
- Aggressive investors: 5-10% of crypto portfolio
- Professional investors: Up to 15% of crypto portfolio
(2) Risk Hedging Solutions
- Diversification: Spread investments across multiple Web3 projects
- Use of stablecoins: Convert a portion of profits to stablecoins during market highs
(3) Secure Storage Solutions
- Non-custodial wallet recommendation: Gate Web3 Wallet
- Hardware wallet option: Cold storage for long-term holdings
- Security precautions: Enable two-factor authentication, use strong passwords
V. Potential Risks and Challenges for SMB
SMB Market Risks
- Volatility: Significant price fluctuations common in emerging crypto projects
- Liquidity: Limited trading volume may impact ease of buying/selling
- Competition: Other Web3 commerce projects may gain market share
SMB Regulatory Risks
- Unclear regulations: Potential for regulatory changes affecting Web3 commerce
- Cross-border transactions: Varying legal frameworks in different jurisdictions
- Token classification: Possibility of SMB being classified as a security
SMB Technical Risks
- Smart contract vulnerabilities: Potential for exploits in the underlying code
- Scalability challenges: Ability to handle increased transaction volume
- Interoperability issues: Compatibility with other blockchain networks
VI. Conclusion and Action Recommendations
SMB Investment Value Assessment
SMB presents a unique opportunity in the Web3 commerce space, with potential for long-term growth. However, investors should be aware of the high volatility and regulatory uncertainties in the short term.
SMB Investment Recommendations
✅ Beginners: Start with small positions, focus on learning about Web3 commerce
✅ Experienced investors: Consider a balanced approach with regular profit-taking
✅ Institutional investors: Conduct thorough due diligence and consider OTC options
SMB Trading Participation Methods
- Spot trading: Purchase SMB tokens on Gate.com
- Staking: Participate in staking programs if available
- DeFi integration: Explore decentralized finance options using SMB tokens
Cryptocurrency investments carry extremely high risks, and this article does not constitute investment advice. Investors should make decisions carefully based on their own risk tolerance and are advised to consult professional financial advisors. Never invest more than you can afford to lose.
FAQ
Will the hamster coin price go up?
Yes, the hamster coin price is expected to rise. Forecasts suggest it could reach $0.093973 by November 8, 2025, with long-term predictions indicating a potential increase to $0.095464.
What is the stock price prediction for Samsung in 2025?
Analysts predict Samsung's stock price to reach an average target of KRW85,680 in 2025, suggesting a potential upside of 13.63% based on current estimates.
What crypto has the highest price prediction?
Bitcoin has the highest price prediction, forecasted to reach $139,249. Chainlink follows with a predicted peak of $59.67.
Which AI is best for stock price prediction?
The GARCH-LSTM model is widely considered one of the best AIs for stock price prediction, combining statistical analysis with deep learning capabilities.
Share
Content