2025 RENDER Fiyat Tahmini: Merkeziyetsiz Bulut Bilişim Ekosisteminde Piyasa Trendleri ve Büyüme Potansiyelinin Analizi

Giriş: RENDER’ın Piyasadaki Konumu ve Yatırım Değeri
Merkeziyetsiz bir GPU render platformu olan Render Network (RENDER), kuruluşundan bu yana 3D render ve GPU’ya dayalı uygulamalar alanında önemli ilerlemeler kaydetmiştir. 2025 yılı itibarıyla, RENDER’ın piyasa değeri 1.989.809.172 $’a ulaşmış, yaklaşık 518.584.616 adet token dolaşımdadır ve fiyatı 3,837 $ seviyelerinde işlem görmektedir. “GPU render devrimcisi” olarak anılan bu varlık, 3D render, görsel efektler ve yeni nesil GPU temelli teknolojilerin geliştirilmesinde giderek daha kritik bir konumda bulunuyor.
Bu makalede, 2025 ile 2030 yılları arasında RENDER fiyatının tarihsel eğilimleri, piyasa arz-talep dengesi, ekosistem gelişimi ve makroekonomik faktörler ışığında detaylı bir şekilde incelenecek; uzman fiyat tahminleri ile yatırımcılara pratik yatırım stratejileri sunulacaktır.
I. RENDER Fiyat Geçmişi ve Mevcut Piyasa Durumu
RENDER Tarihsel Fiyat Gelişimi
- 2020: RENDER piyasaya sürüldü ve fiyatı 0,036763626053 $’dan başladı.
- 2024: RENDER, 18 Mart’ta tüm zamanların en yüksek seviyesi olan 13,596115966188627 $’a ulaştı.
- 2025: Fiyat dengelenerek şu an 3,837 $ seviyesinde işlem görüyor.
RENDER Mevcut Piyasa Durumu
10 Eylül 2025 itibarıyla RENDER, 3,837 $ seviyesinden işlem görüyor ve piyasa değeri bakımından 70. sırada yer alıyor. Son 24 saatte %3,2’lik bir düşüş kaydeden tokenin işlem hacmi 2.209.121,50827 $’dır. RENDER’ın piyasa değeri 1.989.809.172,22 $’a ulaşırken, dolaşımdaki arzı 518.584.616,16 adettir. Güncel fiyat, tüm zamanların en yüksek değerine göre önemli bir düşüş gösterse de, ilk listeleme fiyatına kıyasla %14.348 oranında bir artış korunmaktadır. Son bir haftada %12’lik bir artış yaşanırken, son 30 günde %3,35 ve son bir yılda %25,75 düşüş görülmekte olup, piyasa genelindeki duyarlılık şu anda nötrdür.
Güncel RENDER piyasa fiyatı için tıklayınız
RENDER Piyasa Duyarlılık Göstergesi
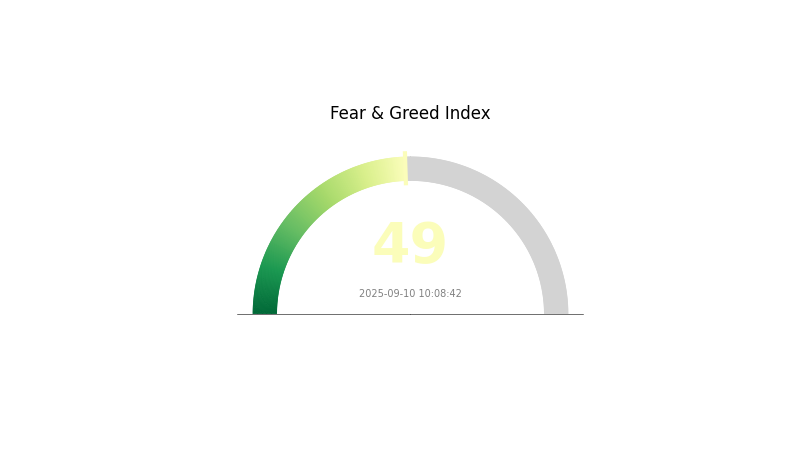
10 Eylül 2025 Korku ve Açgözlülük Endeksi: 49 (Nötr)
Güncel Korku ve Açgözlülük Endeksi’ni görmek için tıklayınız
Kripto piyasasında duyarlılık bugün dengede; Korku ve Açgözlülük Endeksi’nin 49 seviyesinde olması piyasada nötr bir hava hakim olduğunu gösteriyor. Yatırımcılar aşırı korku veya açgözlülükten kaçınmaktadır. Her ne kadar piyasada bir ihtiyat duygusu olsa da, aynı zamanda ölçülü bir iyimserlik de mevcut. Piyasa koşullarının hızla değişebileceği göz önünde bulundurulmalı ve yatırımcılar dikkatli olmalıdır. Gate.com, bu piyasa dinamiklerinde yolunuzu bulabilmeniz için kapsamlı araçlar sunar. Karar vermeden önce piyasayı titizlikle araştırmanız önerilir.
RENDER Varlık Dağılımı
RENDER tokenlarının adres bazında dağılımı, varlıkların belirli adreslerde yoğunlaştığını gösteriyor. En büyük adres toplam arzın %19,87’sini elinde tutarken, en büyük 5 adresin sahip olduğu toplam pay %41,21’e ulaşıyor. Bu seviyede yoğunlaşma, potansiyel piyasa manipülasyonu ve fiyat oynaklığı riskini artırıyor.
İkinci ve üçüncü en büyük sahipler ise sırasıyla %9,67 ve %5,58 oranında paya sahip. Buna karşın, ilk 5 adres dışındaki adreslerin elinde toplam tokenların %58,79’u bulunmakta ve dağılımın belirli ölçüde geniş yatırıcı tabanına yayıldığını gösteriyor. Büyük yatırımcılar ile küçük ölçekli yatırımcılar arasındaki bu denge, piyasada belli bir stabilite sağlayabilir, fakat büyük yatırımcıların etkisi RENDER’ın zincir üstü dinamiklerinde ve fiyat hareketlerinde belirleyici bir unsur olmaya devam etmektedir.
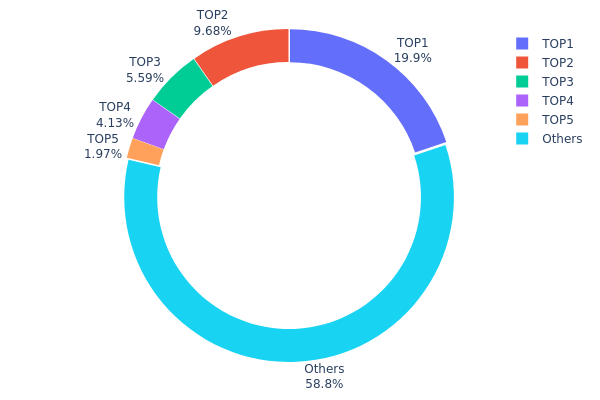
| Sıra | Adres | Varlık Miktarı | Varlık (%) |
|---|---|---|---|
| 1 | AZB72t...m2qAdC | 88.951,39K | 19,87% |
| 2 | 9WzDXw...YtAWWM | 43.324,40K | 9,67% |
| 3 | CPj5Jg...SXKrvv | 25.000,04K | 5,58% |
| 4 | 3gd3dq...hCkW2u | 18.504,25K | 4,13% |
| 5 | 51PZFs...tBqZk1 | 8.797,07K | 1,96% |
| - | Diğerleri | 263.029,80K | 58,79% |
II. RENDER’ın Gelecekteki Fiyatını Etkileyecek Temel Unsurlar
Arz Mekanizması
- Token Geçişi: Render, Polygon’dan Solana ekosistemine geçiş gerçekleştiriyor ve eski tokenlar yeni RENDER tokenlarına yükseltiliyor.
- Güncel Etki: Bu geçiş, token arzı ve dağılımını etkileyerek fiyat üzerinde önemli rol oynayabilir.
Kurumsal ve Büyük Yatırımcı Dinamikleri
- Kurumsal Benimseme: Yapay zeka, 3D içerik üretimi ve metaverse uygulamalarına olan talebin artması GPU render ihtiyacını yükseltirken RENDER’ın değerini pozitif etkiliyor.
Makroekonomik Ortam
- Enflasyona Karşı Koruma: RENDER, kripto para birimi olarak belirli ekonomik şartlarda enflasyona karşı koruma potansiyeli taşıyabilir.
Teknolojik Gelişim ve Ekosistem Oluşumu
- Solana’ya Geçiş: Polygon’dan Solana ekosistemine geçiş, ölçeklenebilirliği ve performansı iyileştirebilir.
- Ekosistem Uygulamaları: Render Network, atıl GPU kaynaklarıyla çalışan merkeziyetsiz render çözümleri sunarak sanatçılara, tasarımcılara ve mühendislere hizmet sunar.
III. RENDER Fiyat Tahmini 2025-2030
2025 Görünümü
- Ihtiyatlı tahmin: 2,90 – 3,82 $
- Nötr tahmin: 3,82 – 4,75 $
- İyimser tahmin: 4,75 – 5,69 $ (güçlü piyasa toparlanması gerektirir)
2027 Orta Vadeli Görünüm
- Piyasa dönemi beklentisi: Potansiyel büyüme evresi
- Fiyat aralığı tahmini:
- 2026: 4,56 – 5,04 $
- 2027: 4,26 – 5,29 $
- Başlıca tetikleyiciler: Render teknolojilerinin daha fazla benimsenmesi, piyasa toparlanması
2030 Uzun Vadeli Görünüm
- Temel senaryo: 5,21 – 6,04 $ (istikrarlı piyasa büyümesi varsayımıyla)
- İyimser senaryo: 6,04 – 7,80 $ (artarak hızlanan benimseme ve olumlu piyasa koşulları durumunda)
- Dönüştürücü senaryo: 7,80 $ ve üzeri (çok elverişli koşullarda ve yaygın sektör entegrasyonunda)
- 31 Aralık 2030: RENDER için 7,80 $ (potansiyel zirve, piyasa dinamiklerine bağlıdır)
| Yıl | Tahmini En Yüksek Fiyat | Tahmini Ortalama Fiyat | Tahmini En Düşük Fiyat | Değişim (%) |
|---|---|---|---|---|
| 2025 | 5,69478 | 3,822 | 2,90472 | 0 |
| 2026 | 5,04389 | 4,75839 | 4,56805 | 24 |
| 2027 | 5,29323 | 4,90114 | 4,26399 | 27 |
| 2028 | 6,37148 | 5,09719 | 3,00734 | 33 |
| 2029 | 6,36511 | 5,73434 | 5,21825 | 49 |
| 2030 | 7,80414 | 6,04972 | 3,20635 | 57 |
IV. Profesyonel RENDER Yatırım Stratejileri ve Risk Yönetimi
RENDER Yatırım Yaklaşımları
(1) Uzun Vadeli Tutma Stratejisi
- Kime uygun: Yüksek risk toleransına sahip, blockchain teknolojisinin geleceğine inanan yatırımcılar
- Uygulama önerileri:
- Fiyat düşüşlerinde RENDER token biriktirin
- Kademeli kâr realizasyonu için fiyat hedefleri koyun
- Token’larınızı güvenli cüzdanlarda, özel anahtar kontrolünde saklayın
(2) Aktif Alım-Satım Stratejisi
- Teknik analiz araçları:
- Hareketli Ortalamalar: Trend yönü ve olası dönüş noktalarını belirleyin
- Göreceli Güç Endeksi (RSI): Aşırı alım ya da satım bölgelerini tespit edin
- Swing trade için dikkat edilmesi gerekenler:
- Fiyat hareketlerinin teyidi için işlem hacmini takip edin
- Potansiyel zararları sınırlamak amacıyla zarar durdur emirleri kullanın
RENDER Risk Yönetimi Çerçevesi
(1) Varlık Dağılımı İlkeleri
- Düşük riskli yatırımcılar: Kripto portföyünüzün %1-3’ü
- Daha agresif yatırımcılar: Kripto portföyünüzün %5-10’u
- Profesyonel yatırımcılar: Kripto portföyünüzün %15’ine kadar
(2) Riski Azaltma Çözümleri
- Diversifikasyon: Yatırımlarınızı birden fazla kripto varlık arasında çeşitlendirin
- Zarar durdur emirleri: Zararı sınırlamak için mutlaka kullanın
(3) Güvenli Saklama Yöntemleri
- Sıcak cüzdan önerisi: Gate Web3 Wallet
- Soğuk depolama: Uzun vadeli saklama için donanım cüzdanları tercih edin
- Güvenlik önlemleri: İki faktörlü kimlik doğrulama kullanın ve güçlü, benzersiz şifreler oluşturun
V. RENDER İçin Potansiyel Riskler ve Zorluklar
RENDER Piyasa Riskleri
- Volatilite: Kripto piyasalarında fiyatlar oldukça oynaktır
- Likidite: Yüksek miktarda alım-satımda zaman zaman zorluk yaşanabilir
- Rekabet: Merkeziyetsiz GPU render alanındaki yeni projelerle rekabet
RENDER Düzenleyici Riskleri
- Bilinmez düzenlemeler: Yasal düzenlemelerin sıkılaşma ihtimali
- Vergilendirme: Kripto varlıklara yönelik mevzuatın değişebilir olması
- Sınır ötesi kısıtlamalar: Uluslararası transferlerde yeni kısıtların getirilmesi
RENDER Teknik Riskler
- Ağ güvenliği: Solana blok zincirinde olası güvenlik açıkları
- Akıllı sözleşme riskleri: Token sözleşmelerinde potansiyel hata veya açıklar
- Ölçeklenebilirlik: Talep arttıkça ağın yeterli performansı gösterebilme kabiliyeti
VI. Sonuç ve Eylem Önerileri
RENDER Yatırım Değeri Analizi
RENDER, merkeziyetsiz GPU render pazarındaki büyüme potansiyeli ile uzun vadeli değer vadederken; piyasa dalgalanmaları ve düzenleyici belirsizlikler nedeniyle kısa vadede endişeler barındırmaktadır.
RENDER Yatırım Tavsiyeleri
✅ Yeni başlayanlar: Piyasayı anlamak için küçük ve düzenli yatırımlarla başlayın
✅ Deneyimli yatırımcılar: Hem uzun vadeli tutum hem de aktif alım-satım ile dengeli bir strateji uygulayın
✅ Kurumsal yatırımcılar: Kapsamlı analiz yaparak RENDER’ı çeşitlendirilmiş bir kripto portföyünde değerlendirin
RENDER Alım Satıma Katılım Yöntemleri
- Spot işlemler: Gate.com üzerinden doğrudan RENDER alım-satımı
- Staking: Varsa staking programlarına katılarak ek gelir elde etme
- DeFi: RENDER tokenları için merkeziyetsiz finans platformlarında likidite sağlama gibi fırsatları değerlendirme
Kripto para yatırımları çok yüksek risk içerir; bu makale yatırım tavsiyesi değildir. Yatırım kararlarınızı kendi risk toleransınıza göre dikkatlice veriniz ve gerekiyorsa profesyonel finansal danışmanlık alınız. Kaybetmeyi göze alabileceğinizden fazla yatırım yapmayınız.
Sıkça Sorulan Sorular (SSS)
RENDER 100 $’a ulaşır mı?
Bu teorik olarak mümkün olsa da, 100 $ seviyesine ulaşılması için RENDER teknolojisinin yaygın olarak benimsenmesi ve ciddi piyasa büyümesi gerekir. Uzun vadeli bir hedef olarak yüksek olsa da, tamamen olanaksız değildir.
RENDER 2025’te maksimum ne kadar yükselebilir?
Mevcut piyasa analizlerine göre, RENDER 2025 yılında 4,10 $ seviyesine kadar ulaşabilir; ortalama fiyat tahmini ise 3,84 $’dır.
RENDER 20 $’a ulaşabilir mi?
Evet, RENDER uygun piyasa koşullarında ve merkeziyetsiz render hizmetlerine artan taleple 2025’e kadar 20 $ seviyesine çıkabilir. Bu hedef iddialı olsa da, piyasadaki talep ve RENDER’ın eşsiz konumu göz önüne alındığında imkânsız değildir.
RENDER’ın 2030 için fiyat öngörüsü nedir?
Uzun vadeli öngörüler, RENDER’ın 2030 yılında 2,24 $ ile 9,59 $ aralığında işlem göreceğini ve ortalama fiyatın 5,90 $ seviyesinde olacağını göstermektedir.
Share
Content
Giriş: RENDER’ın Piyasadaki Konumu ve Yatırım Değeri
I. RENDER Fiyat Geçmişi ve Mevcut Piyasa Durumu
II. RENDER’ın Gelecekteki Fiyatını Etkileyecek Temel Unsurlar
III. RENDER Fiyat Tahmini 2025-2030
IV. Profesyonel RENDER Yatırım Stratejileri ve Risk Yönetimi
V. RENDER İçin Potansiyel Riskler ve Zorluklar
VI. Sonuç ve Eylem Önerileri
Sıkça Sorulan Sorular (SSS)
How to Buy Cryptocurrency


Trending Cryptocurrencies


Hedera (HBAR) 2025 Fiyat Analizi ve Yatırım Olanakları

Sui Fiyat Pazar Analizi ve 2025'te Uzun Vadeli Yatırım Potansiyeli

Amerika Partisi: White Paper Mantığı ve Gelecek Etkisi Üzerine Temel Analiz

Lark Davis Vs ZachXBT

2025 TIA Fiyat Tahmini: Celestia Token’ın Piyasa Trendleri ve Büyüme Potansiyelinin Analizi
Elon Musk'ın Doğum Günü ve Astrolojisi
NFT Nadirliği Hakkında Bilgi: Nadirlik Skorları Nasıl Hesaplanır

Testnet ortamında, kolayca erişilebilen musluk ile ücretsiz MATIC token talep edin
Blockchain Düğümlerinin İşleyişini Anlamak
Flash Kredileri Anlamak: DeFi'de Teminatsız Borçlanma Üzerine Kapsamlı Bir Rehber
MetaMask ile ERC20 Token Yönetimi: Bir Rehber