2025 RARI Fiyat Tahmini: Dijital Varlık Sektöründe Gelecekteki Piyasa Potansiyeli ve Büyüme Dinamiklerinin Analizi

Giriş: RARI'nin Piyasadaki Konumu ve Yatırım Potansiyeli
Rarible (RARI), 2020'de piyasaya sürülen zincir üstü ticaret altyapısı için bir yönetişim tokenı olarak kayda değer ilerlemeler kaydetti. 2025 yılı itibarıyla RARI'nin piyasa değeri 15.554.011 ABD doları seviyesine ulaşırken, yaklaşık 18.121.882 adet dolaşımdaki token ve 0,8583 ABD doları civarında bir fiyat söz konusu. "NFT pazar yeri yönetişim tokenı" olarak anılan bu varlık, merkeziyetsiz dijital varlık ticareti ve yönetişimde giderek daha belirleyici bir rol üstleniyor.
Bu makalede, RARI'nin 2025-2030 dönemindeki fiyat hareketleri; tarihsel eğilimler, piyasa arz-talep dengesi, ekosistem büyümesi ve makroekonomik faktörler bazında kapsamlı şekilde analiz edilerek profesyonel fiyat tahminleri ve yatırımcılar için pratik stratejiler sunulmaktadır.
I. RARI Fiyat Geçmişi ve Güncel Piyasa Durumu
RARI Tarihsel Fiyat Seyri
- 2020: RARI Temmuz'da piyasaya sürüldü, ilk fiyatı 0,515277 ABD dolarıydı
- 2021: 30 Mart'ta tüm zamanların zirvesi olan 46,7 ABD dolarına ulaştı, güçlü bir boğa rallisi yaşandı
- 2022-2025: Uzun süren ayı piyasasında fiyat mevcut seviyelere geriledi
RARI Güncel Piyasa Durumu
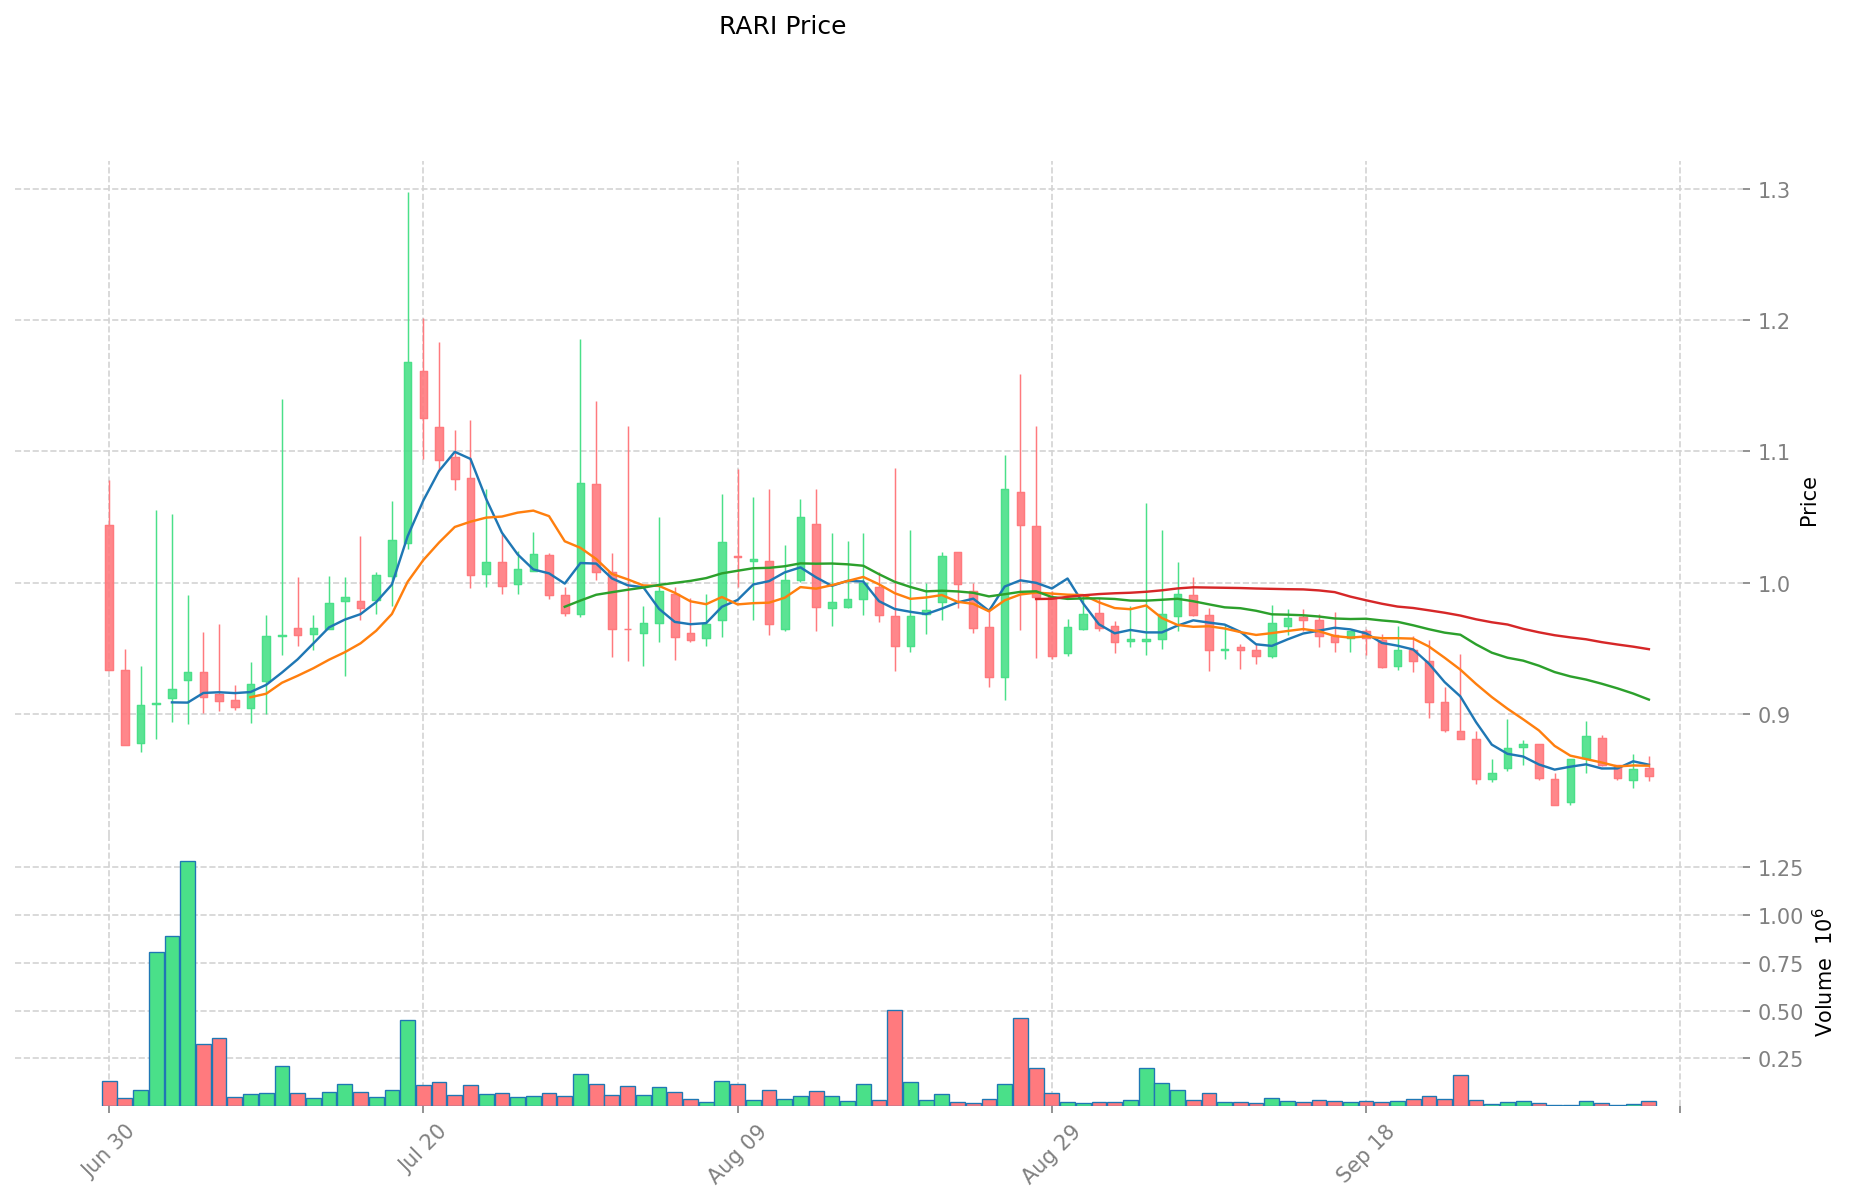
7 Ekim 2025 itibarıyla RARI'nin fiyatı 0,8583 ABD doları, 24 saatlik işlem hacmi ise 25.285,45 ABD doları. Son 24 saatte token fiyatında %0,26'lık hafif bir düşüş gerçekleşti. Piyasa değeri 15.554.011,55 ABD doları seviyesinde ve kripto para sıralamasında 1.227. sırada. Dolaşımdaki miktar 18.121.882,26 RARI olup, toplam arzın %72,46'sına denk (toplam arz: 25.009.551,72 RARI).
RARI'nin performansı dönemlere göre dalgalı bir seyir izliyor. Son bir haftada %1,35 artış yaşanırken, son 30 günde %13,29 düşüş ve son bir yılda %56,3 oranında değer kaybı söz konusu. Token, 30 Mart 2021'deki 46,7 ABD dolarlık zirve değerinin %98,16 altında işlem görüyor.
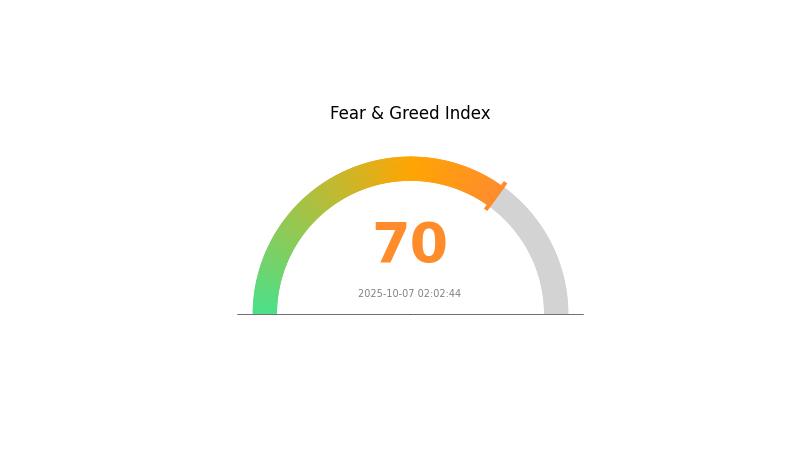
Market Emotion endeksine göre RARI için güncel piyasa hissiyatı "Açgözlülük" seviyesinde ve VIX puanı 70. Son fiyat düşüşlerine rağmen yatırımcı ilgisi halen yüksek.
Güncel RARI piyasa fiyatını görmek için tıklayın
RARI Piyasa Duyarlılık Göstergesi
2025-10-07 Korku ve Açgözlülük Endeksi: 70 (Açgözlülük)
Güncel Korku & Açgözlülük Endeksi'ni görmek için tıklayın
Kripto piyasasında aşırı iyimserlik hakim; Korku ve Açgözlülük Endeksi 70 ile açgözlülük durumunu gösteriyor. Yatırımcıların güveni artarken fiyatlar yükselebilir, ancak bu seviyede açgözlülük piyasanın aşırı ısındığına dair uyarıcı bir sinyal de olabilir. Yatırımcılar, olası bir düzeltmeye karşı temkinli olmalı ve mevcut yükseliş havasına kapılmadan dengeli bir yaklaşım benimsemelidir.
RARI Varlık Dağılımı
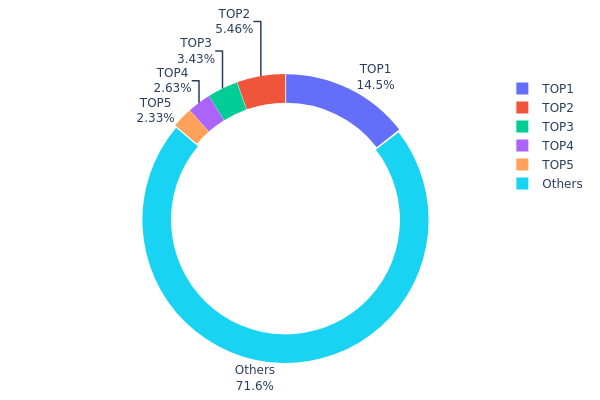
RARI adres varlık dağılımı tablosu, üst düzey sahipler arasında orta seviyede bir yoğunlaşma olduğunu gösteriyor. En büyük adres toplam arzın %14,51'ini elinde bulundururken, ilk 5 adres toplamda %28,34'lük paya sahip. Bu dağılım, dikkat çekici ancak aşırıya kaçmayan bir merkezileşmeye işaret eder.
Mevcut yoğunlaşma, RARI için dengeli bir piyasa yapısı sunuyor. En büyük sahip etkili olsa da, diğer büyük sahiplerin ve küçük adreslerin elindeki %71,66'lık pay mülkiyeti çeşitlendirerek aşırı fiyat dalgalanmasını ve tek bir adresin piyasayı manipüle etme riskini azaltıyor.
Genel olarak, RARI'nin varlık dağılımı merkeziyetsizliğin orta düzeyde olduğunu gösteriyor. Birden fazla önemli adresin varlığı ve küçük adreslerin tuttuğu yüksek pay zincir üstü yapıda istikrar sağlıyor. Yatırımcılar yine de büyük sahiplerin piyasa üzerindeki olası etkilerini göz önünde bulundurmalı.
Güncel RARI Varlık Dağılımı'nı görmek için tıklayın
| Top | Address | Holding Qty | Holding (%) |
|---|---|---|---|
| 1 | 0x7e9c...42cbc5 | 3.628,27K | 14,51% |
| 2 | 0x47e3...7f139c | 1.364,22K | 5,45% |
| 3 | 0x453f...5cdcfd | 858,69K | 3,43% |
| 4 | 0x1cf0...39e18a | 657,99K | 2,63% |
| 5 | 0x8ce0...56fe78 | 582,13K | 2,32% |
| - | Others | 17.908,70K | 71,66% |
II. RARI'nin Gelecekteki Fiyatını Etkileyen Temel Unsurlar
Arz Mekanizması
- Piyasa Likidite Madenciliği: RARI tokenları, Rarible platformunda NFT alım-satımı yapan kullanıcılara dağıtılarak işlem hacmi teşvik ediliyor.
- Tarihsel Durum: Başlangıçta likidite madenciliği mekanizması kullanıcı çekimini ve işlem hacmini artırdı ancak wash trading sorunlarına yol açtı.
- Mevcut Etki: Ekip, piyasadaki likidite madenciliği payını azaltmak ve wash trading'i önlemek için RARI staking uygulamasını devreye alabilir; bu da token arz dinamiklerini değiştirebilir.
Kurumsal ve Büyük Yatırımcı Hareketleri
- Kurumsal Varlıklar: Mayıs 2021 itibarıyla en büyük 100 adres RARI tokenlarının %91,76'sını elinde bulunduruyor; bu da büyük sahipler arasında yoğunlaşma olduğunu gösteriyor.
Makroekonomik Ortam
- Enflasyona Karşı Koruma Özellikleri: NFT platform tokenı olarak RARI, daha çok spekülatif bir varlık sayılır ve genel piyasa duyarlılığına karşı oldukça hassastır.
Teknolojik Gelişim ve Ekosistem İnşası
- NFT + DeFi Entegrasyonu: Rarible, NFT'leri DeFi ile birleştirme konusunda öncü; Yearn'ın yInsure'u, Uniswap v3 LP tokenları ve Hegic opsiyonlarıyla entegrasyon sağladı.
- Platform Güncellemeleri: Olası RARI staking uygulaması, tokenın kullanım alanı ve yönetişimdeki rolünü güçlendirebilir.
- Ekosistem Uygulamaları: Rarible, farklı NFT türlerini destekliyor ve NFT ile DeFi alanında iş birlikleriyle ekosistemini genişletiyor.
III. 2025-2030 Arası RARI Fiyat Tahmini
2025 Görünümü
- Temkinli tahmin: 0,62605 - 0,8576 ABD doları
- Tarafsız tahmin: 0,8576 - 0,90906 ABD doları
- İyimser tahmin: 0,90906 ABD doları (olumlu piyasa koşulları halinde)
2026-2028 Beklentisi
- Piyasa fazı: Kademeli büyüme ve artan benimseme
- Fiyat aralığı tahmini:
- 2026: 0,73316 - 1,25433 ABD doları
- 2027: 1,01539 - 1,51773 ABD doları
- 2028: 1,18982 - 1,70713 ABD doları
- Ana tetikleyiciler: Kullanım alanlarının çeşitlenmesi, teknolojik ilerleme ve genel piyasa toparlanması
2029-2030 Uzun Vadeli Beklenti
- Temel senaryo: 1,50021 - 1,67273 ABD doları (istikrarlı piyasa büyümesi varsayımıyla)
- İyimser senaryo: 1,84525 - 2,22473 ABD doları (güçlü piyasa performansı ve benimseme artışı ile)
- Dönüştürücü senaryo: 2,22473+ ABD doları (çok olumlu piyasa koşulları ve yenilikçi gelişmeler halinde)
- 2030-12-31: RARI 1,67273 ABD doları (mevcut projeksiyonlara göre ortalama fiyat)
| 年份 | 预测最高价 | 预测平均价格 | 预测最低价 | 涨跌幅 |
|---|---|---|---|---|
| 2025 | 0,90906 | 0,8576 | 0,62605 | 0 |
| 2026 | 1,25433 | 0,88333 | 0,73316 | 2 |
| 2027 | 1,51773 | 1,06883 | 1,01539 | 24 |
| 2028 | 1,70713 | 1,29328 | 1,18982 | 50 |
| 2029 | 1,84525 | 1,50021 | 1,4552 | 74 |
| 2030 | 2,22473 | 1,67273 | 0,86982 | 94 |
IV. RARI Yatırım Stratejileri ve Risk Yönetimi
RARI Yatırım Yaklaşımları
(1) Uzun Vadeli Tutma Stratejisi
- Uygun yatırımcı profili: NFT ve DeFi meraklıları, uzun vadeli kripto yatırımcıları
- Operasyon önerileri:
- Piyasa düşüşlerinde RARI biriktirin
- Rarible ekosistemi yönetişimine katılın
- Tokenları güvenli, saklama hizmeti olmayan cüzdanlarda saklayın
(2) Aktif Ticaret Stratejisi
- Teknik analiz araçları:
- Hareketli Ortalamalar: Kısa ve uzun vadeli fiyat trendlerini takip edin
- RSI (Göreli Güç Endeksi): Aşırı alım/aşırı satım noktalarını belirleyin
- Dönemsel al-sat için dikkat edilmesi gerekenler:
- Risk kontrolü için zarar durdur emirleri kullanın
- Belirlenmiş fiyat hedeflerinde kâr alın
RARI Risk Yönetimi Çerçevesi
(1) Varlık Dağılımı İlkeleri
- Temkinli yatırımcılar: Kripto portföyünün %1-3'ü
- Orta riskli yatırımcılar: Kripto portföyünün %3-5'i
- Agresif yatırımcılar: Kripto portföyünün %5-10'u
(2) Riskten Korunma Yöntemleri
- Diversifikasyon: RARI'yi farklı kripto varlıklarıyla dengeleyin
- Zarar durdur emirleri: Piyasa düşüşlerinde potansiyel kayıpları sınırlandırın
(3) Güvenli Saklama Çözümleri
- Sıcak cüzdan tavsiyesi: Gate web3 cüzdanı
- Soğuk saklama: Uzun vadeli tutum için donanım cüzdanı
- Güvenlik: İki faktörlü doğrulama etkinleştirin, güçlü şifreler kullanın
V. RARI için Olası Riskler ve Zorluklar
RARI Piyasa Riskleri
- Oynaklık: Kripto piyasasında sık rastlanan yüksek fiyat dalgalanması
- Likidite: Büyük hacimli işlemlerde olası zorluklar
- Rekabet: NFT pazar yeri alanında artan rekabet
RARI Düzenleyici Riskler
- Belirsiz regülasyonlar: Gelecekteki NFT ve DeFi düzenlemelerinin etkisi
- Vergi etkileri: NFT işlemleri ve ödüllerine yönelik değişen vergi uygulamaları
- Sınır ötesi uyum: Farklı ülkelerde değişen regülasyon yaklaşımları
RARI Teknik Riskler
- Akıllı sözleşme açıkları: Olası istismar ve hatalar
- Ölçeklenebilirlik problemleri: Yoğun işlem dönemlerinde ağ tıkanıklığı
- Birlikte çalışabilirlik sorunları: Zincirler arası entegrasyonda zorluklar
VI. Sonuç ve Eylem Önerileri
RARI Yatırım Değeri Analizi
RARI, NFT ve DeFi sektörlerindeki büyüme potansiyeli ile uzun vadeli fırsatlar sunuyor; kısa vadede ise piyasa oynaklığı ve regülasyon belirsizliği nedeniyle risk barındırıyor. Değeri, Rarible ekosisteminin başarısına doğrudan bağlı.
RARI Yatırım Tavsiyeleri
✅ Yeni başlayanlar: Küçük pozisyonlarla başlayın, NFT ve DeFi öğrenmeye odaklanın ✅ Deneyimli yatırımcılar: RARI'yi çeşitlendirilmiş bir kripto portföyünde değerlendirin ✅ Kurumsal yatırımcılar: RARI'nin potansiyelini genel NFT pazar eğilimleriyle analiz edin
RARI Katılım Yöntemleri
- Doğrudan alım: Gate.com'da RARI satın alın
- Ekosistem katılımı: Rarible platformunda aktif olarak RARI kazanın
- Staking: Yönetişim ve ödül için RARI stake edin
Kripto para yatırımları yüksek risk içerir, bu makale yatırım tavsiyesi değildir. Yatırımcılar, kendi risk toleranslarına göre dikkatli karar vermeli ve profesyonel finansal danışmanlardan destek almalıdır. Asla kaybetmeyi göze alabileceğinizden fazlasını yatırmayın.
SSS
Rari iyi bir yatırım mı?
Rari'nin potansiyeli var ancak güçlü rakiplerle karşı karşıya. Gelecekteki büyümesi, NFT alanındaki piyasa eğilimleri ve benimsenme oranlarına bağlıdır.
2030 için RARI kripto fiyat tahmini nedir?
Mevcut piyasa eğilimlerine göre, RARI'nin 2030'da 0,82 ile 1,10 ABD doları arasında olması öngörülüyor.
RARI hissesi için tahmin nedir?
RARI'nin, son piyasa analizlerine göre 2025 yılında 0,82 ile 0,97 ABD doları arasında işlem görmesi ve ılımlı bir büyüme göstermesi bekleniyor.
Rarible iyi bir kripto mu?
Rarible, NFT meraklıları için güçlü bir potansiyele sahip. Platformu ve RARI tokenı, dijital sanat ticareti ve yönetişimde yenilikçi özellikler sunuyor.
Share
Content
Giriş: RARI'nin Piyasadaki Konumu ve Yatırım Potansiyeli
I. RARI Fiyat Geçmişi ve Güncel Piyasa Durumu
II. RARI'nin Gelecekteki Fiyatını Etkileyen Temel Unsurlar
III. 2025-2030 Arası RARI Fiyat Tahmini
IV. RARI Yatırım Stratejileri ve Risk Yönetimi
V. RARI için Olası Riskler ve Zorluklar
VI. Sonuç ve Eylem Önerileri
SSS
How to Buy Cryptocurrency


Trending Cryptocurrencies


Bir Saatte 300 Dolar Kazanmanın Yolları

NEAR nedir: Web3 uygulamalarına yönelik yeni nesil bir blockchain platformunu yakından inceliyoruz

ALPINE nedir: Modern geliştirme ortamları için Linux'un hafif konteyner teknolojisini yakından tanımak

AUDIO nedir: Ses Teknolojisi ve Kullanım Alanlarına Kapsamlı Bir Rehber
100 Doları Katlama Yöntemleri: Gerçekten Sonuç Veren Kanıtlanmış Stratejiler ve Metotlar
2025 AUDIO Fiyat Tahmini: Audius Token’ın Piyasa Trendleri ve Büyüme Potansiyeli Üzerine Analiz

Dropee Günlük Kombinasyonu 12 Aralık 2025
Tomarket Günlük Kombinasyonu 12 Aralık 2025

SEI Airdrop Ödülleri’ne Katılım ve Talep Etme Kılavuzu

Kripto para birimlerinde algoritmik alım satım için etkili stratejiler
Stock-to-Flow Model ile Bitcoin'in Değerlemesini Anlamak