2025 QPrice Prediction: Emerging Market Trends and Investment Opportunities for Digital Assets
Introduction: Q's Market Position and Investment Value
Quack AI (Q), as the AI-native governance layer for Web3, has transformed decentralized governance processes into automated, auditable workflows since its inception. As of 2025, Quack AI's market capitalization has reached $48,905,008, with a circulating supply of approximately 1,616,000,000 tokens, and a price hovering around $0.030263. This asset, hailed as the "Web3 Governance Innovator," is playing an increasingly crucial role in enhancing decision-making for DAOs and RWA projects.
This article will comprehensively analyze Quack AI's price trends from 2025 to 2030, combining historical patterns, market supply and demand, ecosystem development, and macroeconomic factors to provide investors with professional price predictions and practical investment strategies.
I. Q Price History Review and Current Market Status
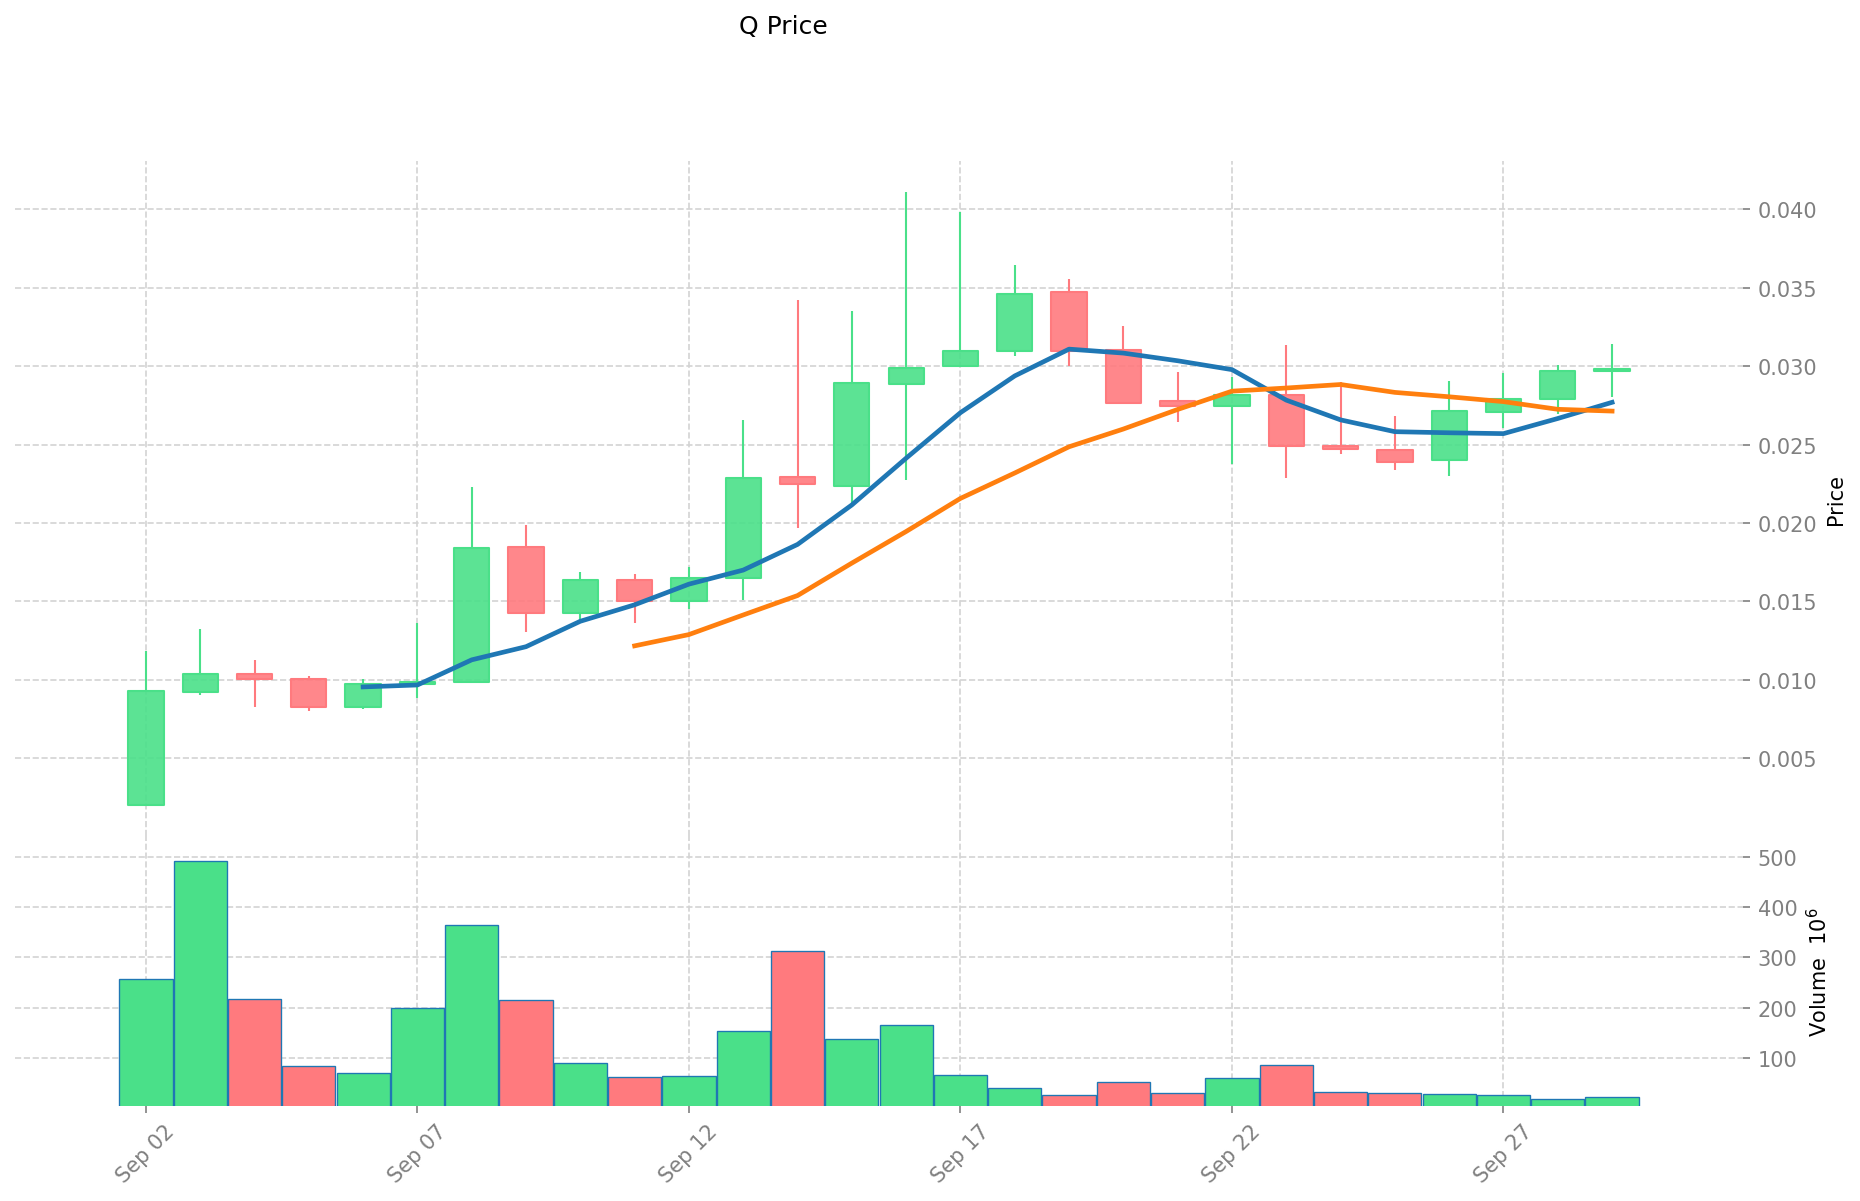
Q Historical Price Evolution
- 2025: Project launch, price started at $0.01
- September 2, 2025: Reached all-time low of $0.002
- September 16, 2025: Achieved all-time high of $0.041126
Q Current Market Situation
As of September 30, 2025, Q is trading at $0.030263, with a 24-hour trading volume of $811,872. The token has experienced a 1.36% increase in the last 24 hours and a significant 27.87% surge over the past week. Q's market capitalization currently stands at $48,905,008, ranking it 680th in the overall crypto market.
The circulating supply of Q is 1,616,000,000 tokens, representing 16.16% of the total supply of 10,000,000,000. The fully diluted market cap is $302,630,000. Q has shown resilience in recent trading, maintaining a price above its launch price and demonstrating strong momentum in the short term.
Click to view current Q market price
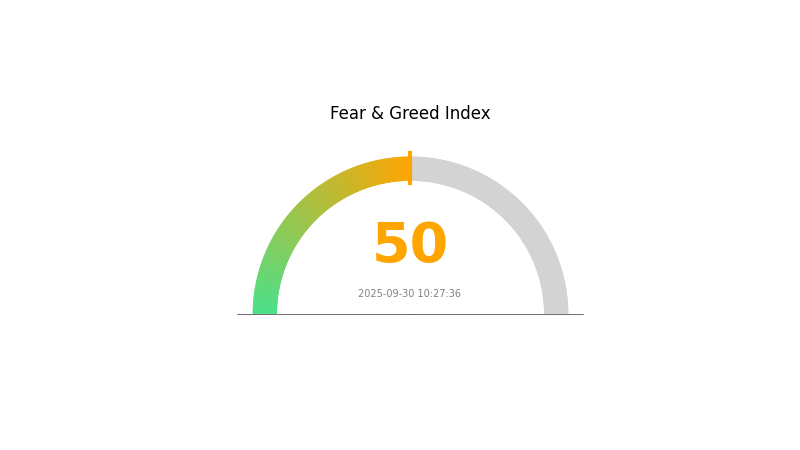
Q Market Sentiment Indicator
2025-09-30 Fear and Greed Index: 50 (Neutral)
Click to view the current Fear & Greed Index
The cryptocurrency market is currently in a balanced state, with the Fear and Greed Index at 50, indicating neutral sentiment. This equilibrium suggests that investors are neither overly pessimistic nor excessively optimistic. It's a prime opportunity for traders to reassess their strategies and portfolios. While the market doesn't show extreme fear or greed, caution is still advised. Investors should stay informed about market trends and news, and consider diversifying their assets to mitigate potential risks in this neutral environment.
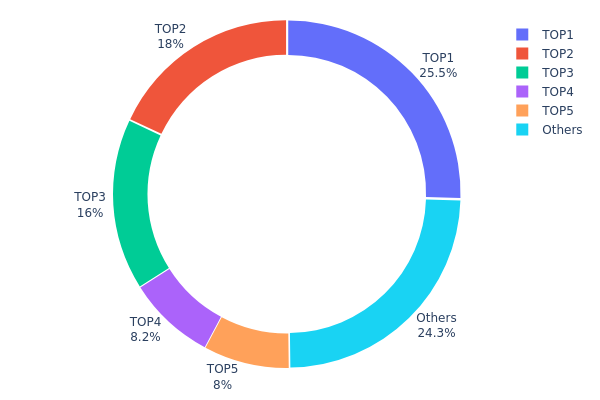
Q Holdings Distribution
The address holdings distribution chart provides insights into the concentration of Q tokens among different wallet addresses. Based on the data, we observe a significant concentration of Q tokens among the top holders. The top five addresses collectively control 75.68% of the total supply, with the largest holder possessing 25.48% of all Q tokens.
This high concentration raises concerns about the decentralization and potential market manipulation of Q. The top holder alone has the ability to significantly influence market dynamics, while the combined power of the top five addresses could exert substantial control over price movements. Such concentration may lead to increased volatility and vulnerability to large sell-offs or accumulation events.
From a market structure perspective, this distribution suggests a relatively centralized ecosystem for Q, which may impact its perceived value and adoption potential. While some level of concentration is common in many cryptocurrencies, the current distribution of Q indicates a higher-than-average centralization, potentially affecting its long-term stability and resistance to market manipulation.
Click to view the current Q Holdings Distribution
| Top | Address | Holding Qty | Holding (%) |
|---|---|---|---|
| 1 | 0x74d8...633f55 | 1274000.00K | 25.48% |
| 2 | 0x5214...852638 | 900000.00K | 18.00% |
| 3 | 0x78ac...c2671e | 800000.00K | 16.00% |
| 4 | 0x7084...5a7169 | 410000.00K | 8.20% |
| 5 | 0xda6f...29d913 | 400000.00K | 8.00% |
| - | Others | 1215999.99K | 24.32% |
II. Key Factors Influencing Q's Future Price
Macroeconomic Environment
-
Impact of Monetary Policy: The Federal Reserve's interest rate decisions remain a core driver of Q's price. Current expectations of rate cuts due to moderate inflation and weakening job market are supportive of price increases.
-
Inflation Hedging Properties: Q continues to be viewed as a hedge against inflation, potentially benefiting from inflationary pressures.
-
Geopolitical Factors: Geopolitical risks remain a fundamental driver for Q as a safe-haven asset. The evolving global political landscape significantly influences price movements.
Institutional and Major Player Dynamics
-
Institutional Holdings: Central bank purchases have been identified as a key factor potentially driving future Q price trends.
-
National Policies: Government debt issues, particularly in the United States, are considered a major factor in determining Q's future price direction.
Technical Development and Ecosystem Building
- Market Sentiment: The net long position percentage on commodity exchanges is a significant indicator influencing Q's price, with a 10% change in long positions potentially impacting the price by $37 per ounce.
III. Q Price Prediction for 2025-2030
2025 Outlook
- Conservative prediction: $0.02641 - $0.03001
- Neutral prediction: $0.03001 - $0.03541
- Optimistic prediction: $0.03541 - $0.04081 (requires positive market sentiment and increased adoption)
2027-2028 Outlook
- Market phase expectation: Potential growth phase with increasing adoption
- Price range forecast:
- 2027: $0.03365 - $0.05282
- 2028: $0.03862 - $0.04736
- Key catalysts: Technological advancements, wider market acceptance, and potential partnerships
2030 Long-term Outlook
- Base scenario: $0.04767 - $0.05297 (assuming steady market growth and adoption)
- Optimistic scenario: $0.05297 - $0.06991 (assuming strong market performance and increased utility)
- Transformative scenario: Above $0.06991 (extreme favorable conditions such as major institutional adoption)
- 2030-12-31: Q $0.05297 (potential 75% increase from 2025 levels)
| 年份 | 预测最高价 | 预测平均价格 | 预测最低价 | 涨跌幅 |
|---|---|---|---|---|
| 2025 | 0.04081 | 0.03001 | 0.02641 | 0 |
| 2026 | 0.04285 | 0.03541 | 0.03045 | 17 |
| 2027 | 0.05282 | 0.03913 | 0.03365 | 29 |
| 2028 | 0.04736 | 0.04598 | 0.03862 | 51 |
| 2029 | 0.05927 | 0.04667 | 0.03173 | 54 |
| 2030 | 0.06991 | 0.05297 | 0.04767 | 75 |
IV. Professional Investment Strategies and Risk Management for Q
Q Investment Methodology
(1) Long-term Holding Strategy
- Suitable for: Long-term investors with high risk tolerance
- Operation suggestions:
- Accumulate Q tokens during market dips
- Set price targets and regularly reassess the project's progress
- Store tokens securely in a hardware wallet
(2) Active Trading Strategy
- Technical analysis tools:
- Moving Averages: Use to identify trends and potential entry/exit points
- Relative Strength Index (RSI): Helps determine overbought/oversold conditions
- Key points for swing trading:
- Monitor Q's performance relative to major cryptocurrencies
- Set stop-loss orders to manage downside risk
Q Risk Management Framework
(1) Asset Allocation Principles
- Conservative investors: 1-3%
- Aggressive investors: 5-10%
- Professional investors: 10-15%
(2) Risk Hedging Solutions
- Diversification: Spread investments across multiple cryptocurrencies and traditional assets
- Stop-loss orders: Implement to limit potential losses
(3) Secure Storage Solutions
- Hot wallet recommendation: Gate Web3 Wallet
- Cold storage solution: Hardware wallet for long-term holdings
- Security precautions: Use two-factor authentication, keep private keys offline
V. Potential Risks and Challenges for Q
Q Market Risks
- High volatility: Cryptocurrency markets are known for extreme price swings
- Competition: Other AI governance projects may emerge and capture market share
- Market sentiment: Overall crypto market trends can significantly impact Q's price
Q Regulatory Risks
- Unclear regulations: Cryptocurrency regulations are still evolving in many jurisdictions
- Potential restrictions: Governments may impose limitations on AI-based governance systems
- Compliance challenges: Adapting to new regulations could impact Q's functionality
Q Technical Risks
- Smart contract vulnerabilities: Potential bugs or exploits in the underlying code
- Scalability issues: The platform may face challenges as user adoption grows
- AI limitations: The AI system may not perform as expected in all governance scenarios
VI. Conclusion and Action Recommendations
Q Investment Value Assessment
Q presents an innovative approach to Web3 governance, leveraging AI to streamline decision-making processes. While the project shows promise for long-term value creation, investors should be aware of the high volatility and regulatory uncertainties in the short term.
Q Investment Recommendations
✅ Beginners: Start with small positions and focus on learning about the technology ✅ Experienced investors: Consider allocating a portion of your crypto portfolio to Q, but maintain diversification ✅ Institutional investors: Conduct thorough due diligence and consider Q as part of a broader Web3 investment strategy
Q Trading Participation Methods
- Spot trading: Purchase Q tokens on Gate.com
- Staking: Participate in staking programs if available to earn passive income
- Governance participation: Engage in the QuackAI ecosystem by voting on proposals and contributing to discussions
Cryptocurrency investments carry extremely high risks, and this article does not constitute investment advice. Investors should make decisions carefully based on their own risk tolerance and are advised to consult professional financial advisors. Never invest more than you can afford to lose.
FAQ
What is the stock price prediction for QuantumScape in 2025?
QuantumScape stock price is predicted to reach $308-$426 per share in 2025, based on community analysis.
What is the price prediction for quantum coin in 2025?
Based on market analysis, Quantum coin's price in 2025 is predicted to range from $0.1827 to $13.59.
What is the price prediction for QCOM stock?
QCOM stock is predicted to reach a high of $186.18 and a low of $130.64 in the next five years, with the average price fluctuating within this range.
What crypto has the highest price prediction?
Bitcoin has the highest price prediction for 2025, followed closely by Ethereum. These predictions are based on current market trends and expert analysis.
Share
Content
Introduction: Q's Market Position and Investment Value
I. Q Price History Review and Current Market Status
II. Key Factors Influencing Q's Future Price
III. Q Price Prediction for 2025-2030
IV. Professional Investment Strategies and Risk Management for Q
V. Potential Risks and Challenges for Q
VI. Conclusion and Action Recommendations
FAQ

