2025 PPT Fiyat Tahmini: Palantir Technologies Hisse Değerinin Geleceğinde Yol Haritası


Giriş: PPT'nin Piyasa Konumu ve Yatırım Değeri
Pop Social (PPT), Web3 dünyasına yapay zeka destekli sosyal bir geçit sunarak, kuruluşundan bu yana sosyal medya etkileşimlerini köklü biçimde dönüştürmüştür. 2025 yılı itibarıyla Pop Social'ın piyasa değeri 3.297.965 USD'ye ulaşırken, yaklaşık 85.639.187 adet dolaşımdaki token ile fiyatı 0,03851 USD seviyesinde seyretmektedir. "Web3 sosyal yenilikçisi" olarak anılan bu varlık, merkeziyetsiz sosyal medya ve yaratıcı içeriklerin gelir elde edilmesi alanında giderek daha önemli bir rol üstlenmektedir.
Bu makalede, Pop Social'ın 2025-2030 dönemindeki fiyat hareketleri; tarihsel eğilimler, piyasa arz-talebi, ekosistem gelişimi ve makroekonomik faktörler temelinde kapsamlı biçimde analiz edilerek, yatırımcılara profesyonel fiyat tahminleri ile pratik yatırım stratejileri sunulacaktır.
I. PPT Fiyat Geçmişi ve Güncel Piyasa Durumu
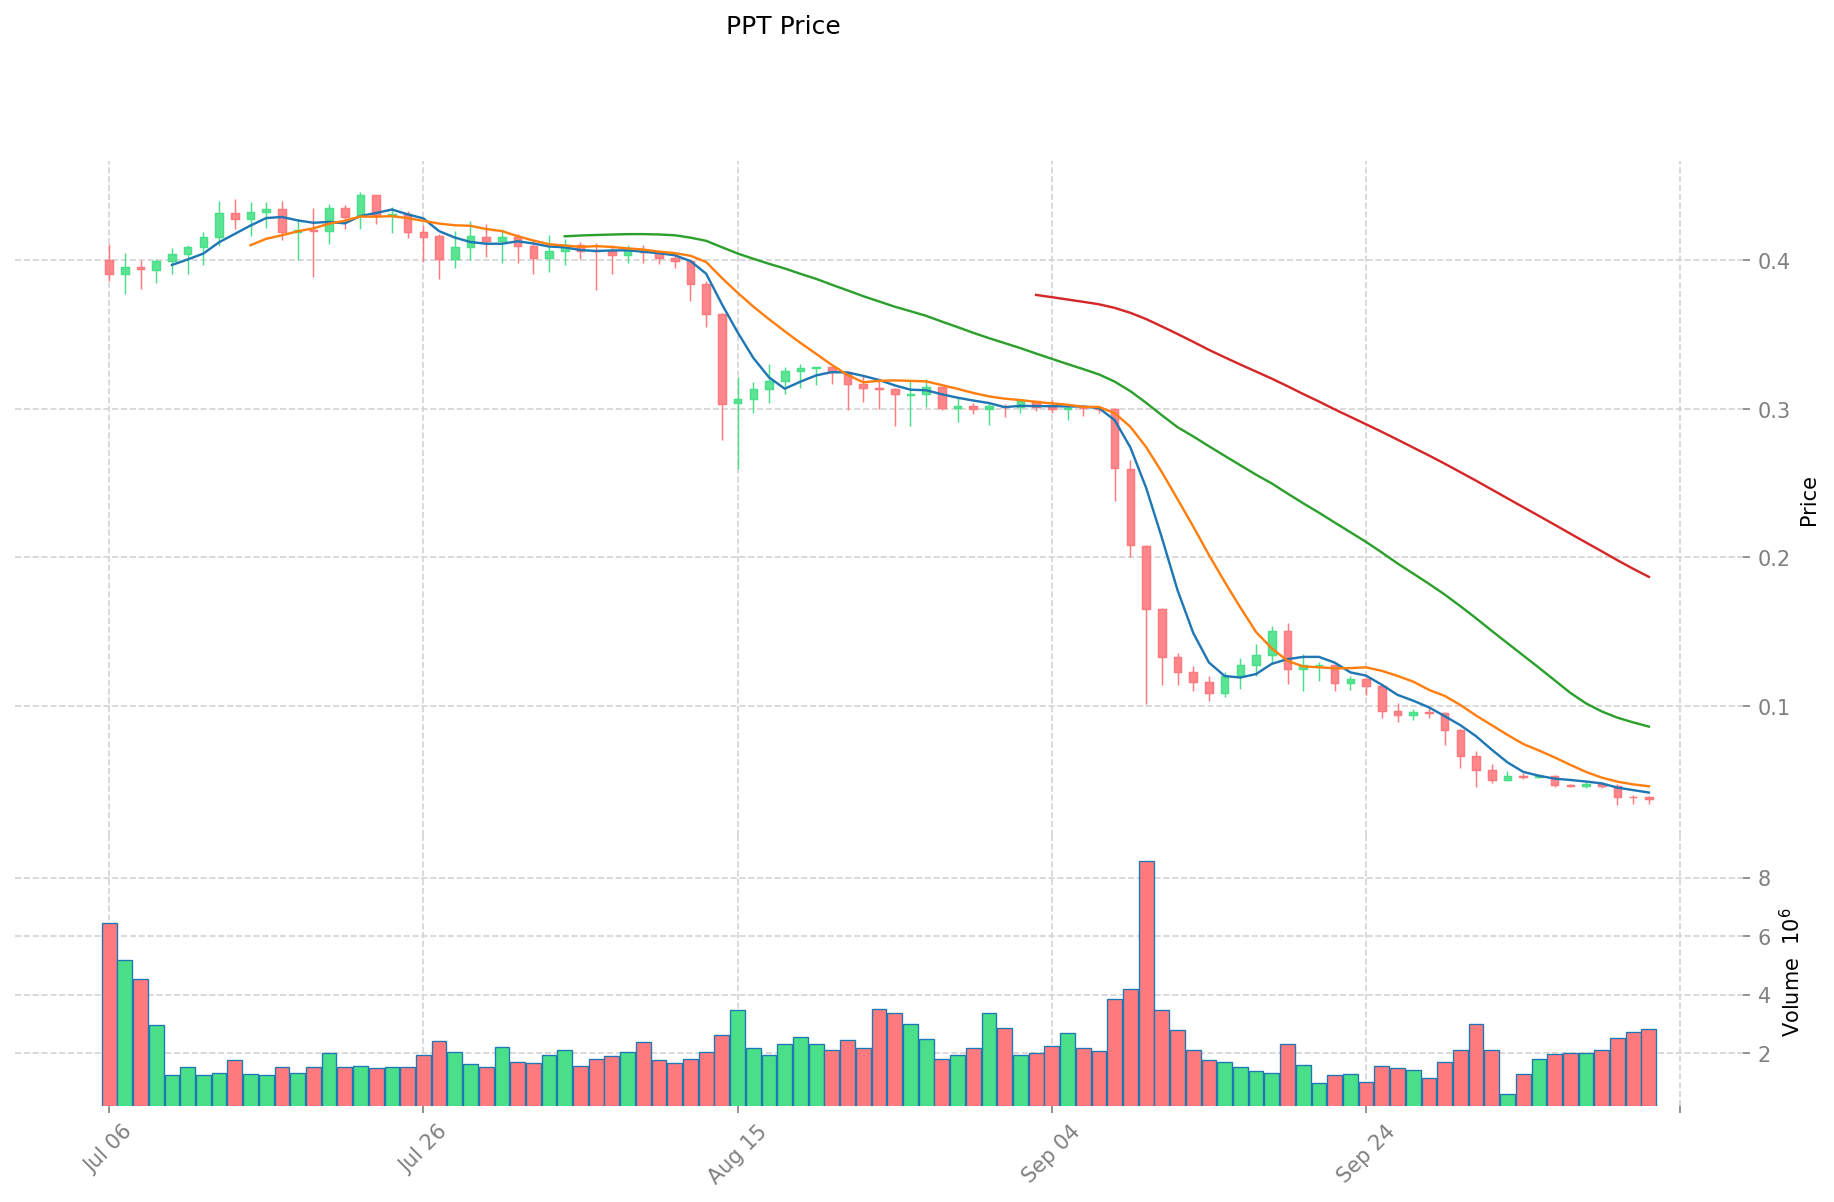
PPT'nin Tarihsel Fiyat Gelişimi
- 2024: Pop Social platformu devreye alındı, fiyat 17 Mart'ta 0,495311 USD ile tüm zamanların en yüksek seviyesine (ATH) çıktı
- 2024: Piyasa düzeltmesiyle fiyat 5 Kasım'da 0,02707523 USD ile tüm zamanların en düşük seviyesine (ATL) geriledi
- 2025: Kademeli toparlanma, fiyat 0,03 USD ile 0,04 USD aralığında dalgalanıyor
PPT Güncel Piyasa Görünümü
13 Ekim 2025 itibarıyla PPT, 0,03851 USD seviyesinden işlem görüyor ve 24 saatlik işlem hacmi 103.922,22883 USD. Son 24 saatte %1,55, son bir saatte ise %1,83 oranında kısa vadede pozitif bir ivme sergiledi. Ancak, orta vadede düşüş eğilimi söz konusu; son bir haftada %27,07, son 30 günde ise %66,75 oranında ciddi bir gerileme yaşandı. Tüm bu olumsuz tabloya rağmen PPT, son bir yılda %16,77 büyüme göstererek uzun vadede dirençli bir görünüm sergiledi. Güncel piyasa değeri 3.297.965,09137 USD ve PPT, küresel kripto para sıralamasında 2.030'uncu sırada yer alıyor. 85.639.187 adet dolaşımdaki PPT tokeni, toplam 200.000.000 arzın içinde bulunuyor ve piyasa dinamikleri, kıtlık ile erişilebilirlik arasında bir dengeyi yansıtıyor.
Güncel PPT piyasa fiyatını görmek için tıklayın
PPT Piyasa Duyarlılık Göstergesi
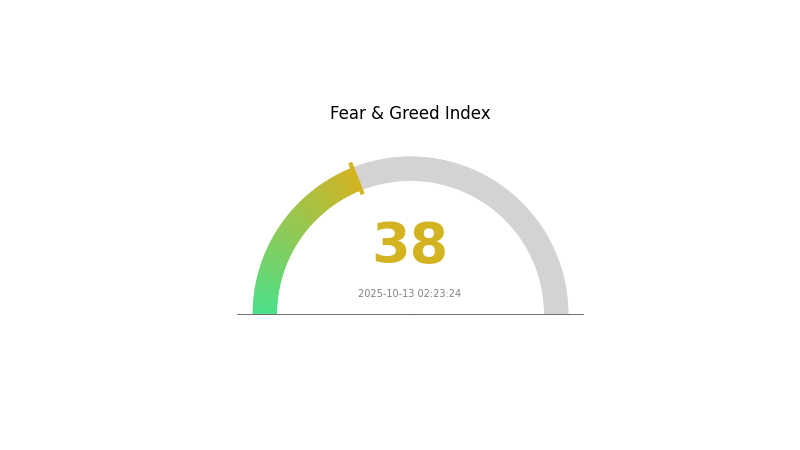
13 Ekim 2025 Korku ve Açgözlülük Endeksi: 38 (Korku)
Güncel Korku & Açgözlülük Endeksini incelemek için tıklayın
Kripto piyasasında şu anda korku hakim ve endeks 38 seviyesinde. Bu, yatırımcılar arasında temkinli bir hava olduğunu gösteriyor ve zıt pozisyon alanlar için fırsat yaratabilir. Ancak yatırım kararı almadan önce dikkatli olunmalı, kapsamlı araştırma yapılmalıdır. Unutmayın, piyasa duyarlılığı hızla değişebilir; bugünkü korku ortamı yarın iyimserliğe dönüşebilir. Güncel kalın ve Gate.com'un araçlarıyla belirsiz piyasa koşullarında yönünüzü belirleyin.
PPT Varlık Dağılımı
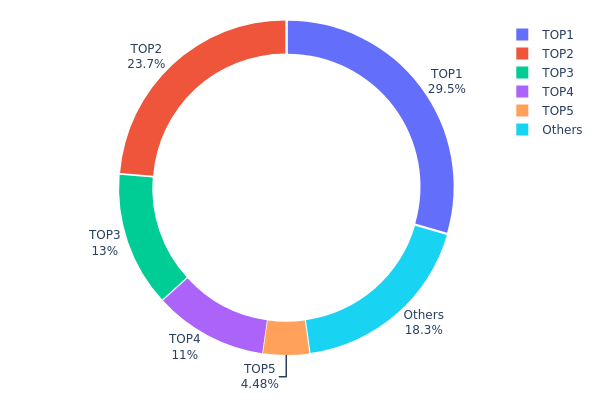
Adres bazlı dağılım verileri, PPT tokenlerinin farklı cüzdanlardaki yoğunlaşmasına ilişkin kritik bilgiler sağlar. Analiz, sahipliğin son derece yoğunlaştığını; en büyük 5 adresin toplam arzın %81,69'unu kontrol ettiğini gösteriyor. En büyük sahip tüm tokenlerin %29,49'una, ikinci en büyük ise %23,73'üne sahip.
Böyle bir yoğunlaşma, piyasa merkezileşmesi ve olası fiyat manipülasyonu riskini artırır. Tokenlerin büyük bir kısmının az sayıda adreste toplanması, ani satışlar veya koordineli hareketlerle PPT'nin fiyatı ve likiditesi üzerinde ciddi etkilere yol açabilir. Ayrıca, "ölü" adresin (0x0000...00dead) %10,99 oranında token tutması, dolaşımdaki arzı fiilen azaltır ve oynaklığı artırır.
Bu dağılım modeli, PPT'nin merkeziyetsizlik düzeyinin düşük olduğunu ve piyasadaki şoklara karşı dayanıklılığını, uzun vadeli istikrarını etkileyebileceğini gösteriyor. Yatırımcılar, üst düzey sahipliklerdeki önemli değişiklikleri yakından izlemeli; çünkü bunlar piyasa dinamiklerinde veya içerideki hareketlerde kritik değişimlerin habercisi olabilir.
Güncel PPT Varlık Dağılımını
| En Büyük | Adres | Varlık Miktarı | Dağılım (%) |
|---|---|---|---|
| 1 | 0x2949...566cf6 | 56.662,78K | 29,49% |
| 2 | 0x49cf...f5e4f0 | 45.601,24K | 23,73% |
| 3 | 0x6ea0...2654a5 | 25.000,00K | 13,01% |
| 4 | 0x0000...00dead | 21.117,26K | 10,99% |
| 5 | 0x3721...592e6b | 8.600,00K | 4,47% |
| - | Diğerleri | 35.160,78K | 18,31% |
II. Gelecekteki PPT Fiyatlarını Etkileyen Başlıca Faktörler
Arz Mekanizması
- Proje Karmaşıklığı: PPT projelerinin teknik ve içerik zenginliği fiyatlarda belirleyici etkiye sahiptir.
- Tarihsel Eğilim: Geçmişte, daha karmaşık ve bilgi yoğun projeler daha yüksek fiyatlardan işlem görmüştür.
- Güncel Etki: AI tabanlı PPT araçlarının yaygınlaşması, karmaşık projelerin fiyatlarını aşağı çekebilir.
Kurumsal ve Büyük Oyuncu Dinamikleri
- Kurumsal Benimseme: Özellikle KOBİ'lerin akıllı PPT araçlarına yönelmesi, piyasa talebini artırmaktadır.
- Ulusal Politikalar: Dijital dönüşüm ve AI tabanlı ofis verimliliği araçlarını teşvik eden kamu politikaları, PPT fiyatlarını dolaylı olarak etkiler.
Makroekonomik Ortam
- Enflasyona Karşı Dayanıklılık: PPT hizmetlerinde sağlayıcıların değer koruması adına fiyatlar enflasyon ile paralel olarak ayarlanabilir.
Teknolojik Gelişim ve Ekosistem Oluşumu
- AI Entegrasyonu: PPT üretiminde yapay zeka entegrasyonu, sektörü dönüştürüp maliyetleri azaltıyor ve verimliliği artırıyor.
- Kullanıcı Deneyimi İyileştirmeleri: Arayüz ve otomatik tasarım fonksiyonlarındaki gelişmeler, fiyatlandırma stratejilerinde önemli rol oynuyor.
- Ekosistem Uygulamaları: PPT bağlantılı araç ve platformların gelişimi, fiyat yapısında değişikliklere yol açabilir.
III. 2025-2030 Arası PPT Fiyat Tahmini
2025 Görünümü
- Temkinli tahmin: 0,02761 USD - 0,03835 USD
- Nötr tahmin: 0,03835 USD - 0,04449 USD
- İyimser tahmin: 0,04449 USD - 0,05062 USD (olumlu piyasa duyarlılığı ve proje ilerlemesi gerekir)
2027-2028 Görünümü
- Piyasa aşaması beklentisi: Benimsenmenin artmasıyla büyüme dönemi
- Fiyat aralığı tahmini:
- 2027: 0,03877 USD - 0,07975 USD
- 2028: 0,04324 USD - 0,08108 USD
- Başlıca katalizörler: Teknolojik gelişmeler, iş birliği artışı ve genel kripto piyasası eğilimleri
2029-2030 Uzun Vadeli Görünüm
- Temel senaryo: 0,07433 USD - 0,08882 USD (istikrarlı piyasa büyümesi ve proje gelişimi varsayımıyla)
- İyimser senaryo: 0,08882 USD - 0,10331 USD (ekosistemin ciddi şekilde büyümesi ve piyasa penetrasyonu ile)
- Dönüştürücü senaryo: 0,10331 USD - 0,11813 USD (yenilikçi gelişmeler ve kitlesel kabul ile)
- 2030-12-31: PPT 0,11813 USD (iyimser tahminle potansiyel zirve)
| Yıl | Tahmini En Yüksek Fiyat | Tahmini Ortalama Fiyat | Tahmini En Düşük Fiyat | Değişim Oranı |
|---|---|---|---|---|
| 2025 | 0,05062 | 0,03835 | 0,02761 | 0 |
| 2026 | 0,06628 | 0,04449 | 0,03025 | 15 |
| 2027 | 0,07975 | 0,05539 | 0,03877 | 43 |
| 2028 | 0,08108 | 0,06757 | 0,04324 | 75 |
| 2029 | 0,10331 | 0,07433 | 0,0446 | 93 |
| 2030 | 0,11813 | 0,08882 | 0,07905 | 130 |
IV. PPT'ye Yönelik Profesyonel Yatırım Stratejileri ve Risk Yönetimi
PPT Yatırım Metodolojisi
(1) Uzun Vadeli Tutma Stratejisi
- Uygun yatırımcı profili: Yüksek risk toleransına sahip uzun vadeli yatırımcılar
- Operasyonel öneriler:
- PPT tokenlerini piyasa düşüşlerinde biriktirin
- Kısmi kar alımı için fiyat hedefleri belirleyin
- Tokenlerinizi güvenli, saklamasız cüzdanda muhafaza edin
(2) Aktif Ticaret Stratejisi
- Teknik analiz araçları:
- Hareketli Ortalamalar: Kısa ve uzun vadeli eğilimleri izleyin
- RSI (Göreli Güç Endeksi): Aşırı alım ve aşırı satım seviyelerini tespit edin
- Dalgalı ticaret için temel noktalar:
- Riskinizi yönetmek için sıkı zarar durdur emirleri kullanın
- Sosyal medya duyarlılığı ve proje gelişmelerini izleyin
PPT Risk Yönetimi Yaklaşımı
(1) Varlık Dağılımı Prensipleri
- Temkinli yatırımcılar: Kripto portföyünün %1-3'ü
- Agresif yatırımcılar: Kripto portföyünün %5-10'u
- Profesyonel yatırımcılar: Kripto portföyünün %15'ine kadar
(2) Riskten Korunma Çözümleri
- Diversifikasyon: Yatırımlarınızı farklı kripto varlıklar arasında dağıtın
- Zarar durdur emirleri: Potansiyel kayıpları sınırlandırmak için otomatik satış emirleri oluşturun
(3) Güvenli Saklama Alternatifleri
- Sıcak cüzdan tavsiyesi: Gate Web3 Cüzdanı
- Soğuk saklama: Uzun vadeli saklama için donanım cüzdanı kullanın
- Güvenlik önlemleri: İki aşamalı doğrulama aktif edin, güçlü şifreler kullanın
V. PPT'ye Yönelik Potansiyel Riskler ve Zorluklar
PPT Piyasa Riskleri
- Yüksek oynaklık: Küçük hacimli tokenlerde sık görülen sert fiyat dalgalanmaları
- Sınırlı likidite: Büyük işlemlerin gerçekleştirilmesinde güçlükler yaşanabilir
- Piyasa duyarlılığı: Yatırımcı algısındaki ani değişimlere açık olma
PPT'ye Yönelik Düzenleyici Riskler
- Belirsiz düzenlemeler: Sosyal tokenleri etkileyebilecek yeni düzenleyici müdahaleler ihtimali
- Sınır ötesi uyum: Farklı ülkelerde değişen hukuki statü
- KYC/AML gereklilikleri: Kullanıcı doğrulamasında daha sıkı uygulamaların hayata geçmesi olasılığı
PPT Teknik Riskleri
- Akıllı sözleşme açıkları: Token sözleşmesinde hata veya saldırı riski
- Ölçeklenebilirlik sorunları: BSC zincirinde ağ tıkanıklığı yaşanabilir
- Siber güvenlik tehditleri: Pop Social platformuna yönelik saldırı riski
VI. Sonuç ve Eylem Önerileri
PPT Yatırım Değeri Analizi
PPT, yükselen AI tabanlı sosyal medya segmentinde yüksek riskli ve yüksek potansiyelli bir yatırım olarak öne çıkıyor. Yenilikçi özellikleri ve büyüme potansiyeli ile dikkat çekse de, yatırımcılar ciddi volatilite ve düzenleyici belirsizlikleri gözetmelidir.
PPT Yatırım Tavsiyeleri
✅ Yeni başlayanlar: Portföyünüzün küçük bir kısmını ayırın, öğrenmeye odaklanın ✅ Deneyimli yatırımcılar: Risk yönetimiyle orta düzeyde yatırım düşünebilir ✅ Kurumsal yatırımcılar: Kapsamlı inceleme yapın, proje gelişimini yakından takip edin
PPT İşlem Katılımı Yöntemleri
- Spot işlem: Gate.com üzerinden PPT token alım-satımı
- Staking: Pasif gelir için mevcut staking programlarına katılım
- DeFi entegrasyonu: Pop Social ekosistemi destekliyorsa merkeziyetsiz finans uygulamalarını değerlendirin
Kripto para yatırımları son derece yüksek risk taşır; bu makale yatırım tavsiyesi değildir. Yatırımcılar, kendi risk toleranslarına göre karar vermeli ve uzman finansal danışmanlardan destek almalıdır. Asla kaybetmeyi göze alabileceğinizden fazla yatırım yapmayın.
SSS
PPT alınmalı mı, satılmalı mı?
PPT şu anda satılmalı. Teknik analiz, fiyatın aşağı yönlü bir trende sahip olduğunu gösteriyor. Ancak yatırım kararı almadan önce mutlaka detaylı araştırma yapın.
Pepe'nin 2025 fiyat tahmini nedir?
Mevcut düşüş eğilimi ve tarihsel verilere göre, Pepe'nin fiyatı 2025'te düşük kalacak. Uzmanlar, kârlı bir yatırım olmayabileceğini belirtiyor.
POLS kripto para için 2030 fiyat tahmini nedir?
Mevcut piyasa eğilimlerine göre, POLS'in 2030 fiyat tahminleri 1,79 USD ile 3,19 USD arasında; ortalama tahmin ise 2,49 USD seviyesindedir.
Pi'nin 2025'teki fiyatı ne olacak?
Güncel tahminler, Pi'nin fiyatının Ekim 2025'te yaklaşık 0,239 USD olacağını ve son dönemde bir düşüş yaşandığını gösteriyor. RSI aşırı satım seviyesine işaret ediyor.
Share
Content
Giriş: PPT'nin Piyasa Konumu ve Yatırım Değeri
I. PPT Fiyat Geçmişi ve Güncel Piyasa Durumu
II. Gelecekteki PPT Fiyatlarını Etkileyen Başlıca Faktörler
III. 2025-2030 Arası PPT Fiyat Tahmini
IV. PPT'ye Yönelik Profesyonel Yatırım Stratejileri ve Risk Yönetimi
V. PPT'ye Yönelik Potansiyel Riskler ve Zorluklar
VI. Sonuç ve Eylem Önerileri
SSS
How to Buy Cryptocurrency


Trending Cryptocurrencies


Pop Social (PPT) iyi bir yatırım mı?: Bu yükselen sosyal medya platformunun potansiyeli ve riskleri üzerine analiz

2025 AWE Fiyat Tahmini: Piyasa Trendleri ve Gelecek Büyüme Potansiyelinin Kapsamlı Analizi

AITECH nedir: Yapay zekâ uygulamalarında devrim yaratan en son teknolojiyi keşfetmek
LAUNCHCOIN nedir: Kripto yatırımlarının geleceğini yeniden şekillendiren devrim niteliğindeki dijital para birimi

Sleepless AI (AI) iyi bir yatırım mı?: Gelişen yapay zeka sektöründe uzun vadeli büyüme potansiyeli ve risklerin incelenmesi

D vs BAT: Dijital Ekonomide Teknoloji Devlerinin Evrimi

Dropee Günlük Kombinasyonu 11 Aralık 2025
Tomarket Günlük Kombinasyonu 11 Aralık 2025

Merkeziyetsiz Finans'ta Geçici Kayıp Nedir?

Kripto Parada Çifte Harcama: Önleme Stratejileri

Kripto Ticaretinde Wyckoff Yönteminin Anlaşılması