2025 POWER Price Prediction: Analyzing Market Trends and Potential Growth Factors
Introduction: POWER's Market Position and Investment Value
Powerloom (POWER), as a composable data network for Web3 insights, has been providing reliable and verifiable on-chain data since its inception. As of 2025, POWER's market capitalization has reached $720,656, with a circulating supply of approximately 156,766,664 tokens, and a price hovering around $0.004597. This asset, known as the "fuel for Web3 data ecosystem," is playing an increasingly crucial role in ensuring hassle-free access to on-chain insights for Web3 consumers.
This article will comprehensively analyze POWER's price trends from 2025 to 2030, combining historical patterns, market supply and demand, ecosystem development, and macroeconomic factors to provide investors with professional price predictions and practical investment strategies.
I. POWER Price History Review and Current Market Status
POWER Historical Price Evolution
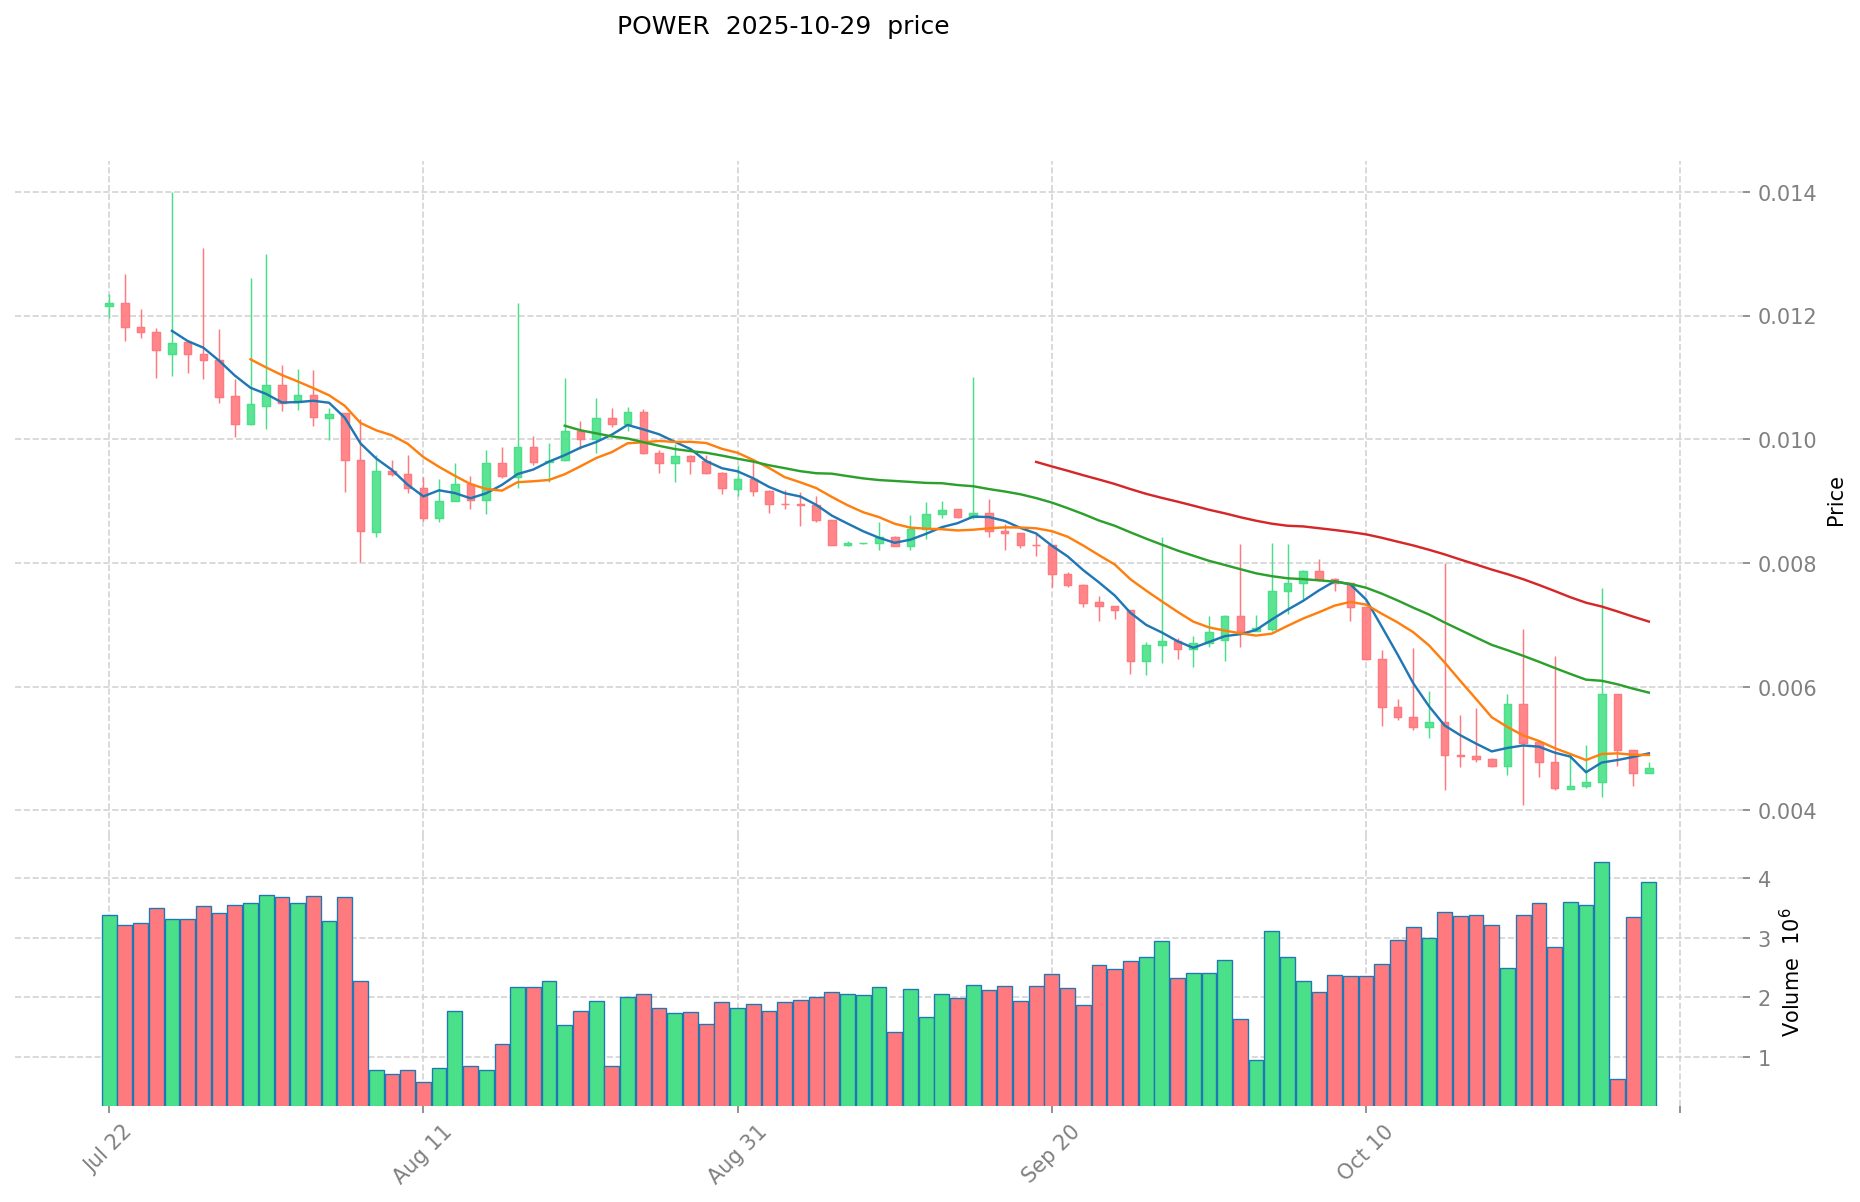
- 2025 (January): Initial launch, price peaked at $0.36 (ATH)
- 2025 (October): Market correction, price dropped to $0.00408 (ATL)
POWER Current Market Situation
As of October 30, 2025, POWER is trading at $0.004597. The token has experienced a 1.94% decrease in the last 24 hours, with a trading volume of $25,621.42. POWER's market capitalization stands at $720,656.35, ranking it 3133rd in the crypto market.
The token has shown mixed performance across different timeframes. While it has seen a 5.60% increase over the past week, it has declined by 31.44% in the last 30 days. The current price is significantly lower than its all-time high of $0.36, recorded on January 10, 2025.
POWER's circulating supply is 156,766,664 tokens, which represents 15.68% of its total supply of 1,000,000,000. The fully diluted valuation of the project is $4,597,000.
The market sentiment for POWER appears cautious, with the token trading closer to its all-time low than its all-time high. However, the recent 7-day positive trend might indicate a potential short-term recovery.
Click to view the current POWER market price
Here's the content in English as requested:
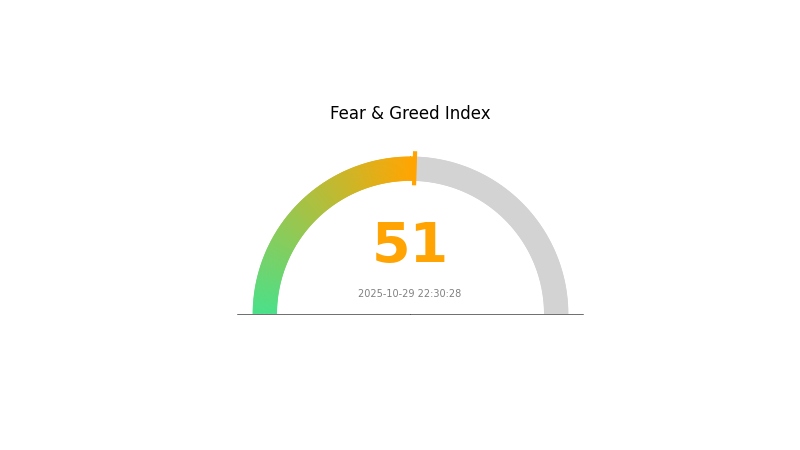
POWER Market Sentiment Indicator
2025-10-29 Fear and Greed Index: 51 (Neutral)
Click to view the current Fear & Greed Index
The cryptocurrency market sentiment remains balanced as the Fear and Greed Index hovers at 51, indicating a neutral stance. This equilibrium suggests investors are neither overly pessimistic nor excessively optimistic about current market conditions. While caution is still advisable, the neutral reading may present opportunities for strategic trading. As always, it's crucial to conduct thorough research and manage risks effectively when navigating the crypto landscape.
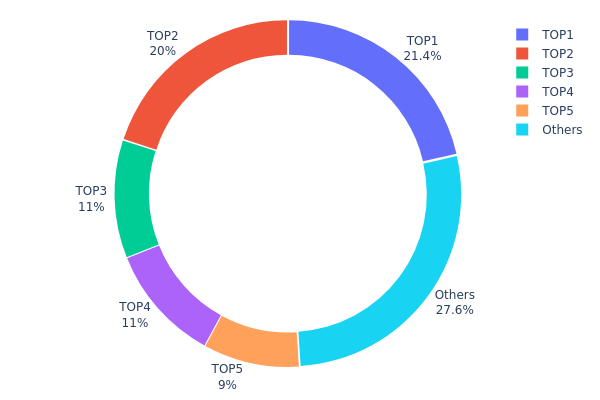
POWER Holdings Distribution
The address holdings distribution data reveals a highly concentrated ownership structure for POWER tokens. The top five addresses collectively hold 72.44% of the total supply, with the largest holder possessing 21.40%. This concentration level raises concerns about centralization and potential market manipulation.
Such a concentrated distribution can lead to increased price volatility and susceptibility to large holders' actions. The top two addresses alone control over 41% of the supply, potentially allowing them to exert significant influence on market dynamics. This centralized structure may undermine the project's decentralization goals and could pose risks to smaller investors.
The current distribution pattern suggests a relatively immature market structure for POWER, with limited widespread adoption. It indicates a need for improved token distribution mechanisms to enhance network security and resilience against potential manipulative actions by large holders.
Click to view the current POWER Holdings Distribution
| Top | Address | Holding Qty | Holding (%) |
|---|---|---|---|
| 1 | 0x7b18...499107 | 214000.00K | 21.40% |
| 2 | 0x1fe3...44fd3f | 200000.00K | 20.00% |
| 3 | 0x1f77...ab07da | 110460.99K | 11.04% |
| 4 | 0x8d54...b63f6a | 110000.00K | 11.00% |
| 5 | 0x59f6...8a0549 | 90000.00K | 9.00% |
| - | Others | 275539.01K | 27.56% |
II. Key Factors Influencing Future POWER Prices
Supply Mechanism
- Renewable Energy Development: The rapid growth of wind and solar power installations is expected to significantly impact future power supply and prices.
- Historical Patterns: Past trends show that increasing renewable energy capacity has led to downward pressure on power prices.
- Current Impact: Continued cost reductions in wind and solar technologies are likely to accelerate the development of variable renewable energy sources, potentially lowering overall power prices.
Institutional and Major Player Dynamics
- Corporate Adoption: Notable companies are increasingly investing in and adopting renewable energy solutions, particularly in data centers and cloud computing.
- National Policies: Government support for clean energy goals, especially in countries like China and India, is creating a favorable environment for renewable energy investments and acquisitions.
Macroeconomic Environment
- Geopolitical Factors: Ongoing geopolitical tensions and regional policy differences are significantly influencing energy security priorities and investment decisions in the power sector.
Technological Developments and Ecosystem Building
- Grid Flexibility: Advancements in power system flexibility, including improved grid infrastructure, demand-side response, and energy storage, are crucial for integrating higher proportions of variable renewable energy.
- Digital Transformation: The transition to a digital power system is reshaping the industry, enabling more efficient and integrated operations across the entire power value chain.
- Ecosystem Applications: The development of electric vehicles and their integration into the power system represents a significant ecosystem application that could impact future power demand and prices.
III. POWER Price Prediction for 2025-2030
2025 Outlook
- Conservative prediction: $0.00386 - $0.00459
- Neutral prediction: $0.00459 - $0.00503
- Optimistic prediction: $0.00503 - $0.00547 (requires positive market sentiment)
2027-2028 Outlook
- Market phase expectation: Potential growth phase
- Price range forecast:
- 2027: $0.00326 - $0.00700
- 2028: $0.00530 - $0.00919
- Key catalysts: Increased adoption, technological advancements, market expansion
2030 Long-term Outlook
- Base scenario: $0.00841 - $0.00967 (assuming steady market growth)
- Optimistic scenario: $0.00967 - $0.01151 (assuming strong market performance)
- Transformative scenario: $0.01151 - $0.01344 (assuming breakthrough innovations and widespread adoption)
- 2030-12-31: POWER $0.01344 (potential peak based on optimistic projections)
| 年份 | 预测最高价 | 预测平均价格 | 预测最低价 | 涨跌幅 |
|---|---|---|---|---|
| 2025 | 0.00547 | 0.00459 | 0.00386 | 0 |
| 2026 | 0.00684 | 0.00503 | 0.00332 | 9 |
| 2027 | 0.007 | 0.00593 | 0.00326 | 29 |
| 2028 | 0.00919 | 0.00647 | 0.0053 | 40 |
| 2029 | 0.01151 | 0.00783 | 0.0054 | 70 |
| 2030 | 0.01344 | 0.00967 | 0.00841 | 110 |
IV. POWER Professional Investment Strategies and Risk Management
POWER Investment Methodology
(1) Long-term Holding Strategy
- Suitable for: Long-term investors and believers in Web3 data solutions
- Operation suggestions:
- Accumulate POWER tokens during market dips
- Set price alerts for significant price movements
- Store tokens in secure hardware wallets
(2) Active Trading Strategy
- Technical analysis tools:
- Moving Averages: Use to identify trend directions
- RSI (Relative Strength Index): Identify overbought/oversold conditions
- Key points for swing trading:
- Monitor market sentiment and news related to Powerloom
- Set stop-loss orders to manage downside risk
POWER Risk Management Framework
(1) Asset Allocation Principles
- Conservative investors: 1-3% of crypto portfolio
- Aggressive investors: 5-10% of crypto portfolio
- Professional investors: Up to 15% of crypto portfolio
(2) Risk Hedging Solutions
- Diversification: Spread investments across different crypto assets
- Stop-loss orders: Implement to limit potential losses
(3) Secure Storage Solutions
- Hot wallet recommendation: Gate Web3 Wallet
- Cold storage solution: Use hardware wallets for long-term holdings
- Security precautions: Enable two-factor authentication, use unique passwords
V. Potential Risks and Challenges for POWER
POWER Market Risks
- High volatility: Price fluctuations can be extreme
- Limited liquidity: May affect ability to enter or exit positions
- Competition: Other Web3 data projects may impact market share
POWER Regulatory Risks
- Uncertain regulatory environment: Potential for new regulations affecting token utility
- Compliance challenges: Adapting to evolving legal frameworks in different jurisdictions
- Cross-border restrictions: Possible limitations on token usage in certain countries
POWER Technical Risks
- Smart contract vulnerabilities: Potential for exploits or bugs
- Scalability issues: Challenges in handling increased network demand
- Interoperability concerns: Integration difficulties with other blockchain networks
VI. Conclusion and Action Recommendations
POWER Investment Value Assessment
POWER presents a unique value proposition in the Web3 data space, but faces significant short-term volatility and adoption challenges. Long-term potential exists if Powerloom can establish itself as a leading data solution provider.
POWER Investment Recommendations
✅ Beginners: Consider small, experimental positions after thorough research ✅ Experienced investors: Implement dollar-cost averaging strategy with strict risk management ✅ Institutional investors: Conduct deep due diligence and consider as part of a diversified crypto portfolio
POWER Trading Participation Methods
- Spot trading: Available on Gate.com for direct token purchases
- Staking: Participate in any available staking programs to earn passive income
- Ecosystem participation: Engage with Powerloom's network to gain insights and potential rewards
Cryptocurrency investments carry extremely high risks, and this article does not constitute investment advice. Investors should make decisions carefully based on their own risk tolerance and are advised to consult professional financial advisors. Never invest more than you can afford to lose.
FAQ
What is the forecast for power prices?
Power prices are expected to rise due to structural load growth, rising renewable costs, gas generation limits, and tighter reliability standards. Renewable energy remains policy-driven.
What is the power market outlook for 2025?
The power market in 2025 shows strong growth in renewable energy, with declining conventional technologies. Investments in sustainable solutions and electricity storage are increasing rapidly.
What is the Powerledger price prediction for 2030?
Based on current market trends, the Powerledger price prediction for 2030 is estimated to be between $0.1177 and $0.1195.
Will Texas electricity rates go down in 2025?
Yes, Texas electricity rates are expected to decrease in 2025. The average wholesale price is projected to drop to $27-$34/MWh, and residential rates are likely to follow this downward trend.
Share
Content
Introduction: POWER's Market Position and Investment Value
I. POWER Price History Review and Current Market Status
II. Key Factors Influencing Future POWER Prices
III. POWER Price Prediction for 2025-2030
IV. POWER Professional Investment Strategies and Risk Management
V. Potential Risks and Challenges for POWER
VI. Conclusion and Action Recommendations
FAQ

