2025 OL Price Prediction: Analyzing Market Trends and Potential Growth Factors
Introduction: OL's Market Position and Investment Value
Open Loot (OL) as a Web3 gaming distribution platform and marketplace, has been supporting game developers and publishers since its inception. As of 2025, Open Loot's market capitalization has reached $4,045,592.83, with a circulating supply of approximately 201,373,461 tokens, and a price hovering around $0.02009. This asset, known as the "Web3 gaming enabler," is playing an increasingly crucial role in the gaming industry and blockchain-based distribution.
This article will comprehensively analyze Open Loot's price trends from 2025 to 2030, combining historical patterns, market supply and demand, ecosystem development, and macroeconomic environment to provide investors with professional price predictions and practical investment strategies.
I. OL Price History Review and Current Market Status
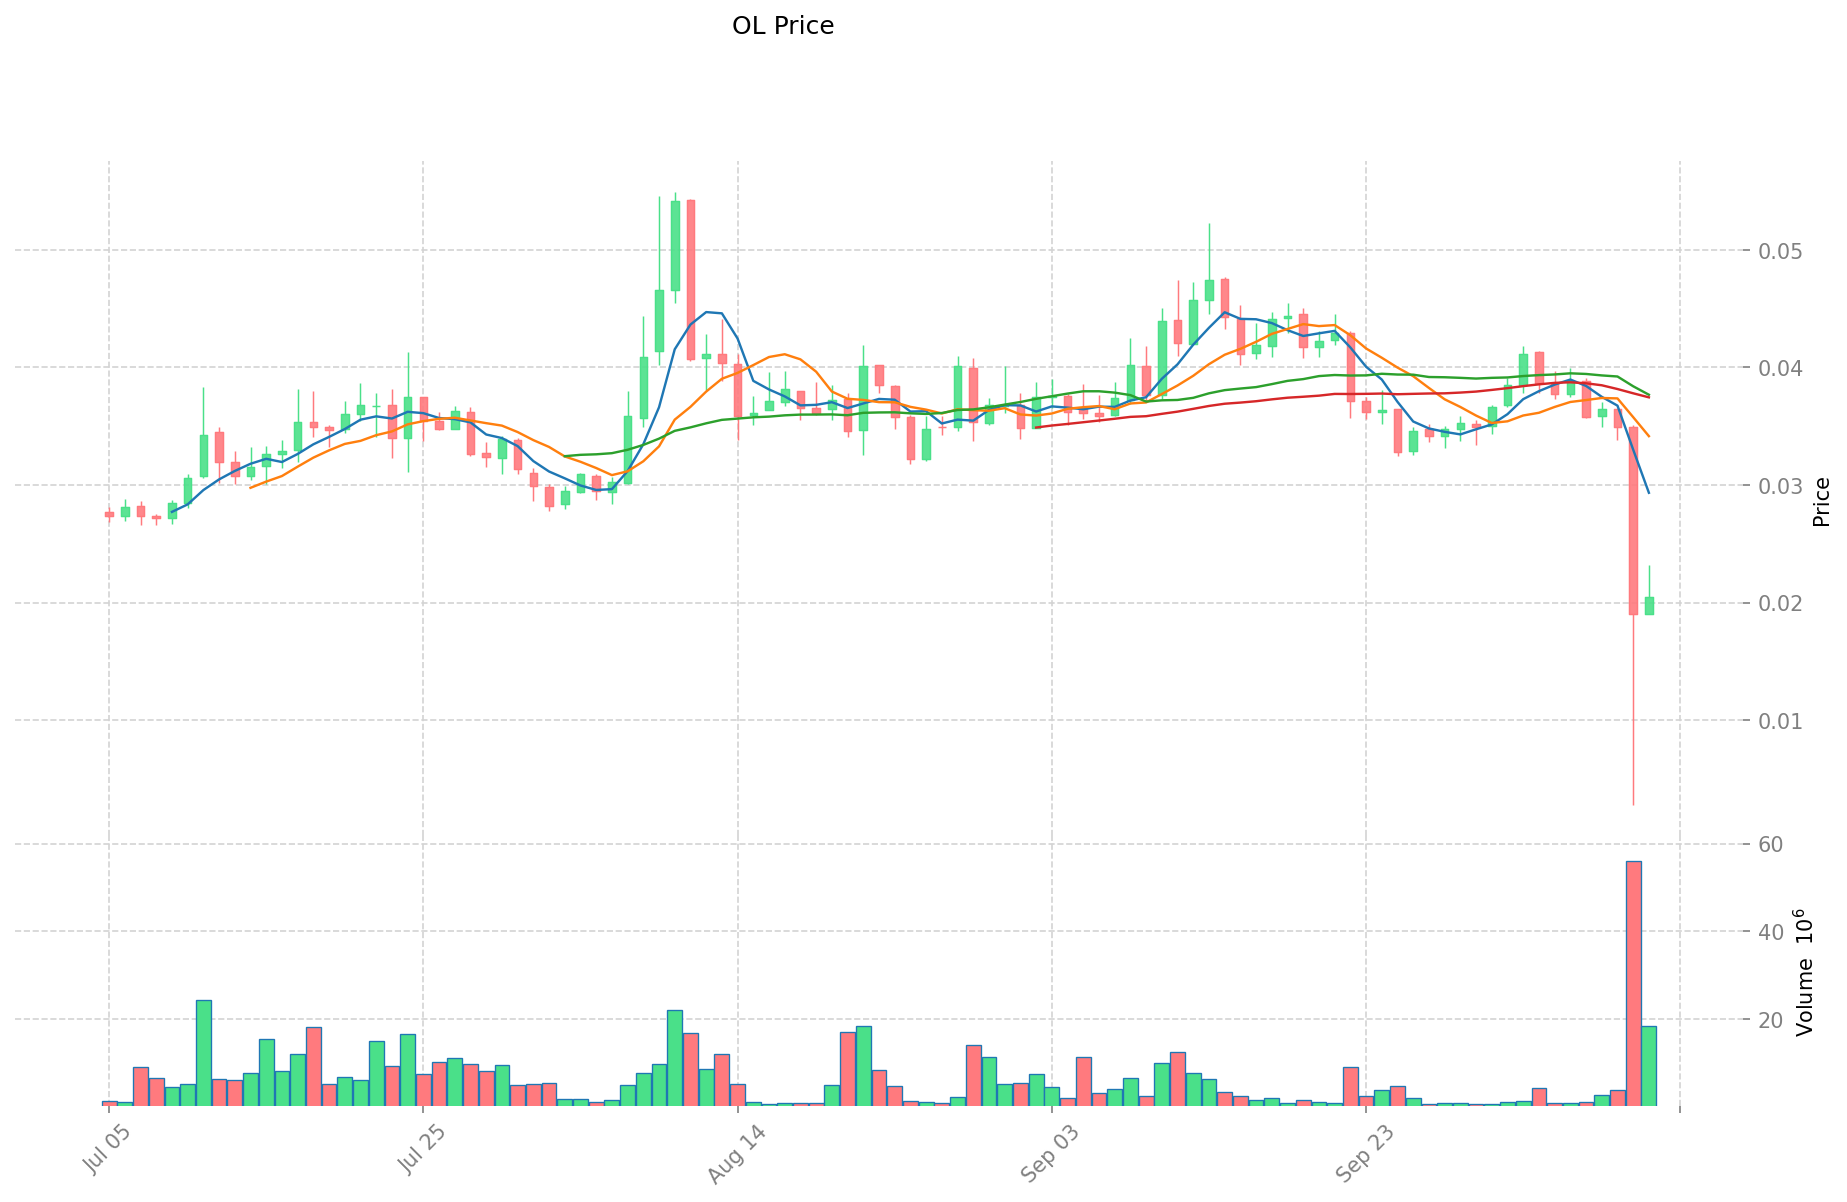
OL Historical Price Evolution
- 2024: Launch of Open Loot, price started at $0.01
- 2024: Reached all-time high of $0.69 on December 5th
- 2025: Market correction, price dropped to all-time low of $0.00274 on October 10th
OL Current Market Situation
As of October 12, 2025, OL is trading at $0.02009, with a 24-hour trading volume of $179,207.52. The token has experienced a 1.55% decrease in the last 24 hours. OL's market cap currently stands at $4,045,592.83, ranking it at 1851 in the global cryptocurrency market.
The token has shown significant volatility in recent periods. Over the past week, OL has seen a sharp decline of 47.25%, and an even steeper drop of 52.6% over the last 30 days. However, looking at a longer timeframe, OL has actually gained 103.60% over the past year, indicating its potential for substantial price movements in both directions.
OL's current price is 97.09% below its all-time high of $0.69, achieved less than a year ago. Conversely, it's trading 633.21% above its recent all-time low of $0.00274, recorded just two days ago. This extreme price action suggests a highly volatile market for OL.
The token's fully diluted market cap is $100,450,000, with a circulating supply of 201,373,461 OL out of a total supply of 5,000,000,000. The circulating supply represents only 4.03% of the total supply, which could potentially impact future price dynamics as more tokens enter circulation.
Click to view the current OL market price
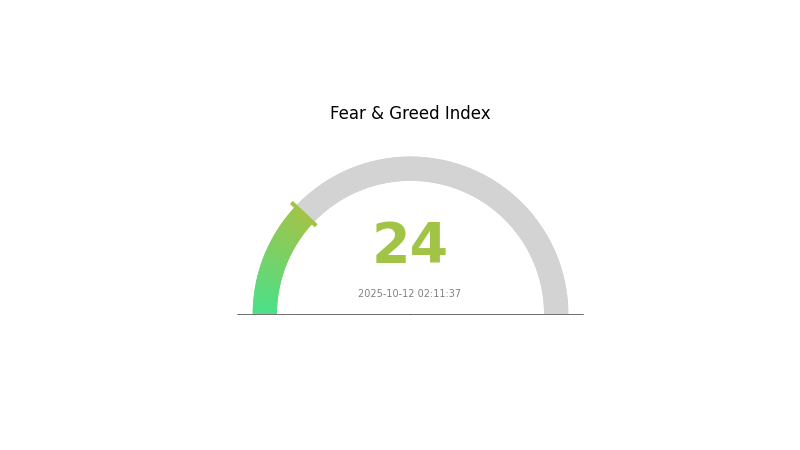
OL Market Sentiment Indicator
2025-10-12 Fear and Greed Index: 24 (Extreme Fear)
Click to view the current Fear & Greed Index
The crypto market is gripped by extreme fear today, with the Fear and Greed Index plummeting to 24. This level of pessimism often signals a potential buying opportunity for contrarian investors. However, it's crucial to approach with caution and conduct thorough research. Remember, market sentiment can shift rapidly. Stay informed, diversify your portfolio, and consider using Gate.com's advanced trading tools to navigate these turbulent waters. As always, only invest what you can afford to lose in this volatile market.
OL Holdings Distribution
The address holdings distribution for OL reveals a highly concentrated ownership structure. The top address holds a staggering 77.99% of the total supply, indicating significant centralization. The subsequent four largest addresses collectively control an additional 15.13%, bringing the total holdings of the top five addresses to 93.12%. This leaves only 6.88% distributed among all other addresses.
Such extreme concentration raises concerns about market manipulation and price volatility. With a single address controlling over three-quarters of the supply, there is potential for significant market impact should this holder decide to liquidate or move large portions of their holdings. This centralization also challenges the notion of decentralization often associated with cryptocurrency projects.
The current distribution pattern suggests a relatively immature market structure for OL, with limited circulation among a broader user base. This concentration could lead to reduced liquidity and increased susceptibility to price swings based on the actions of a few large holders. Investors should be aware of these ownership dynamics when considering OL's market stability and long-term prospects.
Click to view the current OL Holdings Distribution
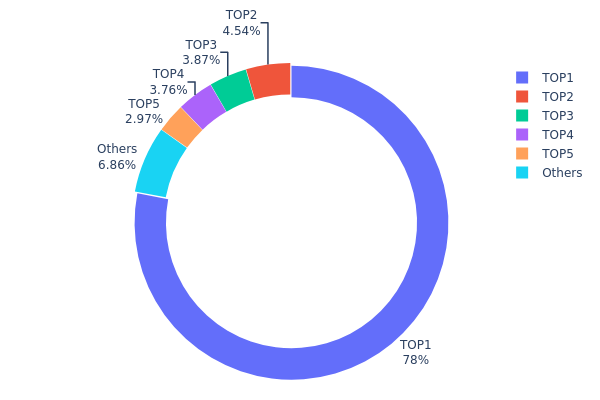
| Top | Address | Holding Qty | Holding (%) |
|---|---|---|---|
| 1 | 0xfc5a...20d8c1 | 3899999.97K | 77.99% |
| 2 | 0x3f16...9844c1 | 227116.91K | 4.54% |
| 3 | 0x4695...fd7d37 | 193474.03K | 3.86% |
| 4 | 0x611f...dfb09d | 188017.93K | 3.76% |
| 5 | 0x3154...0f2c35 | 148552.16K | 2.97% |
| - | Others | 342839.01K | 6.88% |
2. Key Factors Affecting OL's Future Price
Technical Development and Ecosystem Building
- Network Performance Optimization: Continuous improvement of OL's network performance could enhance user experience and attract more developers, potentially driving up the price.
- Partnership Expansion: Establishing new collaborations with businesses and projects could broaden OL's use cases and increase its value proposition.
- Ecosystem Applications: The development of major DApps and ecosystem projects on OL could significantly contribute to its overall growth and price appreciation.
III. OL Price Prediction for 2025-2030
2025 Outlook
- Conservative prediction: $0.01465 - $0.02007
- Neutral prediction: $0.02007 - $0.02238
- Optimistic prediction: $0.02238 - $0.02469 (requires favorable market conditions)
2027-2028 Outlook
- Market stage expectation: Potential growth phase
- Price range forecast:
- 2027: $0.01370 - $0.03733
- 2028: $0.01669 - $0.03305
- Key catalysts: Increased adoption and market expansion
2030 Long-term Outlook
- Base scenario: $0.02010 - $0.03941 (assuming steady market growth)
- Optimistic scenario: $0.03941 - $0.04099 (with strong market performance)
- Transformative scenario: $0.04099+ (under extremely favorable conditions)
- 2030-12-31: OL $0.04099 (potential peak price)
| 年份 | 预测最高价 | 预测平均价格 | 预测最低价 | 涨跌幅 |
|---|---|---|---|---|
| 2025 | 0.02469 | 0.02007 | 0.01465 | 0 |
| 2026 | 0.03133 | 0.02238 | 0.02036 | 11 |
| 2027 | 0.03733 | 0.02685 | 0.0137 | 33 |
| 2028 | 0.03305 | 0.03209 | 0.01669 | 59 |
| 2029 | 0.04625 | 0.03257 | 0.02573 | 62 |
| 2030 | 0.04099 | 0.03941 | 0.0201 | 96 |
IV. OL Professional Investment Strategies and Risk Management
OL Investment Methodology
(1) Long-term Holding Strategy
- Suitable for: Risk-tolerant investors with a long-term perspective
- Operation suggestions:
- Accumulate OL tokens during market dips
- Set price targets for partial profit-taking
- Store tokens in secure hardware wallets
(2) Active Trading Strategy
- Technical analysis tools:
- Moving Averages: Use to identify trends and potential entry/exit points
- Relative Strength Index (RSI): Monitor overbought/oversold conditions
- Key points for swing trading:
- Set stop-loss orders to limit potential losses
- Take profits at predetermined resistance levels
OL Risk Management Framework
(1) Asset Allocation Principles
- Conservative investors: 1-3%
- Aggressive investors: 5-10%
- Professional investors: 10-20%
(2) Risk Hedging Solutions
- Diversification: Spread investments across multiple crypto assets
- Stop-loss orders: Implement to limit potential losses
(3) Secure Storage Solutions
- Hot wallet recommendation: Gate Web3 Wallet
- Cold storage solution: Hardware wallets for long-term holdings
- Security precautions: Enable two-factor authentication, use strong passwords
V. Potential Risks and Challenges for OL
OL Market Risks
- High volatility: OL price may experience significant fluctuations
- Liquidity risk: Limited trading volume may affect ability to enter/exit positions
- Competition: Other Web3 gaming platforms may impact OL's market share
OL Regulatory Risks
- Uncertain regulatory environment: Potential changes in crypto regulations
- Cross-border compliance: Varying regulations across different jurisdictions
- Tax implications: Evolving tax laws related to crypto assets
OL Technical Risks
- Smart contract vulnerabilities: Potential security flaws in the token contract
- Network congestion: Ethereum network issues may affect OL transactions
- Wallet security: Risk of hacks or user errors in storing OL tokens
VI. Conclusion and Action Recommendations
OL Investment Value Assessment
OL presents a high-risk, high-potential opportunity in the Web3 gaming sector. Long-term value lies in the growth of the gaming industry, while short-term risks include market volatility and regulatory uncertainties.
OL Investment Recommendations
✅ Beginners: Start with small positions, focus on education and risk management ✅ Experienced investors: Implement dollar-cost averaging strategy, set clear profit targets ✅ Institutional investors: Consider OL as part of a diversified crypto portfolio, conduct thorough due diligence
OL Trading Participation Methods
- Spot trading: Buy and sell OL tokens on Gate.com
- staking: Participate in staking programs if available
- DeFi integration: Explore decentralized finance options for OL tokens
Cryptocurrency investments carry extremely high risks, and this article does not constitute investment advice. Investors should make decisions carefully based on their own risk tolerance and are advised to consult professional financial advisors. Never invest more than you can afford to lose.
FAQ
Will the price of oil go up or down in 2025?
Oil prices are expected to decline in 2025. Forecasts suggest Brent crude could fall below $60 per barrel by late 2025 due to increased supply and weaker global economic growth.
Where will oil prices be in 5 years?
Oil prices are projected to be around $70.68 per barrel in 5 years, with potential fluctuations based on market conditions.
What is the price prediction for IOT in 2025?
The price prediction for IOT in 2025 ranges from $22.13 to $41.65, based on current market trends and analysis.
Is the price of oil expected to go up?
Yes, oil prices are projected to rise gradually, reaching around $72.40 by mid-2025. Long-term forecasts indicate stable growth in oil prices.
Share
Content