2025 OCT Fiyat Tahmini: Octopus Network’ün Potansiyel Büyümesi ve Piyasa Trendlerinin Analizi


Giriş: OCT'nin Piyasadaki Yeri ve Yatırım Değeri
Omnity Network (OCT), Bitcoin ekosisteminin varlık merkezi olarak, kuruluşundan beri Bitcoin token sahiplerine tamamen zincir üstü ve kullanım kolaylığı sağlayan bir köprü işlevi görmektedir. 2025 yılı itibarıyla OCT’nin piyasa değeri 5.500.000 $’a ulaşmış, yaklaşık 100.000.000 token dolaşımda bulunmakta ve fiyatı 0,055 $ seviyesinde seyretmektedir. “Bitcoin köprü kolaylaştırıcısı” olarak anılan bu varlık, Bitcoin ekosistemindeki birlikte çalışabilirliği güçlendirme konusunda giderek daha kritik bir rol oynamaktadır.
Bu makalede, 2025-2030 yılları arasında OCT’nin fiyat trendleri; tarihsel veriler, piyasa arz-talep dengesi, ekosistem gelişimi ve makroekonomik faktörler ışığında kapsamlı biçimde analiz edilerek yatırımcılara profesyonel fiyat tahminleri ve pratik yatırım stratejileri sunulacaktır.
I. OCT Fiyat Geçmişinin İncelenmesi ve Güncel Piyasa Durumu
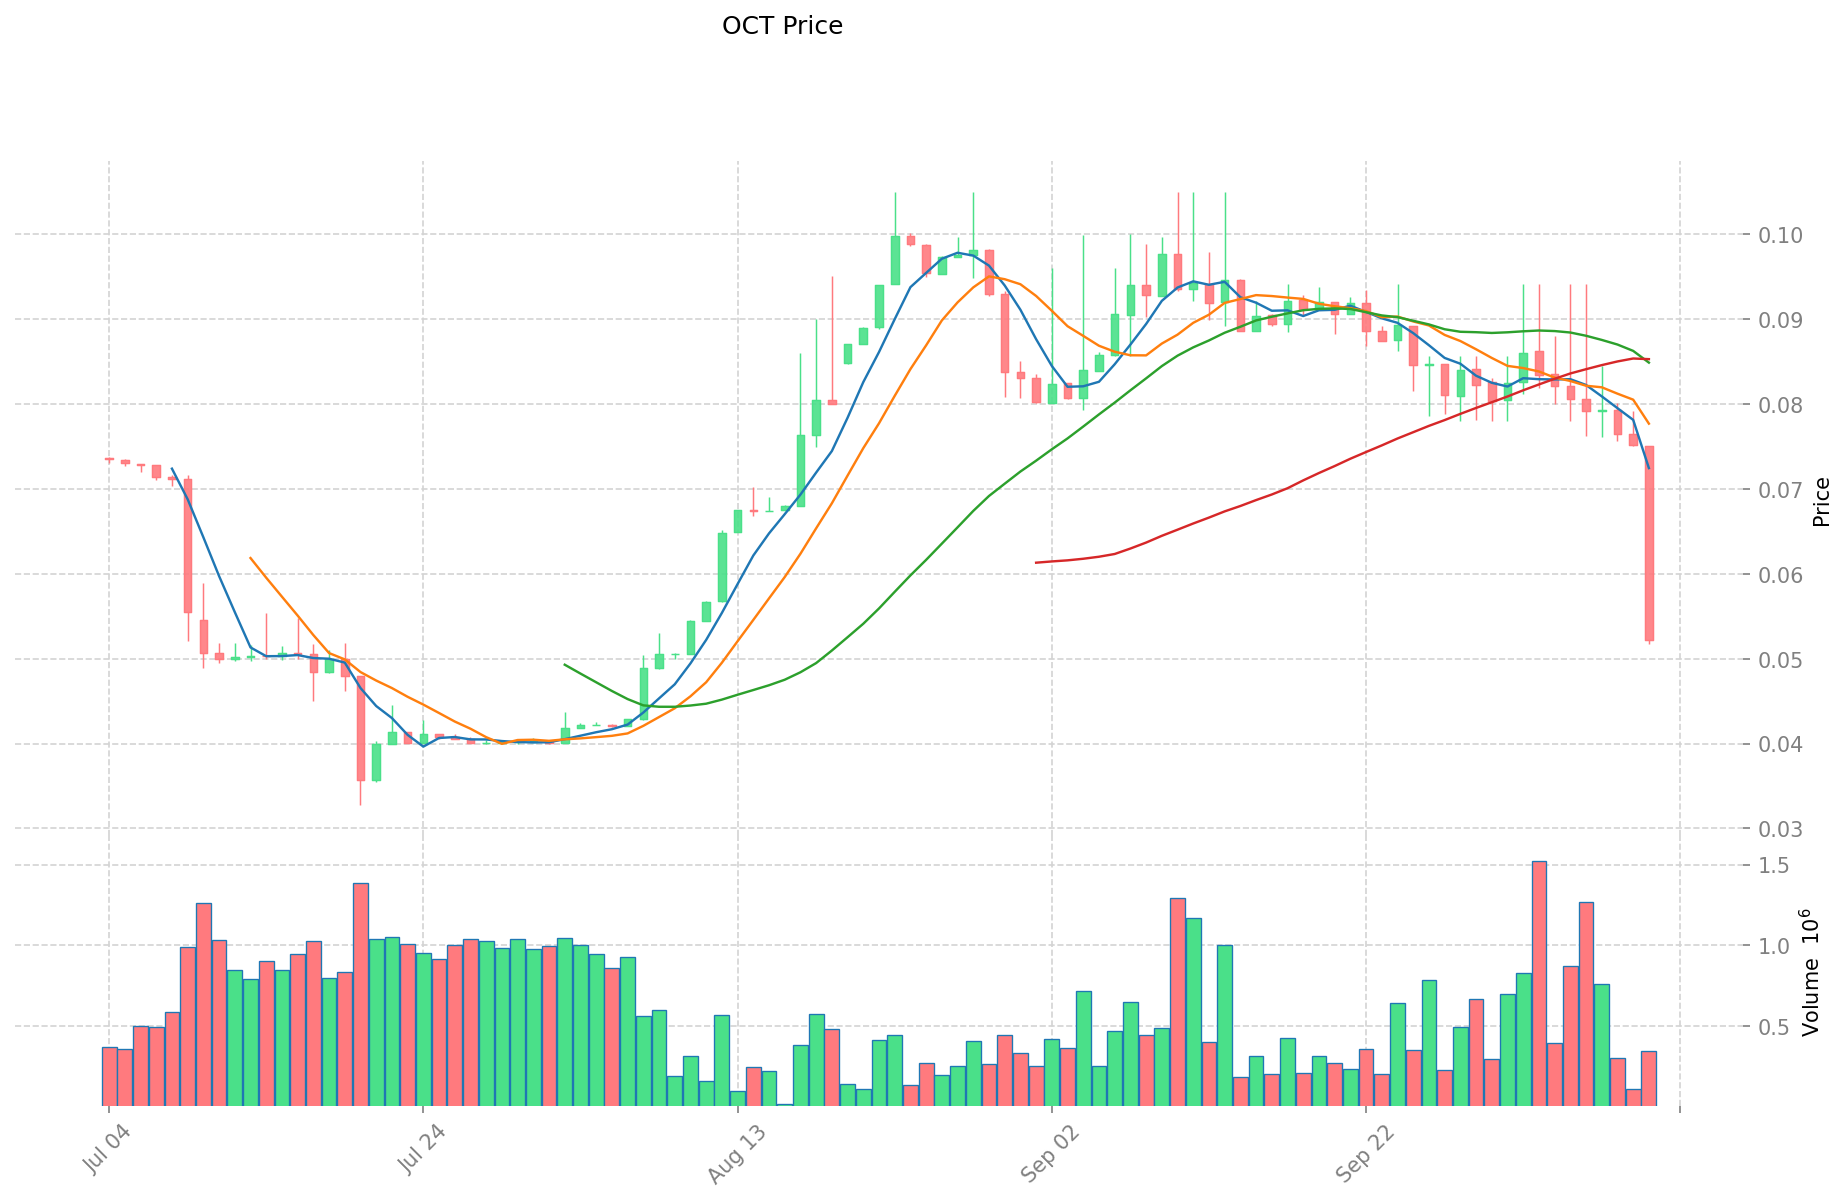
OCT Fiyatının Tarihsel Gelişimi
- 2022: Tüm zamanların en yüksek seviyesi, 17 Ocak’ta 7,02 $
- 2025: Piyasa gerilemesi, 21 Temmuz’da tüm zamanların en düşük seviyesi olan 0,03433201 $
OCT Güncel Piyasa Görünümü
11 Ekim 2025 itibarıyla OCT, 0,055 $ seviyesinden işlem görüyor ve bu, tüm zamanların zirvesine göre %99,22’lik ciddi bir değer kaybına işaret ediyor. Son 24 saatte token %21,41 oranında sert düşüş yaşarken, fiyat 0,05171 $ ila 0,07351 $ bandında hareket etti. Son düşüşlere rağmen, OCT son bir saatte %7,24’lük pozitif bir artış sergiledi.
Piyasa değeri 5.500.000 $ seviyesinde ve OCT’yi genel kripto para piyasasında 1.662’nci sıraya yerleştiriyor. 100.000.000 OCT dolaşımda bulunuyor ve bu rakam aynı zamanda toplam ve maksimum arzı da ifade ettiğinden, token’ın tam seyreltilmiş piyasa değeri mevcut piyasa değeriyle örtüşüyor.
Son 24 saatteki işlem hacmi 27.838,46 $’a ulaştı ve bu, piyasanın orta derecede aktif olduğunu gösteriyor. Token’ın piyasa hakimiyeti %0,00014 ile oldukça düşük, bu da daha geniş kripto piyasasında etkisinin sınırlı olduğunu gösteriyor.
Uzun vadeli fiyat trendleri, çeşitli dönemlerde ciddi düşüşler sergiliyor; son bir haftada %32, son 30 günde %39,93 ve son bir yılda %57,9 oranında azalma kaydedildi.
Güncel OCT piyasa fiyatını görmek için tıklayın
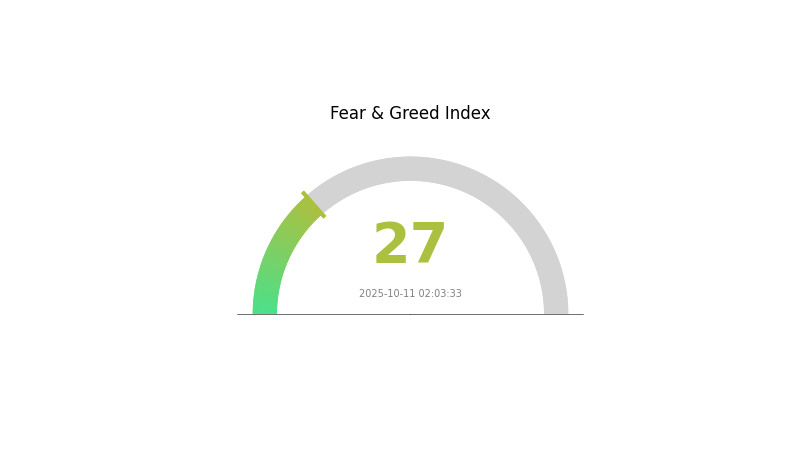
OCT Piyasa Duyarlılığı Göstergesi
11 Ekim 2025 Korku ve Açgözlülük Endeksi: 27 (Korku)
Güncel Korku ve Açgözlülük Endeksi’ni görmek için tıklayın
Kripto para piyasası şu anda korku seviyesinde; Korku ve Açgözlülük Endeksi 27 olarak ölçülüyor. Bu durum, yatırımcıların temkinli davrandığını ve fiyatlarda daha fazla düşüş beklediklerini gösteriyor. Yine de, tecrübeli yatırımcılar için korku dönemleri alım fırsatı yaratabilir. Piyasa duyarlılığı çok hızlı değişebileceğinden, her yatırım öncesinde kapsamlı araştırma yapmak elzemdir. Güncel kalın ve bu belirsiz ortamda riskinizi yönetmek için portföyünüzü çeşitlendirmeyi düşünün.
OCT Varlık Dağılımı
Adres bazlı varlık dağılımı verileri, OCT tokenlarının önemli bir bölümünün birkaç büyük sahip arasında yoğunlaştığını gösteriyor. En büyük adres toplam arzın %28,82’sini, en büyük ikinci sahip ise %21,40’ını kontrol ediyor. İlk beş adres, tüm OCT tokenlarının %64,32’sine sahip ve bu, yüksek düzeyde merkezileşmeye işaret ediyor.
Böylesi bir yoğunlaşma, piyasa manipülasyonu ve fiyat oynaklığı açısından risk oluşturuyor. Tokenların önemli bir kısmının az sayıda elde bulunması, ani büyük satışlar veya koordineli hareketlerle OCT fiyatını ciddi şekilde etkileyebilir. Ayrıca, bu merkezileşme düzeyi, projenin merkezsizleşme iddialarını zayıflatabilir ve OCT token tabanlı bir oylama sistemi kullanılıyorsa yönetişim süreçlerini de etkileyebilir.
Piyasa yapısı bakımından, mevcut dağılım, geniş kullanıcı tabanına yayılmamış görece olgunlaşmamış bir ekosistem işaretidir. Bu durum, likiditeyi kısıtlayabilir ve büyük sahiplerin işlemlerine bağlı olarak fiyat dalgalanmalarını artırabilir. OCT ile ilgili işlem yapmayı düşünen yatırımcı ve traderların bu riskleri göz önünde bulundurması gerekir.
Güncel OCT Varlık Dağılımını görmek için tıklayın
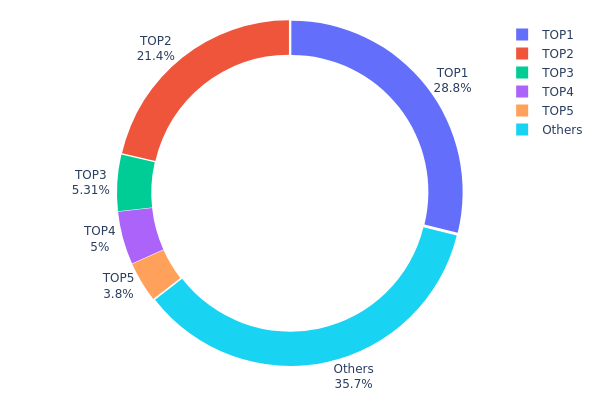
| En Büyük | Adres | Varlık Miktarı | Varlık (%) |
|---|---|---|---|
| 1 | 0x89be...77394d | 28824,20K | 28,82% |
| 2 | 0xe00c...4c85b9 | 21402,00K | 21,40% |
| 3 | 0x4db7...cf632e | 5305,46K | 5,30% |
| 4 | 0xa50f...be86cf | 5000,00K | 5,00% |
| 5 | 0x3686...b6bc1e | 3800,00K | 3,80% |
| - | Diğerleri | 35668,34K | 35,68% |
II. OCT’nin Gelecek Fiyatını Etkileyen Ana Faktörler
Makroekonomik Ortam
- Para Politikası Etkisi: Başlıca merkez bankalarının destekleyici politikalarını sürdürmesi ve ABD Merkez Bankası’nın önümüzdeki dönemde faiz indirimine devam etmesi bekleniyor.
- Enflasyona Karşı Dayanıklılık: OCT, enflasyon endişeleri arttıkça fiyatında yükselişler göstererek enflasyona karşı potansiyel koruma sağlamıştır.
- Jeopolitik Faktörler: Uluslararası gerginlikler ve ekonomik belirsizlikler, yatırımcı duyarlılığı ve OCT’nin güvenli liman varlığı olarak algılanan değerinde etkili olmaya devam ediyor.
Teknik Gelişim ve Ekosistem Oluşumu
- Mevsimsel Eğilimler: Geçmişte Ekim ayı, kripto sektöründe genellikle boğa piyasalarının başlangıcı olmuştur.
- Ekosistem Uygulamaları: DeFi ve diğer blokzincir uygulamalarında OCT’nin artan kullanımı, hem kullanım alanını hem de potansiyel kullanıcı tabanını genişletmektedir.
III. 2025-2030 Dönemi için OCT Fiyat Tahmini
2025 Beklentisi
- Temkinli tahmin: 0,03574 $ – 0,05499 $
- Tarafsız tahmin: 0,05499 $ – 0,06104 $
- İyimser tahmin: 0,06104 $ – 0,07000 $ (güçlü piyasa toparlanması ve artan benimseme gerekli)
2027-2028 Beklentisi
- Piyasa aşaması öngörüsü: Olası konsolidasyon ve kademeli büyüme dönemi
- Fiyat aralığı tahmini:
- 2027: 0,03168 $ – 0,06518 $
- 2028: 0,06053 $ – 0,0725 $
- Kritik itici güçler: Teknolojik gelişmeler, kripto paraların daha geniş kabulü ve potansiyel düzenleyici netlik
2030 Uzun Vadeli Beklenti
- Temel senaryo: 0,07252 $ – 0,08500 $ (istikrarlı piyasa büyümesi varsayımıyla)
- İyimser senaryo: 0,09428 $ – 0,10000 $ (güçlü piyasa koşulları ve artan OCT kullanımıyla)
- Dönüştürücü senaryo: 0,10000 $ – 0,12000 $ (çığır açan gelişmeler ve yaygın benimseme ile)
- 31 Aralık 2030: OCT 0,09428 $ (iyimser beklentilerle olası tepe fiyat)
| Yıl | Tahmini En Yüksek Fiyat | Tahmini Ortalama Fiyat | Tahmini En Düşük Fiyat | Değişim (%) |
|---|---|---|---|---|
| 2025 | 0,06104 | 0,05499 | 0,03574 | 0 |
| 2026 | 0,06382 | 0,05801 | 0,03365 | 5 |
| 2027 | 0,06518 | 0,06092 | 0,03168 | 10 |
| 2028 | 0,0725 | 0,06305 | 0,06053 | 14 |
| 2029 | 0,07726 | 0,06778 | 0,05829 | 23 |
| 2030 | 0,09428 | 0,07252 | 0,05149 | 31 |
IV. OCT İçin Profesyonel Yatırım Stratejileri ve Risk Yönetimi
OCT Yatırım Metodolojisi
(1) Uzun Vadeli Tutma Stratejisi
- Kimler için uygun: Uzun vadeli bakış açısına sahip, risk toleransı yüksek yatırımcılar
- Uygulama önerileri:
- Piyasa geri çekilmelerinde OCT biriktirin
- Kısmi kâr alımı için fiyat hedefleri belirleyin
- Token’ları güvenli, şahsi cüzdanlarda saklayın
(2) Aktif Alım-Satım Stratejisi
- Teknik analiz araçları:
- Hareketli Ortalamalar: Trendleri ve potansiyel döngüleri tespit edin
- RSI: Aşırı alım/aşırı satım noktalarını izleyin
- Dalgalı işlem için önemli noktalar:
- Bitcoin ekosistemi gelişmelerini izleyin
- Riski kontrol altına almak için zarar durdur seviyeleri belirleyin
OCT Risk Yönetim Yapısı
(1) Varlık Dağılımı İlkeleri
- Temkinli yatırımcı: %1-3
- Aggresif yatırımcı: %5-10
- Profesyonel yatırımcı: En fazla %15
(2) Riskten Korunma Yöntemleri
- Çeşitlendirme: Yatırımları farklı kripto varlıklara yaymak
- Zarar durdur emirleri: Borsadaki işlemlerde potansiyel kayıpları sınırlamak
(3) Güvenli Saklama Yöntemleri
- Sıcak cüzdan önerisi: Gate web3 cüzdan
- Soğuk cüzdan: Uzun vadeli saklama için donanım cüzdanı
- Güvenlik önlemleri: İki faktörlü kimlik doğrulama ve özel anahtarların güvenli yedeği
V. OCT’ye Yönelik Potansiyel Riskler ve Zorluklar
OCT Piyasa Riskleri
- Yüksek volatilite: Kripto piyasalarında sık yaşanan büyük fiyat dalgalanmaları
- Kısıtlı likidite: Büyük işlemler sırasında karşılaşılabilecek zorluklar
- Bitcoin ile korelasyon: OCT fiyatı genel kripto piyasası eğilimlerinden etkilenebilir
OCT Regülasyon Riskleri
- Belirsiz regülasyon ortamı: Kripto varlıklara yönelik daha sıkı düzenleme ihtimali
- Sınır ötesi kısıtlamalar: Farklı ülkelerde değişen hukuki statü
- Uyum sorunları: KYC/AML gerekliliklerindeki değişiklikler
OCT Teknik Riskler
- Akıllı sözleşme açıkları: OCT token sözleşmesinde olası güvenlik açıkları
- Ağ tıkanıklığı: Yüksek aktivite dönemlerinde işlemlerde gecikmeler
- Birlikte çalışabilirlik sorunları: Zincirler arası transferlerde yaşanabilecek riskler
VI. Sonuç ve Eylem Tavsiyeleri
OCT Yatırım Değeri Analizi
OCT, Bitcoin ekosisteminde köprü varlık olarak spekülatif bir fırsat sunar ve uzun vadede değer potansiyeline sahiptir. Yatırımcılar, kısa vadeli yüksek volatilite ve regülasyon risklerinin bilincinde olmalıdır.
OCT Yatırım Tavsiyeleri
✅ Yeni başlayanlar: Kripto portföyünüzü çeşitlendirirken küçük oranlarla değerlendirin
✅ Tecrübeli yatırımcılar: Sıkı risk yönetimiyle ortalama maliyetle alım uygulayın
✅ Kurumsal yatırımcılar: Kapsamlı analizle OCT’yi Bitcoin ekosistemine maruziyet için değerlendirin
OCT İşlem Katılım Yöntemleri
- Spot alım-satım: Gate.com spot piyasasında OCT alım satımı
- Limit emirleri: Giriş ve çıkış fiyatınızı belirleyerek işlemleri otomatikleştirin
- OCT staking: Pasif gelir için mevcutsa stake programlarına katılım
Kripto para yatırımları çok yüksek risk içerir ve bu makale yatırım tavsiyesi değildir. Yatırımcılar kararlarını kendi risk profillerine göre vermeli ve profesyonel finansal danışmanlardan görüş almalıdır. Kaybetmeyi göze alabileceğinizden fazlasını asla yatırım yapmayın.
SSS
Orchid Coin’in geleceği var mı?
Evet, Orchid Coin’in geleceği umut vaat ediyor. Tahminler, değerinin 2030’da 0,061026 $ ve 2050’de 0,161919 $’a ulaşabileceğini ve uzun vadeli büyüme potansiyeli taşıdığını gösteriyor.
Octopus Energy’nin ilerideki hisse fiyatı ne olacak?
Analist görüşlerine göre Octopus Energy’nin gelecekteki hisse fiyatı 85,00p olup, bu rakam son kapanış fiyatının %33,02 üzerindedir.
Ethereum 50.000 $ seviyesine ulaşır mı?
Ethereum’un kısa vadede 50.000 $’a ulaşması beklenmiyor. Piyasa eğilimleri ve uzman analizleri, ETH için daha ılımlı bir fiyat seyri öngörüyor.
DOT 1.000 $’ı görebilir mi?
Bu mümkün olsa da, DOT’un 1.000 $’a ulaşması oldukça spekülatif. Mevcut piyasa koşulları ve projeksiyonlar, uzun vadede olası olsa da kesinlik taşımadığını gösteriyor.
Share
Content
Giriş: OCT'nin Piyasadaki Yeri ve Yatırım Değeri
I. OCT Fiyat Geçmişinin İncelenmesi ve Güncel Piyasa Durumu
II. OCT’nin Gelecek Fiyatını Etkileyen Ana Faktörler
III. 2025-2030 Dönemi için OCT Fiyat Tahmini
IV. OCT İçin Profesyonel Yatırım Stratejileri ve Risk Yönetimi
V. OCT’ye Yönelik Potansiyel Riskler ve Zorluklar
VI. Sonuç ve Eylem Tavsiyeleri
SSS
How to Buy Cryptocurrency


Trending Cryptocurrencies


2025 TBC Fiyat Tahmini: Benimsenme Hızla Artarken ve Piyasa Olgunlaşırken Yükseliş Eğilimi Öne Çıkıyor
2025'in En İyi Bitcoin Staking Platformları: Yüksek Getiri ve Güvenlik Analizi

BTC staking nedir: 2025'te Bitcoin staking getirileri ve risklerinin analizi

Bitcoin Cash (BCH) Fiyat Analizi ve 2025 Yatırım Görünümü

Trump'un Kripto Varlıklar üzerindeki para politikası: 2025'te dijital varlıklar üzerindeki etkisi

2025 BTC Fiyat Tahmini: Bitcoin’i Yeni Zirvelere Taşıyabilecek Makroekonomik Faktörlerin ve Piyasa Döngülerinin Analizi
Dropee Günlük Kombinasyonu 12 Aralık 2025
Tomarket Günlük Kombinasyonu 12 Aralık 2025

SEI Airdrop Ödülleri’ne Katılım ve Talep Etme Kılavuzu

Kripto para birimlerinde algoritmik alım satım için etkili stratejiler
Stock-to-Flow Model ile Bitcoin'in Değerlemesini Anlamak