2025 MLPrice Tahmini: Hızla değişen teknoloji dünyasında makine öğrenimi maliyetlerinin geleceğini öngörmek ve yönlendirmek


Giriş: ML'nin Piyasadaki Konumu ve Yatırım Potansiyeli
Mintlayer (ML), Bitcoin üzerinde merkeziyetsiz finansı mümkün kılan bir layer 2 protokolü olarak, kurulduğu günden bu yana dikkat çekici ilerlemeler kaydetmiştir. 2025 yılı itibarıyla Mintlayer'ın piyasa değeri 7.311.857 ABD Doları'na ulaşırken, dolaşımdaki yaklaşık 201.262.246 token ile fiyatı 0,03633 ABD Doları civarında seyretmektedir. "Bitcoin DeFi sağlayıcısı" olarak bilinen bu varlık, Bitcoin ekosisteminin olanaklarını genişletmede giderek daha kritik bir rol üstlenmektedir.
Bu makalede, Mintlayer'ın 2025-2030 yılları arasındaki fiyat hareketleri, tarihsel eğilimler, piyasa arz-talep dengesi, ekosistem gelişimi ve makroekonomik faktörler çerçevesinde detaylı olarak analiz edilerek, yatırımcılar için profesyonel fiyat tahminleri ve uygulanabilir yatırım stratejileri sunulacaktır.
I. ML Fiyat Geçmişi İncelemesi ve Mevcut Piyasa Durumu
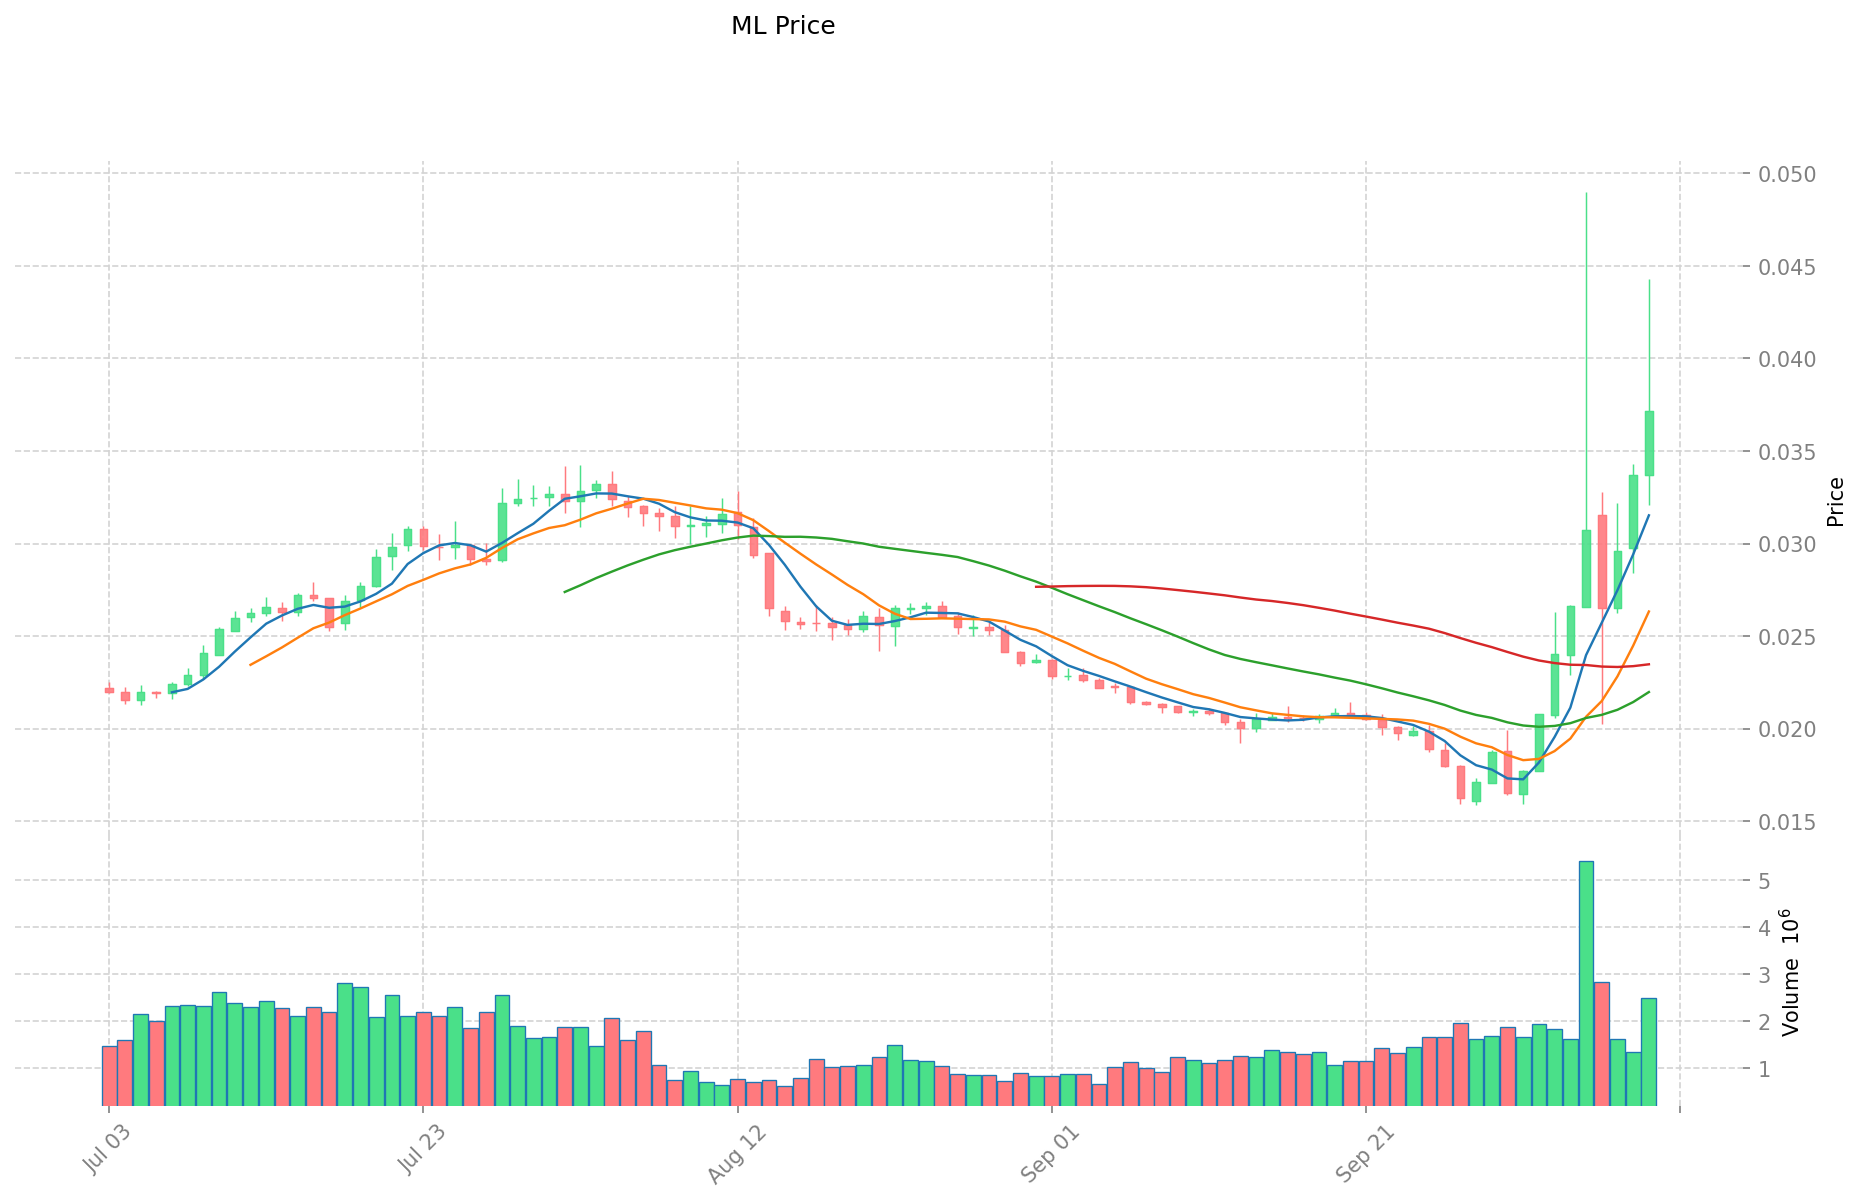
ML Tarihsel Fiyat Gelişimi
- 2024: ML, 11 Ocak'ta 0,99989 ABD Doları ile tüm zamanların en yüksek seviyesine ulaşarak proje açısından önemli bir kilometre taşı kaydetti.
- 2025: Piyasa düşüşünde ML, 28 Eylül'de 0,01585 ABD Doları ile tüm zamanların en düşük seviyesini gördü.
- 2025: Son toparlanmayla birlikte, fiyat 10 Ekim'de 0,03633 ABD Doları seviyesine çıktı.
ML Güncel Piyasa Durumu
10 Ekim 2025 tarihi itibarıyla ML, 0,03633 ABD Doları seviyesinde işlem görüyor ve son 24 saatte %9,89 artış kaydetti. Token, son hafta ve ayda sırasıyla %74,78 ve %73,61 oranında güçlü yükseliş gösterdi. Ancak ML, bir yıl öncesine göre hâlâ %74,39 oranında değer kaybında.
Piyasa değeri şu anda 7.311.857 ABD Doları ve ML, kripto para piyasasında 1571. sırada yer alıyor. Dolaşımdaki ML token miktarı 201.262.246,69 olup, toplam arzın %33,54'ünü oluşturuyor; bu da projede token dağıtımı için daha fazla alan olduğunu gösteriyor.
ML'nin son 24 saatlik işlem hacmi 94.124,67 ABD Doları olup, orta seviyede piyasa hareketliliğine işaret ediyor. Tokenın en yüksek fiyatı 0,99989 ABD Doları ile 11 Ocak 2024'te, en düşük fiyatı ise 0,01585 ABD Doları ile 28 Eylül 2025'te gerçekleşti.
Son fiyat hareketi, kullanıcıların Mintlayer'ın layer 2 protokolü sayesinde atomik takaslarla yerel Bitcoin üzerinden merkeziyetsiz finans ekosistemleri kurmasına olan ilginin arttığını gösteriyor.
Güncel ML piyasa fiyatını görüntülemek için tıklayın
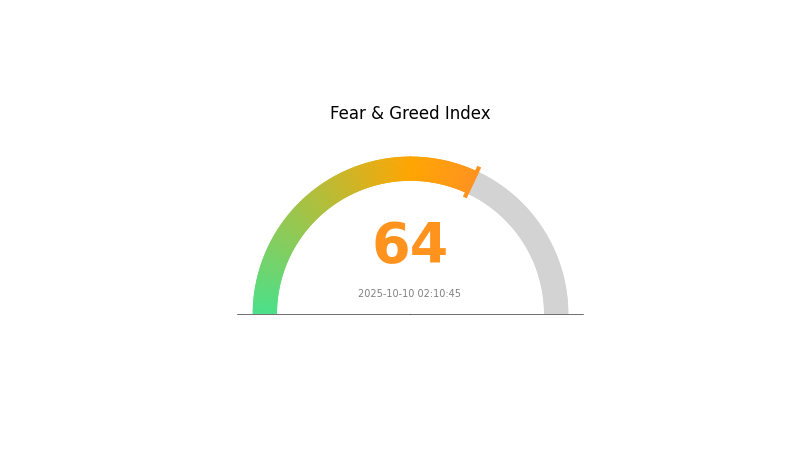
ML Piyasa Duyarlılığı Göstergesi
10 Ekim 2025 Korku ve Açgözlülük Endeksi: 64 (Açgözlülük)
Güncel Korku & Açgözlülük Endeksini görüntülemek için tıklayın
Kripto piyasasında coşku hakim; Korku ve Açgözlülük Endeksi'nin 64 seviyesine çıkması, yatırımcıların iyimserliğinin arttığını ve fiyatların daha fazla yükselebileceğini gösteriyor. Ancak tecrübeli yatırımcılar, piyasa aşırı olumlu olduğunda düzeltme riskinin yükseldiğini bildiğinden, bu dönemlerde temkinli davranmayı tercih ediyor. Duygularınızın kararlarınıza yön vermesine izin vermeyin; portföyünüzü ve risk yönetimi stratejilerinizi bu yükseliş eğilimine göre gözden geçirin.
ML Varlık Dağılımı
Adres bazında varlık dağılımı, ML tokenlarının cüzdanlar arasında ne kadar yoğunlaştığını gösterir. Analizler, oldukça merkeziyetçi bir yapı olduğunu ortaya koyuyor. En yüksek varlığa sahip adres ML tokenlarının %48,77'sine sahipken, ikinci adres %21,52'lik payı kontrol ediyor. Bu iki adresin toplamda arzın %70'inden fazlasına sahip olması, ciddi bir sahiplik konsantrasyonuna işaret ediyor.
Böyle bir yoğunlaşma, piyasa istikrarı ve fiyat manipülasyonu riskini artırıyor. Tokenların büyük bölümünün birkaç cüzdanda bulunması, önemli bir hareketlilik ya da satış halinde fiyatlarda aşırı dalgalanmalara yol açabilir. Ayrıca, bu merkezileşme, kripto paraların ademi merkeziyetçilik ilkesine ters düşerek yatırımcı güvenini ve ML'nin piyasa yapısını zayıflatabilir.
Mevcut dağılım, ML'nin ideal merkeziyetsizlik düzeyinden uzak olduğunu ve uzun vadeli sürdürülebilirlik ile benimsenmeyi olumsuz etkileyebileceğini gösteriyor. Küçük yatırımcıların payı (%21,68 "Diğerleri" tarafından tutulmakta) bir miktar dağılım olduğunu gösterse de, üst adreslerin hakimiyeti, piyasada dayanıklılığı artıracak ve manipülasyon riskini azaltacak yeni dağıtım mekanizmalarının gerekliliğine işaret ediyor.
Güncel ML Varlık Dağılımını görüntülemek için tıklayın
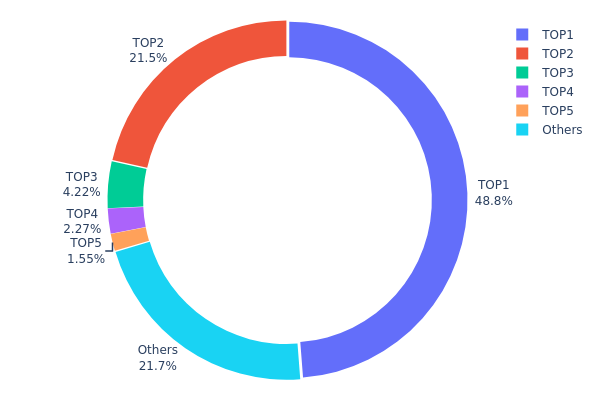
| En Büyük | Adres | Varlık Miktarı | Varlık (%) |
|---|---|---|---|
| 1 | 0x0599...434cc6 | 195.081,17K | 48,77% |
| 2 | 0xe03a...ea283f | 86.099,82K | 21,52% |
| 3 | 0x3cc9...aecf18 | 16.890,40K | 4,22% |
| 4 | 0x1ab4...8f8f23 | 9.062,15K | 2,26% |
| 5 | 0x0d07...b492fe | 6.211,86K | 1,55% |
| - | Diğerleri | 86.654,60K | 21,68% |
II. ML'nin Gelecek Fiyatını Etkileyen Temel Unsurlar
Arz Mekanizması
- Sabit Arz: ML'nin maksimum arzı sabittir ve bu kıtlık, uzun vadeli fiyat artışını destekleyebilir.
Kurumsal ve Büyük Yatırımcı Dinamikleri
- Kurumsal Entegrasyon: Yenilikçi şirketler, makine öğrenimi ve yapay zeka projelerinde ML entegrasyonunu değerlendirmektedir.
Makroekonomik Ortam
- Enflasyona Karşı Koruma: Yeni nesil teknoloji tokenı olan ML, enflasyonist dönemlerde alternatif varlık arayan yatırımcıların ilgisini çekebilir.
Teknolojik Gelişim ve Ekosistem İnşası
- Yapay Zeka Entegrasyonu: ML'de devam eden yapay zeka iyileştirmeleri, kullanım alanlarını artırıp daha fazla kullanıcı ve geliştiriciyi sisteme çekebilir.
- Ekosistem Uygulamaları: ML platformunda, çeşitli sektörlerde yapay zekadan güç alan DApp ve projeler geliştirilmektedir.
III. ML 2025-2030 Fiyat Tahmini
2025 Görünümü
- Temkinli tahmin: 0,02938 - 0,03627 ABD Doları
- Tarafsız tahmin: 0,03627 - 0,04461 ABD Doları
- İyimser tahmin: 0,04461 - 0,05295 ABD Doları (güçlü piyasa toparlanması ve artan kullanıcı benimsenmesi ile)
2027 Orta Vadeli Görünüm
- Piyasa beklentisi: Orta seviyede büyüme ile konsolidasyon evresi
- Fiyat aralığı tahmini:
- 2026: 0,04149 - 0,05175 ABD Doları
- 2027: 0,03324 - 0,07131 ABD Doları
- Kilit tetikleyiciler: Teknolojik ilerlemeler, yeni kullanım alanları ve genel kripto piyasası eğilimleri
2030 Uzun Vadeli Görünüm
- Temel senaryo: 0,06251 - 0,07354 ABD Doları (istikrarlı büyüme ve benimsenme ile)
- İyimser senaryo: 0,07354 - 0,07868 ABD Doları (hızlı entegrasyon ve olumlu regülasyon ortamı ile)
- Dönüştürücü senaryo: 0,07868 - 0,08554 ABD Doları (çığır açan uygulamalar ve ana akım entegrasyon ile)
- 31 Aralık 2030: ML 0,07354 ABD Doları (2025 seviyesine göre %102 artış)
| Yıl | En Yüksek Tahmin | Ortalama Tahmin | En Düşük Tahmin | Artış Oranı |
|---|---|---|---|---|
| 2025 | 0,05295 | 0,03627 | 0,02938 | 0 |
| 2026 | 0,05175 | 0,04461 | 0,04149 | 22 |
| 2027 | 0,07131 | 0,04818 | 0,03324 | 32 |
| 2028 | 0,06333 | 0,05974 | 0,05496 | 64 |
| 2029 | 0,08554 | 0,06154 | 0,03815 | 69 |
| 2030 | 0,07868 | 0,07354 | 0,06251 | 102 |
IV. ML Profesyonel Yatırım Stratejileri ve Risk Yönetimi
ML Yatırım Metodolojisi
(1) Uzun Vadeli Tutma Stratejisi
- Uygun yatırımcı profili: Uzun vadeli yatırımcılar ve Bitcoin ekosistemine inananlar
- Uygulama önerileri:
- Piyasa geri çekilmelerinde ML token biriktirin
- Tokenları donanım cüzdanında güvenle saklayın
- Proje gelişmelerini düzenli olarak takip edin
(2) Aktif Alım-Satım Stratejisi
- Teknik analiz araçları:
- Hareketli Ortalamalar: Trend ve dönüş noktalarını belirlemek için
- Göreli Güç Endeksi (RSI): Aşırı alım veya aşırı satım durumlarını görmek için
- Dalgalı alım-satım için önemli noktalar:
- Bitcoin fiyat hareketlerini izleyin; ML fiyatını etkileyebilir
- Zarar durdur emirleriyle riskleri yönetin
ML Risk Yönetimi Çerçevesi
(1) Varlık Dağılımı İlkeleri
- Temkinli yatırımcılar: Kripto portföyünün %1-3'ü
- Agresif yatırımcılar: %5-10 arası
- Profesyonel yatırımcılar: %15'e kadar
(2) Riskten Korunma Yöntemleri
- Çeşitlendirme: Varlıkları farklı kripto paralara dağıtın
- Zarar durdur emirleri: Olası kayıpları sınırlandırmak için kullanın
(3) Güvenli Saklama Seçenekleri
- Sıcak cüzdan: Gate Web3 Cüzdan
- Soğuk depolama: Uzun vadeli tutum için donanım cüzdanları
- Güvenlik önlemleri: İki faktörlü doğrulama, güçlü parola kullanımı
V. ML Potansiyel Riskler ve Zorluklar
ML Piyasa Riskleri
- Oynaklık: Kripto piyasasında yaygın aşırı fiyat dalgalanmaları
- Likidite: Sınırlı işlem hacmi fiyat istikrarını etkileyebilir
- Bitcoin ile Korelasyon: ML fiyatı büyük ölçüde Bitcoin hareketlerinden etkilenir
ML Düzenleyici Riskler
- Düzenleyici belirsizlik: Layer 2 çözümleriyle ilgili yeni düzenlemelerin olasılığı
- Sınır ötesi uyum: Farklı ülkelerde değişen regülasyonlar
- Vergi etkisi: Kripto varlıklar ve DeFi faaliyetleri için değişen vergi mevzuatı
ML Teknik Riskler
- Akıllı kontrat açıkları: Protokolde olası hata veya açıklar
- Ölçeklenebilirlik sorunları: Artan işlem hacmini yönetmede kısıtlar
- Birlikte çalışabilirlik sorunları: Diğer blokzincirlerle uyum problemleri
VI. Sonuç ve Öneriler
ML Yatırım Değeri Değerlendirmesi
Mintlayer, Bitcoin için layer 2 çözümü olarak özgün bir değer sunmakta ve uzun vadeli büyüme potansiyeli taşımaktadır. Ancak kısa vadede piyasa oynaklığı ve düzenleyici belirsizlikler önemli riskler olarak öne çıkıyor.
ML Yatırım Önerileri
✅ Yeni başlayanlar: Küçük pozisyonlarla başlayıp teknolojiyi öğrenmeye odaklanın ✅ Deneyimli yatırımcılar: Tutma ve aktif al-sat stratejilerini dengeleyin ✅ Kurumsal yatırımcılar: Kapsamlı analiz yaparak ML'yi çeşitlendirilmiş kripto portföyüne dahil etmeyi değerlendirin
ML İşlem Katılım Yöntemleri
- Spot alım-satım: Gate.com üzerinden ML token alış satış işlemleri
- Staking: Uygunsa stake programlarına katılın ve pasif gelir elde edin
- DeFi entegrasyonu: Mintlayer ağında merkeziyetsiz finans seçeneklerini keşfedin
Kripto para yatırımları son derece yüksek risk taşır ve bu makale yatırım tavsiyesi niteliği taşımamaktadır. Yatırımcılar kararlarını kendi risk toleranslarına göre vermeli ve profesyonel finans danışmanlarına başvurmalıdır. Asla kaybetmeyi göze alabileceğinizden fazlasını yatırmayın.
Sıkça Sorulan Sorular
ML hisse senedi fiyatlarını tahmin edebilir mi?
ML, desen ve trend analizi yapabilir; fakat piyasa karmaşıklığı ve öngörülemezliği nedeniyle hisse fiyatlarında kesin tahmin sunamaz.
ML tahmini nedir?
ML tahmini, geçmiş veriler ve piyasa trendlerini analiz eden makine öğrenimi algoritmalarının kripto para fiyatlarını öngörmesidir.
ML'de tahmin nedir?
ML'de tahmin, algoritmanın geçmiş veri desenlerinden geleceğe yönelik sonuçları öngörmesidir; istatistiksel modellerle trend, değer veya sınıflandırma tahmin edilir.
Fiyat tahmini için en iyi ML algoritması hangisidir?
LSTM (Long Short-Term Memory) ağları, zaman serisi verilerindeki uzun vadeli ilişkileri yakalama becerisiyle kripto para fiyat tahmininde genellikle en başarılı algoritmadır.
Share
Content
Giriş: ML'nin Piyasadaki Konumu ve Yatırım Potansiyeli
I. ML Fiyat Geçmişi İncelemesi ve Mevcut Piyasa Durumu
II. ML'nin Gelecek Fiyatını Etkileyen Temel Unsurlar
III. ML 2025-2030 Fiyat Tahmini
IV. ML Profesyonel Yatırım Stratejileri ve Risk Yönetimi
V. ML Potansiyel Riskler ve Zorluklar
VI. Sonuç ve Öneriler
Sıkça Sorulan Sorular
How to Buy Cryptocurrency


Trending Cryptocurrencies


2025 HYPER Fiyat Tahmini: Dijital varlık için piyasa trendleri ve gelecekteki büyüme potansiyeli analiz ediliyor
Zincir üstü veriler, Merlin Chain’in 3 milyar dolar TVL büyümesini nasıl gösteriyor?

Merlin Chain’in zincir üstü verileri, Bitcoin Layer 2’nin benimsenme eğilimlerini nasıl gözler önüne seriyor?

2025 yılında On-Chain veri analizi, Merlin Chain'in büyümesini nasıl gösteriyor?

Bitcoin Taproot Yükseltmesinin Avantajlarını İncelemek

Dropee Günlük Kombinasyonu 11 Aralık 2025

Tomarket Günlük Kombinasyonu 11 Aralık 2025

Merkeziyetsiz Finans'ta Geçici Kayıp Nedir?

Kripto Parada Çifte Harcama: Önleme Stratejileri

Kripto Ticaretinde Wyckoff Yönteminin Anlaşılması