2025 ME Price Prediction: Analyzing Market Trends and Potential Growth Factors for Middle East Oil
Introduction: ME's Market Position and Investment Value
Magic Eden (ME), as the largest NFT marketplace and Runes platform, has achieved significant milestones since its inception. As of 2025, Magic Eden's market capitalization has reached $72,303,172, with a circulating supply of approximately 167,136,322 tokens, and a price hovering around $0.4326. This asset, often referred to as the "cross-chain ecosystem super Dapp," is playing an increasingly crucial role in facilitating seamless multi-chain asset transactions.
This article will comprehensively analyze Magic Eden's price trends from 2025 to 2030, combining historical patterns, market supply and demand, ecosystem development, and macroeconomic factors to provide investors with professional price predictions and practical investment strategies.
I. ME Price History Review and Current Market Status
ME Historical Price Evolution Trajectory
- 2024: Launch of ME token, price reached all-time high of $30 on December 10
- 2025: Major market downturn, price dropped to all-time low of $0.1538 on October 10
ME Current Market Situation
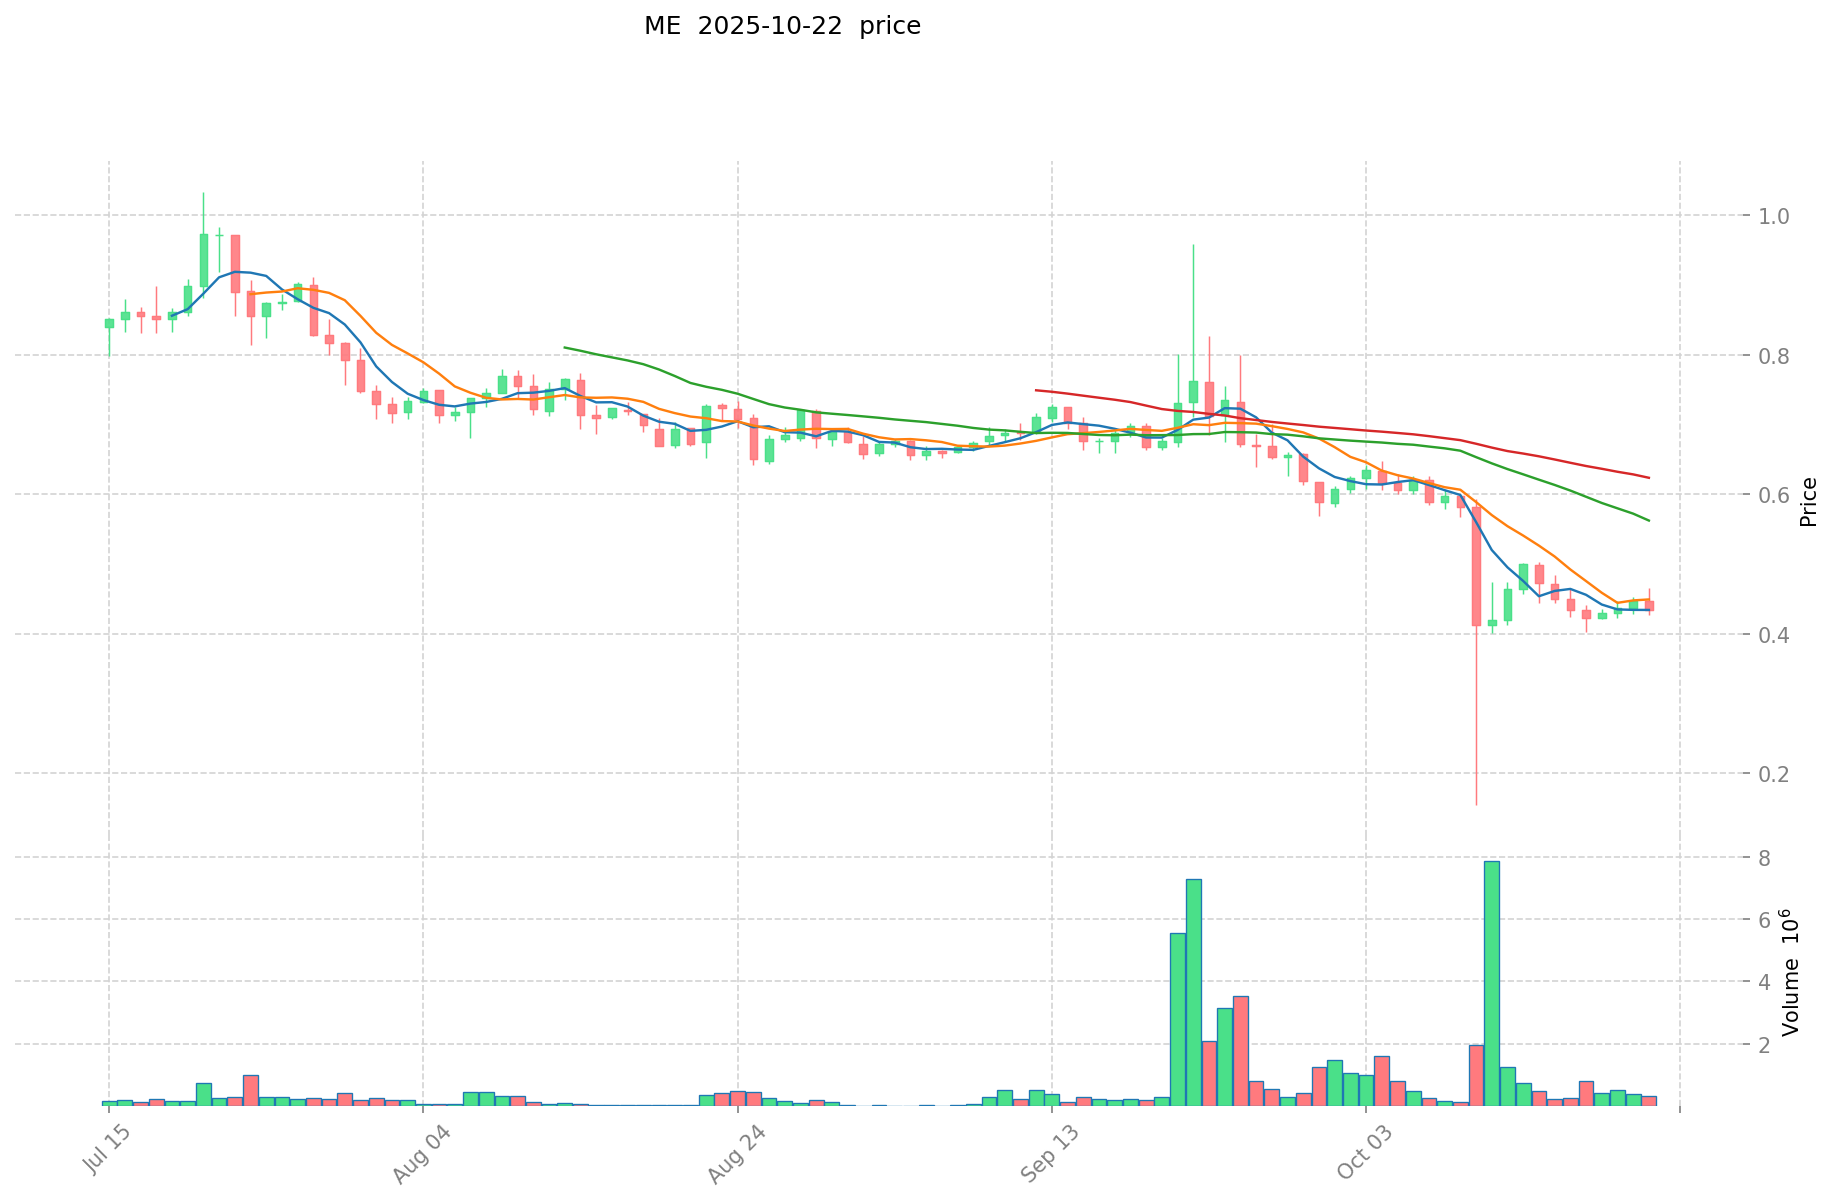
As of October 22, 2025, ME is trading at $0.4326, representing a significant decline of 96.17% from its all-time high. The token has experienced a steep downtrend over the past year, with recent price movements showing continued bearish momentum:
- 24-hour change: -2.55%
- 7-day change: -8.3%
- 30-day change: -53.11%
ME's market capitalization currently stands at $72,303,172, ranking it 491st among all cryptocurrencies. The circulating supply is 167,136,322 ME tokens, which accounts for 16.71% of the total supply of 1 billion tokens.
Trading volume in the last 24 hours reached $146,950, indicating moderate market activity. The current price is closer to the recent all-time low than the all-time high, suggesting persistent selling pressure in the market.
Click to view the current ME market price
ME Market Sentiment Index
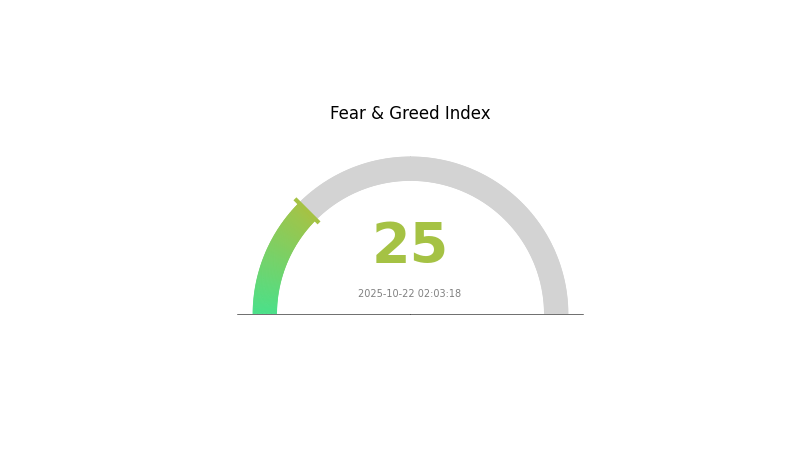
2025-10-22 Fear and Greed Index: 25 (Extreme Fear)
Click to view the current Fear & Greed Index
The crypto market is gripped by extreme fear today, with the sentiment index plummeting to 25. This level of anxiety often signals a potential buying opportunity for contrarian investors. However, it's crucial to approach with caution and conduct thorough research. Remember, market sentiment can shift rapidly. Stay informed, diversify your portfolio, and consider using Gate.com's advanced tools to navigate these turbulent waters. As always, never invest more than you can afford to lose in this volatile market.
ME Holdings Distribution
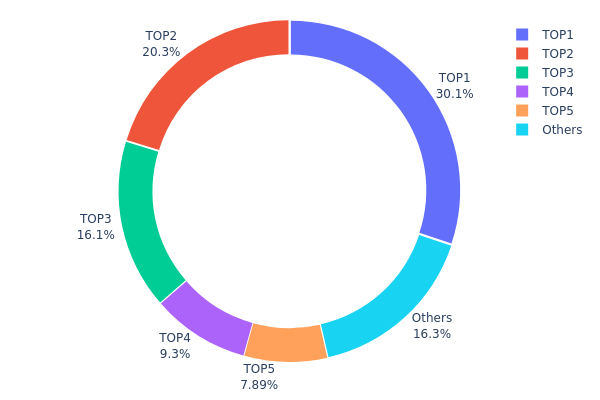
The address holdings distribution data for ME reveals a highly concentrated ownership structure. The top 5 addresses collectively control 83.69% of the total supply, with the largest holder possessing 30.12% of all tokens. This level of concentration raises concerns about potential market manipulation and centralized control.
The second and third largest holders own 20.26% and 16.13% respectively, further emphasizing the concentrated nature of ME's distribution. Such a top-heavy structure could lead to increased price volatility, as large holders have the potential to significantly impact market dynamics through their trading activities. The remaining 16.31% distributed among other addresses suggests a limited degree of broader market participation.
This concentrated distribution pattern indicates a low level of decentralization for ME, which may pose risks to its long-term stability and adoption. Potential investors should be aware that such concentration could lead to price fluctuations and governance challenges, as decisions may be disproportionately influenced by a small number of large stakeholders.
Click to view the current ME Holdings Distribution
| Top | Address | Holding Qty | Holding (%) |
|---|---|---|---|
| 1 | AzcBxq...SA91jn | 301224.48K | 30.12% |
| 2 | AcG5pZ...NPmdXJ | 202667.40K | 20.26% |
| 3 | FcfYR3...H7vuLX | 161326.71K | 16.13% |
| 4 | 32WMXy...2PHzkw | 92994.33K | 9.29% |
| 5 | 7ooPG7...WzGhUr | 78907.08K | 7.89% |
| - | Others | 162875.76K | 16.31% |
II. Key Factors Affecting ME's Future Price
Supply Mechanism
- Current Impact: The expected increase in supply may put downward pressure on the price.
Institutional and Whale Dynamics
- National Policies: Geopolitical risks and resource nationalism are factors worth noting.
Macroeconomic Environment
- Monetary Policy Impact: The Federal Reserve's monetary policy direction is one of the most important uncertainties affecting commodity market trends this year.
- Inflation Hedging Properties: The current US inflation remains sticky, which may influence ME's price.
- Geopolitical Factors: Global geopolitical risk index remains significantly higher than the average level since the 2008 financial crisis.
Technological Development and Ecosystem Building
- Ecosystem Applications: The expansion of new energy industries may drive the market for certain metals.
III. ME Price Prediction for 2025-2030
2025 Outlook
- Conservative prediction: $0.31602 - $0.4329
- Neutral prediction: $0.4329 - $0.55844
- Optimistic prediction: $0.55844 - $0.60 (requires strong market momentum and increased adoption)
2027-2028 Outlook
- Market stage expectation: Potential growth phase with increasing adoption
- Price range forecast:
- 2027: $0.32992 - $0.58251
- 2028: $0.38979 - $0.62038
- Key catalysts: Technological advancements, wider market acceptance, and potential partnerships
2030 Long-term Outlook
- Base scenario: $0.33444 - $0.64316 (assuming steady market growth)
- Optimistic scenario: $0.64316 - $0.66889 (with accelerated adoption and favorable market conditions)
- Transformative scenario: $0.66889 - $0.75 (with breakthrough technology implementation and mass adoption)
- 2030-12-31: ME $0.64316 (projected average price for the year)
| 年份 | 预测最高价 | 预测平均价格 | 预测最低价 | 涨跌幅 |
|---|---|---|---|---|
| 2025 | 0.55844 | 0.4329 | 0.31602 | 0 |
| 2026 | 0.53532 | 0.49567 | 0.25279 | 14 |
| 2027 | 0.58251 | 0.5155 | 0.32992 | 18 |
| 2028 | 0.62038 | 0.549 | 0.38979 | 26 |
| 2029 | 0.70163 | 0.58469 | 0.39174 | 34 |
| 2030 | 0.66889 | 0.64316 | 0.33444 | 48 |
IV. ME Professional Investment Strategies and Risk Management
ME Investment Methodology
(1) Long-term Holding Strategy
- Suitable for: Long-term investors and NFT enthusiasts
- Operation suggestions:
- Accumulate ME tokens during market dips
- Monitor Magic Eden's platform development and user growth
- Store tokens in a secure non-custodial wallet
(2) Active Trading Strategy
- Technical analysis tools:
- Moving Averages: Use to identify trends and potential reversal points
- RSI (Relative Strength Index): Monitor overbought/oversold conditions
- Key points for swing trading:
- Set clear entry and exit points based on technical indicators
- Keep track of Magic Eden's new partnerships and feature releases
ME Risk Management Framework
(1) Asset Allocation Principles
- Conservative investors: 1-3% of crypto portfolio
- Aggressive investors: 5-10% of crypto portfolio
- Professional investors: Up to 15% of crypto portfolio
(2) Risk Hedging Solutions
- Diversification: Spread investments across multiple NFT platforms
- Stop-loss orders: Implement to limit potential losses
(3) Secure Storage Solutions
- Hot wallet recommendation: Gate Web3 Wallet
- Cold storage solution: Hardware wallet for long-term holdings
- Security precautions: Enable two-factor authentication, use strong passwords
V. Potential Risks and Challenges for ME
ME Market Risks
- High volatility: NFT market sentiment can change rapidly
- Competition: Increasing number of NFT marketplaces entering the space
- Market saturation: Potential oversupply of NFTs affecting overall demand
ME Regulatory Risks
- Uncertain regulations: Evolving global regulatory landscape for NFTs
- Tax implications: Potential changes in tax treatment of NFT transactions
- Cross-border restrictions: Possible limitations on international NFT trading
ME Technical Risks
- Smart contract vulnerabilities: Potential security flaws in the token contract
- Scalability issues: Challenges in handling increased transaction volume
- Interoperability concerns: Potential difficulties in cross-chain NFT transfers
VI. Conclusion and Action Recommendations
ME Investment Value Assessment
Magic Eden (ME) presents a compelling long-term value proposition as a leading multi-chain NFT marketplace. However, short-term risks include market volatility and regulatory uncertainties.
ME Investment Recommendations
✅ Beginners: Start with small positions, focus on learning about NFT markets ✅ Experienced investors: Consider dollar-cost averaging into ME tokens ✅ Institutional investors: Conduct thorough due diligence and consider OTC options
ME Trading Participation Methods
- Spot trading: Available on Gate.com and other supported exchanges
- Staking: Explore potential staking options if offered by Magic Eden
- NFT trading: Engage directly with the Magic Eden platform to understand token utility
Cryptocurrency investments carry extremely high risks, and this article does not constitute investment advice. Investors should make decisions carefully based on their own risk tolerance and are advised to consult professional financial advisors. Never invest more than you can afford to lose.
FAQ
Will meme coin reach $1?
It's highly unlikely for meme coins to reach $1. Market volatility and historical trends suggest such a significant price increase is improbable for most meme-based cryptocurrencies.
Would hamster kombat coin reach $1?
It's possible for Hamster Kombat to reach $1, given its growing popularity and play-to-earn model. Like other meme coins, its future depends on market trends and community support.
Can mana reach $10?
Based on current projections, MANA is unlikely to reach $10 before the 2030s. It may take several years for the price to hit double figures.
What will Meta be worth in 2030?
Meta's stock price is projected to reach $1,270 per share by 2030, with estimates ranging from $1,080 to $1,460. This forecast assumes continued growth in ad revenue and AI advancements.
Share
Content
Introduction: ME's Market Position and Investment Value
I. ME Price History Review and Current Market Status
II. Key Factors Affecting ME's Future Price
III. ME Price Prediction for 2025-2030
IV. ME Professional Investment Strategies and Risk Management
V. Potential Risks and Challenges for ME
VI. Conclusion and Action Recommendations
FAQ

