2025 INV Price Prediction: Analysis of Growth Potential and Market Factors Influencing Inverse Finance Token
Introduction: INV's Market Position and Investment Value
Inverse (INV), as a protocol generating yield on stablecoins and continuously investing in target tokens like ETH, has been making waves in the DeFi sector since its inception. As of 2025, INV's market capitalization has reached $23,059,917, with a circulating supply of approximately 598,026 tokens and a price hovering around $38.56. This asset, often referred to as a "yield-generating powerhouse," is playing an increasingly crucial role in decentralized finance and yield optimization.
This article will comprehensively analyze INV's price trends from 2025 to 2030, taking into account historical patterns, market supply and demand, ecosystem development, and macroeconomic factors, to provide investors with professional price predictions and practical investment strategies.
I. INV Price History Review and Current Market Status
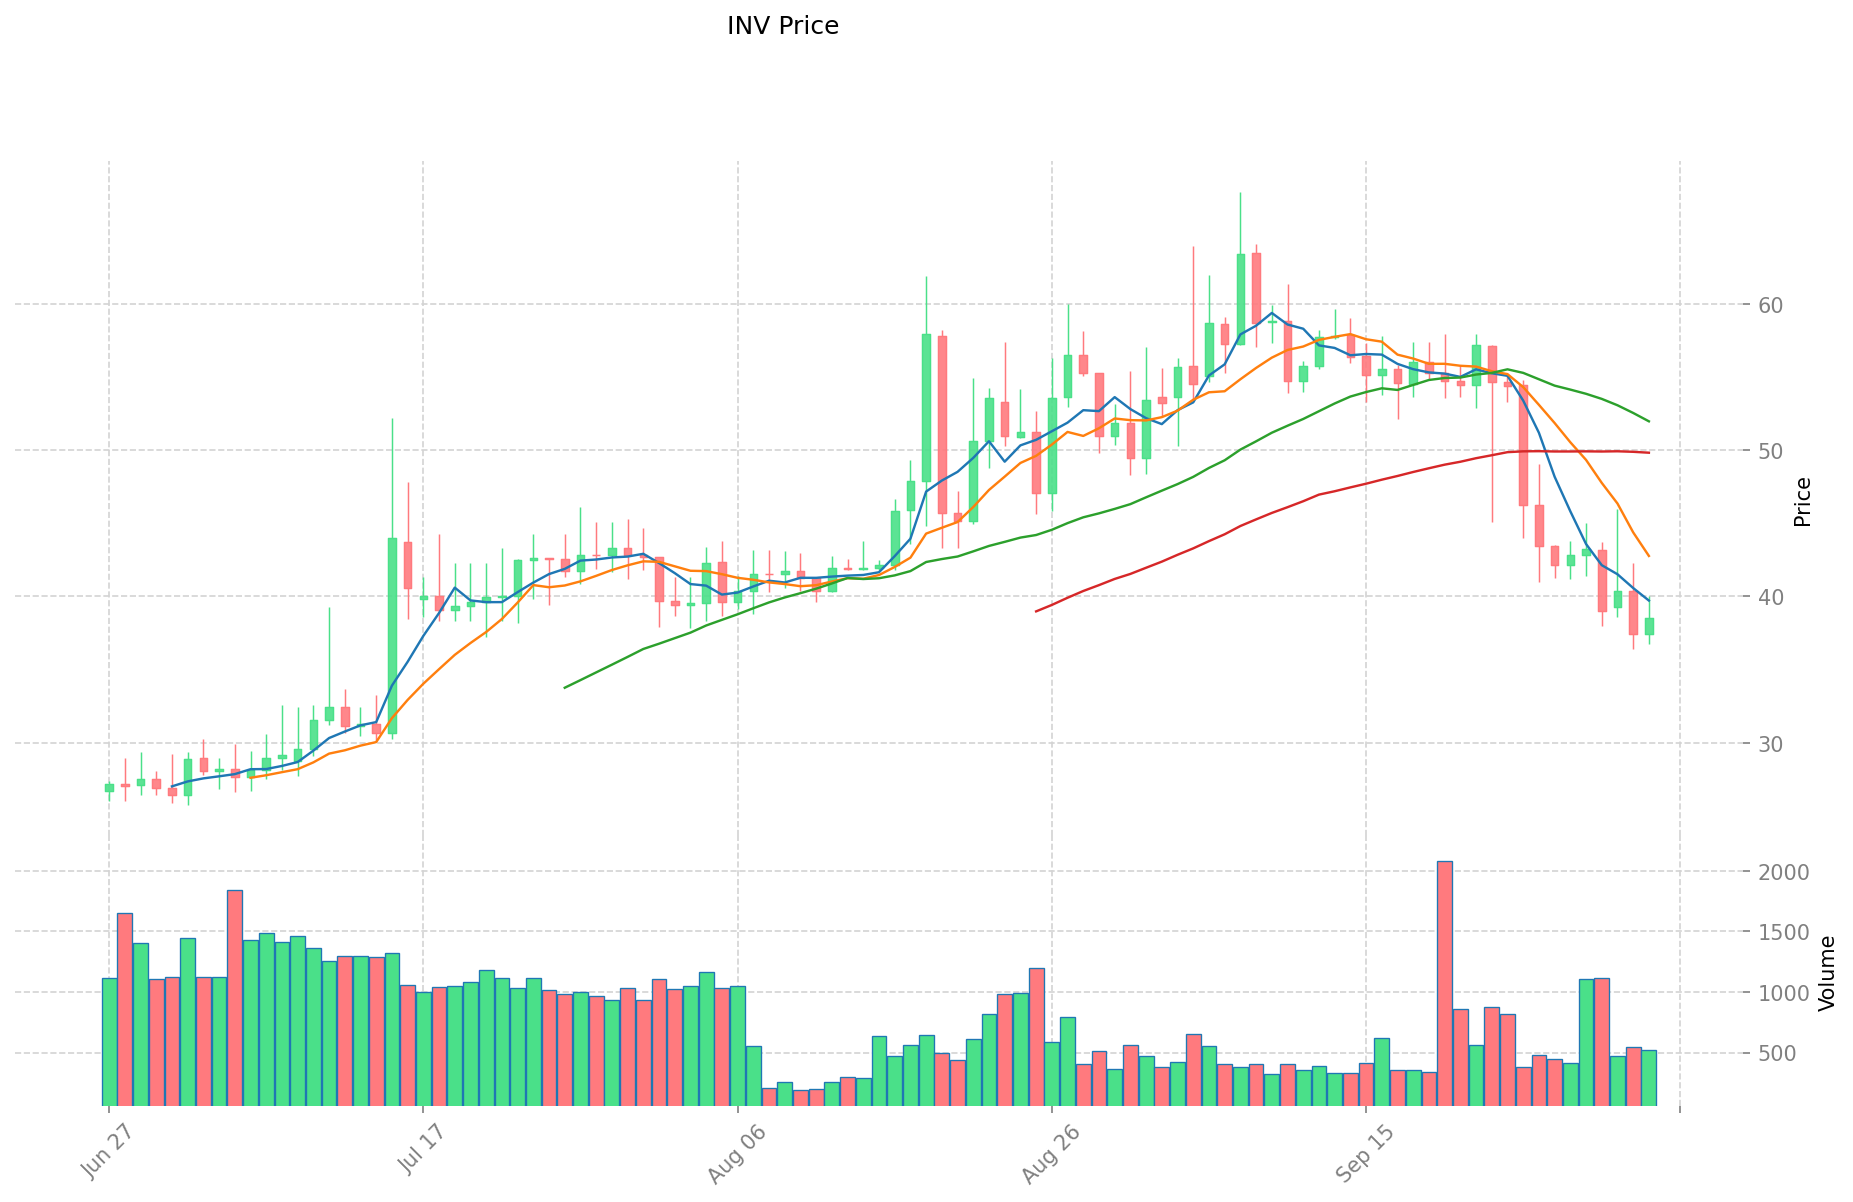
INV Historical Price Evolution Trajectory
- 2021: All-time high reached, price peaked at $2,075.09 on March 7
- 2024: Market downturn, price hit all-time low of $20.72 on October 11
- 2025: Market recovery, price rebounded to $38.56 as of October 4
INV Current Market Situation
As of October 4, 2025, INV is trading at $38.56, with a 24-hour trading volume of $19,946.80. The token has shown positive momentum in the short term, with a 1.1% increase in the last 24 hours and a slight 0.05% gain in the past hour. However, the medium-term trend appears bearish, with a 10.61% decrease over the past week and a significant 28.84% drop in the last 30 days.
Despite recent declines, INV has demonstrated strong long-term growth, boasting a 76.81% increase over the past year. The token's market capitalization currently stands at $23,059,917.91, ranking it 1031st in the cryptocurrency market. With a circulating supply of 598,026.92 INV out of a total supply of 719,000, the token has a circulation ratio of 83.17%.
Click to view the current INV market price
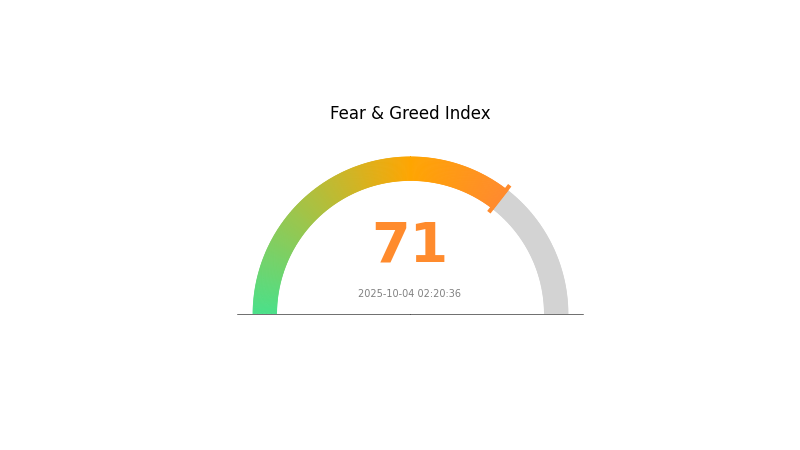
INV Market Sentiment Indicator
2025-10-04 Fear and Greed Index: 71 (Greed)
Click to view the current Fear & Greed Index
The crypto market is buzzing with optimism as the Fear and Greed Index hits 71, firmly in the "Greed" zone. This surge in sentiment suggests investors are increasingly bullish, potentially driven by positive market developments or promising technological advancements. However, seasoned traders often view extreme greed as a signal to exercise caution. As the market reaches new heights, it's crucial to maintain a balanced perspective and consider potential risks alongside opportunities. Gate.com offers comprehensive tools to help navigate these market conditions effectively.
INV Holdings Distribution
The address holdings distribution data for INV reveals a highly concentrated ownership structure. The top address holds an overwhelming 66.52% of the total supply, with 478.30K INV tokens. This significant concentration raises concerns about centralization and potential market manipulation.
The subsequent top 4 addresses collectively hold only 8.61% of the supply, with individual holdings ranging from 1.65% to 2.96%. The remaining 24.87% is distributed among other addresses. This skewed distribution suggests a substantial imbalance in token ownership, which could impact market dynamics and price volatility. The dominance of a single address poses risks to the token's decentralization efforts and may influence governance decisions if INV employs a token-based voting system.
Such a concentrated distribution could lead to increased price volatility, as large movements from the top address could significantly impact the market. It also raises questions about the token's resistance to potential manipulation and the overall stability of its on-chain structure. Investors and stakeholders should closely monitor any changes in this distribution pattern, as shifts could signal important developments in the INV ecosystem.
Click to view the current INV holdings distribution
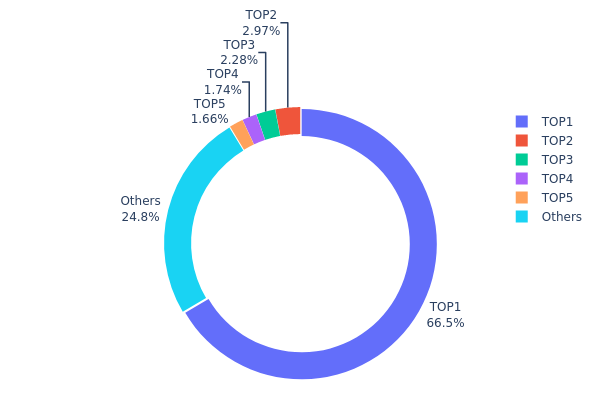
| Top | Address | Holding Qty | Holding (%) |
|---|---|---|---|
| 1 | 0x1637...dcd61b | 478.30K | 66.52% |
| 2 | 0x6bd8...36b171 | 21.33K | 2.96% |
| 3 | 0xc7de...18b19a | 16.38K | 2.27% |
| 4 | 0xb9db...993b96 | 12.50K | 1.73% |
| 5 | 0x02fd...6db5dc | 11.91K | 1.65% |
| - | Others | 178.58K | 24.87% |
II. Key Factors Influencing INV's Future Price
Supply Mechanism
- Halving: The periodic reduction in the rate of new INV creation, which historically has had a bullish impact on price.
- Historical Pattern: Previous halvings have typically led to price increases in the medium to long term.
- Current Impact: The next halving is anticipated to reduce supply inflation, potentially supporting price growth.
Macroeconomic Environment
- Monetary Policy Impact: Major central banks' policies, particularly the Federal Reserve's interest rate decisions, can affect INV's attractiveness as an investment.
- Inflation Hedging Properties: INV is often viewed as a hedge against inflation, with its performance potentially improving in high-inflation environments.
- Geopolitical Factors: International tensions and economic uncertainties can drive investors towards INV as a safe-haven asset.
Technological Development and Ecosystem Building
- Network Upgrades: Ongoing improvements to the INV network, enhancing scalability and functionality.
- Layer 2 Solutions: Development of second-layer protocols to improve transaction speed and reduce fees.
- Ecosystem Applications: Growth of DeFi, NFTs, and other applications built on the INV blockchain, increasing utility and demand.
III. INV Price Prediction for 2025-2030
2025 Outlook
- Conservative forecast: $37.02 - $38.56
- Neutral forecast: $38.56 - $40.00
- Optimistic forecast: $40.00 - $42.80 (requires strong market momentum and increased adoption)
2027-2028 Outlook
- Market stage expectation: Potential growth phase with increased volatility
- Price range predictions:
- 2027: $30.61 - $51.44
- 2028: $29.12 - $69.52
- Key catalysts: Technological advancements, wider institutional adoption, and favorable regulatory developments
2029-2030 Long-term Outlook
- Base scenario: $58.25 - $62.33 (assuming steady market growth and continued adoption)
- Optimistic scenario: $66.40 - $70.43 (assuming strong bull market and significant ecosystem expansion)
- Transformative scenario: $70.00 - $80.00 (assuming breakthrough applications and mainstream integration)
- 2030-12-31: INV $62.33 (potential stabilization after periods of growth)
| 年份 | 预测最高价 | 预测平均价格 | 预测最低价 | 涨跌幅 |
|---|---|---|---|---|
| 2025 | 42.8016 | 38.56 | 37.0176 | 0 |
| 2026 | 44.34207 | 40.6808 | 22.37444 | 5 |
| 2027 | 51.43884 | 42.51144 | 30.60823 | 10 |
| 2028 | 69.5232 | 46.97514 | 29.12458 | 21 |
| 2029 | 66.40405 | 58.24917 | 50.09429 | 50 |
| 2030 | 70.42907 | 62.32661 | 44.87516 | 61 |
IV. Professional INV Investment Strategies and Risk Management
INV Investment Methodology
(1) Long-term Holding Strategy
- Suitable for: Risk-tolerant investors with a long-term outlook
- Operational suggestions:
- Dollar-cost average into INV over time
- Hold through market volatility, focusing on fundamental value
- Store INV tokens in a secure hardware wallet
(2) Active Trading Strategy
- Technical analysis tools:
- Moving Averages: Use to identify trends and potential reversals
- RSI (Relative Strength Index): Monitor overbought/oversold conditions
- Key points for swing trading:
- Set clear entry and exit points based on technical indicators
- Maintain strict stop-loss orders to limit potential losses
INV Risk Management Framework
(1) Asset Allocation Principles
- Conservative investors: 1-3% of crypto portfolio
- Aggressive investors: 5-10% of crypto portfolio
- Professional investors: Up to 15% of crypto portfolio, depending on risk tolerance
(2) Risk Hedging Solutions
- Diversification: Spread investments across multiple cryptocurrencies and asset classes
- Options strategies: Use put options for downside protection when available
(3) Secure Storage Solutions
- Hot wallet recommendation: Gate Web3 Wallet for active trading
- Cold storage solution: Use a hardware wallet for long-term holdings
- Security precautions: Enable two-factor authentication, use strong passwords, and regularly update software
V. Potential Risks and Challenges for INV
INV Market Risks
- High volatility: INV price can experience significant fluctuations
- Limited liquidity: May face challenges in executing large trades without impacting price
- Market sentiment: Susceptible to broader crypto market trends and investor sentiment
INV Regulatory Risks
- Uncertain regulatory environment: Potential for new regulations affecting DeFi protocols
- Compliance challenges: Possible need for protocol adjustments to meet evolving regulatory requirements
- Cross-border restrictions: Risk of limited access in certain jurisdictions due to regulatory concerns
INV Technical Risks
- Smart contract vulnerabilities: Potential for exploits or bugs in the protocol's code
- Scalability issues: Possible network congestion on Ethereum affecting transaction speeds and costs
- Oracle dependency: Risks associated with reliance on external data sources for price feeds
VI. Conclusion and Action Recommendations
INV Investment Value Assessment
INV offers exposure to an innovative DeFi yield generation protocol, but comes with high risk due to market volatility, regulatory uncertainty, and technical challenges. Long-term potential exists, but short-term risks are significant.
INV Investment Recommendations
✅ Beginners: Limit exposure to a small portion of portfolio, focus on education and understanding the protocol ✅ Experienced investors: Consider a moderate allocation, actively manage positions, and stay informed on protocol developments ✅ Institutional investors: Conduct thorough due diligence, potentially engage through structured products or indirect exposure
INV Participation Methods
- Spot trading: Purchase INV tokens on Gate.com's spot market
- Yield farming: Participate in INV's yield generation protocols (requires advanced knowledge)
- Governance: Hold INV tokens to participate in protocol governance decisions
Cryptocurrency investments carry extremely high risks, and this article does not constitute investment advice. Investors should make decisions carefully based on their own risk tolerance and are advised to consult professional financial advisors. Never invest more than you can afford to lose.
FAQ
How high can inverse finance go?
Inverse Finance could potentially reach $40.55 by the end of 2025, based on average estimates from a five-year projection.
What is the price prediction of ICP in 2025?
ICP price in 2025 is predicted to range from $6.20 to $8.60, with optimistic forecasts reaching $15 and bearish estimates at $2.87.
What is the price prediction for XRP in 2030?
By 2030, XRP is predicted to reach a price range of $90 to $120, marking a significant milestone in its growth trajectory.
What crypto has the highest price prediction?
Bitcoin has the highest price prediction, with forecasts suggesting it could reach $140,652. Chainlink follows with a prediction of $62.60.
Share
Content