2025 GRTPrice Prediction: Will The Graph Protocol Reach New All-Time Highs in the Evolving Web3 Ecosystem?
Introduction: GRT's Market Position and Investment Value
The Graph (GRT), as a decentralized protocol for indexing and querying blockchain data, has made significant strides since its inception in 2020. As of 2025, The Graph's market capitalization has reached $1.06 billion, with a circulating supply of approximately 10.5 billion tokens, and a price hovering around $0.09856. This asset, often referred to as the "Google of blockchain," is playing an increasingly crucial role in facilitating data accessibility and query operations within the Ethereum ecosystem and beyond.
This article will comprehensively analyze The Graph's price trends from 2025 to 2030, taking into account historical patterns, market supply and demand, ecosystem development, and macroeconomic factors, to provide investors with professional price predictions and practical investment strategies.
I. GRT Price History Review and Current Market Status
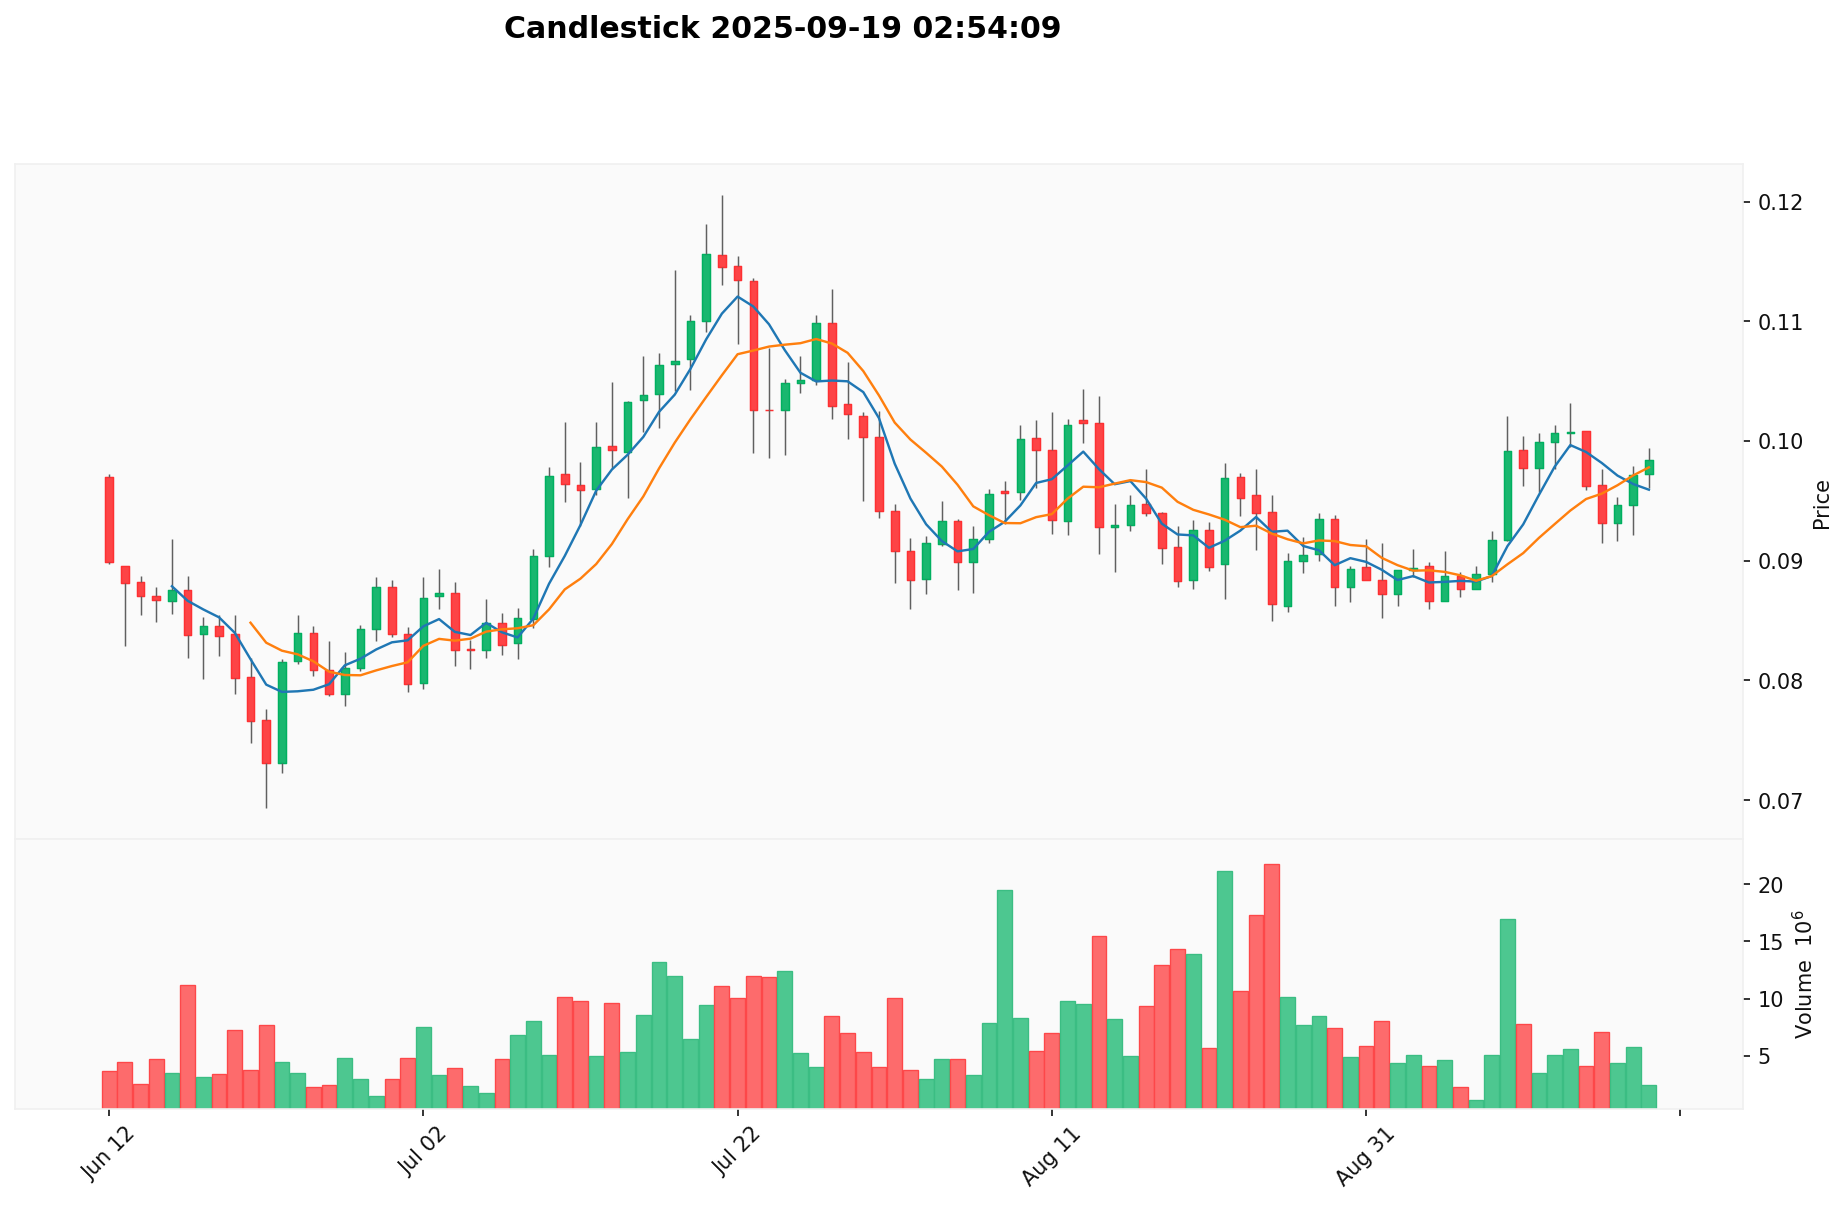
GRT Historical Price Evolution Trajectory
- 2020: Initial launch, price started at $0.03
- 2021: Bull market peak, price reached all-time high of $2.84
- 2022: Market downturn, price dropped to all-time low of $0.052051
GRT Current Market Situation
As of September 19, 2025, GRT is trading at $0.09856, with a 24-hour trading volume of $242,071.30. The current market cap stands at $1,035,461,988.56, ranking GRT at 111th position in the overall cryptocurrency market. Over the past 24 hours, GRT has seen a 1.46% increase in price. The token is currently 96.53% below its all-time high of $2.84, set on February 12, 2021, and 89.31% above its all-time low of $0.052051, recorded on November 22, 2022. The circulating supply is 10,505,904,916.38 GRT, which is 97.27% of the total supply of 10,800,262,816.05 GRT.
Click to view the current GRT market price
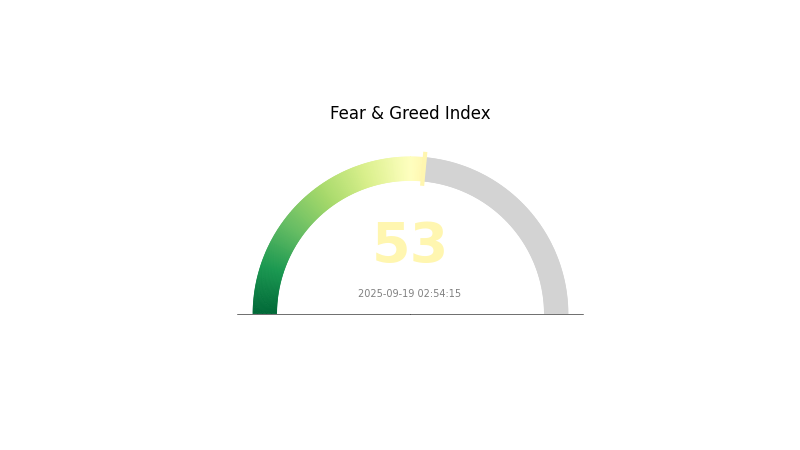
GRT Market Sentiment Indicator
2025-09-19 Fear and Greed Index: 53 (Neutral)
Click to view the current Fear & Greed Index
The crypto market sentiment remains balanced today, with the Fear and Greed Index at 53, indicating a neutral stance. This suggests that investors are neither overly pessimistic nor excessively optimistic about the market's current state. Such equilibrium often presents opportunities for thoughtful decision-making, as extreme emotions are less likely to influence market behavior. Traders and investors may want to closely monitor market trends and fundamental factors before making any significant moves in this neutral environment.
GRT Holdings Distribution
The address holdings distribution data provides valuable insights into the concentration of GRT tokens among different wallet addresses. Analysis of this data reveals a relatively high concentration of GRT tokens among the top holders. The top address holds a significant 26.83% of the total supply, while the top 5 addresses collectively control 45.11% of GRT tokens.
This level of concentration raises concerns about potential market manipulation and price volatility. With nearly half of the tokens held by just five addresses, large movements from these wallets could significantly impact market dynamics. However, it's worth noting that 54.89% of tokens are distributed among other addresses, indicating some level of decentralization.
The current distribution structure suggests a moderate level of centralization, which could affect market stability and liquidity. While this concentration may provide some short-term price support, it also poses risks to the long-term health of the GRT ecosystem. Investors should monitor these top addresses for any significant changes in holdings, as they could signal potential market movements.
Click to view the current GRT Holdings Distribution
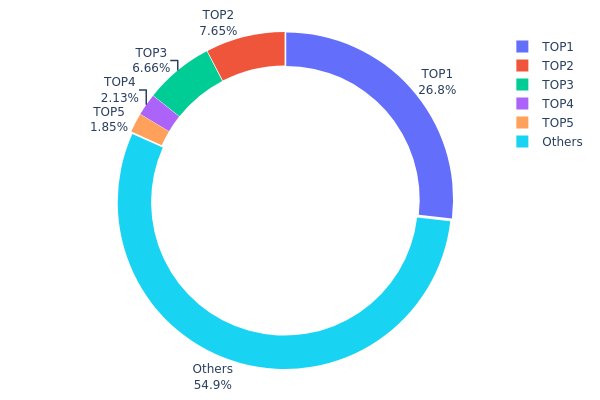
| Top | Address | Holding Qty | Holding (%) |
|---|---|---|---|
| 1 | 0x36af...77f090 | 2898339.93K | 26.83% |
| 2 | 0x32ec...7f2ca1 | 826666.67K | 7.65% |
| 3 | 0x823f...27396c | 719519.91K | 6.66% |
| 4 | 0x5a52...70efcb | 229640.32K | 2.12% |
| 5 | 0xf550...1263b9 | 200193.50K | 1.85% |
| - | Others | 5925902.50K | 54.89% |
II. Key Factors Affecting GRT's Future Price
Supply Mechanism
- Circulating Supply: The current circulating supply of GRT is 10,505,905,100.258652 tokens.
- Total Supply: The total supply of GRT is 11,355,935,343.791777 tokens.
- Current Impact: With no max supply specified, the potential for inflation may affect future price dynamics.
Institutional and Whale Dynamics
- Enterprise Adoption: The Graph is used by various dApps and blockchain projects for data indexing and querying.
Macroeconomic Environment
- Inflation Hedging Properties: As a utility token in the blockchain data indexing space, GRT may offer some protection against inflation.
Technological Development and Ecosystem Building
- Layer 2 Integration: The Graph has integrated with Layer 2 solutions like Optimism and ZK rollups to enhance scalability and efficiency.
- Cross-Chain Expansion: GRT is available on multiple blockchains, including Ethereum, Avalanche, Solana, and Arbitrum, expanding its ecosystem reach.
- Ecosystem Applications: The Graph serves as a crucial infrastructure for many DApps, providing data indexing services across various blockchain networks.
III. GRT Price Prediction for 2025-2030
2025 Outlook
- Conservative prediction: $0.07972 - $0.09842
- Neutral prediction: $0.09842 - $0.10383
- Optimistic prediction: $0.10383 - $0.10925 (requires positive market sentiment)
2027-2028 Outlook
- Market stage expectation: Potential growth phase
- Price range forecast:
- 2027: $0.1133 - $0.14935
- 2028: $0.07648 - $0.15713
- Key catalysts: Increased adoption of The Graph protocol, overall crypto market recovery
2029-2030 Long-term Outlook
- Base scenario: $0.14809 - $0.16512 (assuming steady growth in blockchain adoption)
- Optimistic scenario: $0.16512 - $0.18215 (assuming rapid expansion of decentralized data economy)
- Transformative scenario: $0.18215 - $0.20000 (extreme favorable conditions such as widespread enterprise adoption)
- 2030-12-31: GRT $0.17833 (potential peak before year-end correction)
| 年份 | 预测最高价 | 预测平均价格 | 预测最低价 | 涨跌幅 |
|---|---|---|---|---|
| 2025 | 0.10925 | 0.09842 | 0.07972 | 0 |
| 2026 | 0.15367 | 0.10383 | 0.08514 | 5 |
| 2027 | 0.14935 | 0.12875 | 0.1133 | 30 |
| 2028 | 0.15713 | 0.13905 | 0.07648 | 41 |
| 2029 | 0.18215 | 0.14809 | 0.11699 | 50 |
| 2030 | 0.17833 | 0.16512 | 0.11724 | 67 |
IV. Professional GRT Investment Strategies and Risk Management
GRT Investment Methodology
(1) Long-term Holding Strategy
- Suitable for: Long-term investors and believers in decentralized data indexing
- Operation suggestions:
- Accumulate GRT during market dips
- Stake GRT to participate in network governance and earn rewards
- Store GRT in secure non-custodial wallets
(2) Active Trading Strategy
- Technical analysis tools:
- Moving Averages: Use to identify trends and potential reversal points
- Relative Strength Index (RSI): Monitor overbought/oversold conditions
- Key points for swing trading:
- Set clear entry and exit points based on technical indicators
- Monitor The Graph ecosystem developments for potential price catalysts
GRT Risk Management Framework
(1) Asset Allocation Principles
- Conservative investors: 1-3% of crypto portfolio
- Moderate investors: 3-5% of crypto portfolio
- Aggressive investors: 5-10% of crypto portfolio
(2) Risk Hedging Solutions
- Diversification: Spread investments across multiple blockchain projects
- Stop-loss orders: Implement to limit potential losses
(3) Secure Storage Solutions
- Hot wallet recommendation: Gate Web3 Wallet
- Cold storage solution: Hardware wallets for long-term holdings
- Security precautions: Enable two-factor authentication, use strong passwords
V. Potential Risks and Challenges for GRT
GRT Market Risks
- High volatility: Crypto market fluctuations can lead to significant price swings
- Competition: Emerging blockchain indexing solutions may challenge The Graph's market position
- Token dilution: Future token releases may impact price
GRT Regulatory Risks
- Uncertain regulatory landscape: Potential changes in crypto regulations could affect GRT's utility and value
- Cross-border compliance: Varying international regulations may limit global adoption
GRT Technical Risks
- Smart contract vulnerabilities: Potential bugs or exploits in The Graph's protocol
- Scalability challenges: Increased network usage may lead to performance issues
- Blockchain interoperability: Difficulties in expanding to other blockchain networks
VI. Conclusion and Action Recommendations
GRT Investment Value Assessment
The Graph (GRT) presents a compelling long-term value proposition as a crucial infrastructure for decentralized data indexing. However, short-term price volatility and evolving crypto regulations pose significant risks.
GRT Investment Recommendations
✅ Beginners: Start with small positions, focus on learning about The Graph ecosystem ✅ Experienced investors: Consider dollar-cost averaging and staking for long-term exposure ✅ Institutional investors: Conduct thorough due diligence and consider GRT as part of a diversified crypto portfolio
GRT Participation Methods
- Token purchase: Buy GRT on Gate.com
- Network participation: Stake GRT to become a curator or delegator
- Ecosystem involvement: Contribute to The Graph's development or use subgraphs for dApp projects
Cryptocurrency investments carry extremely high risks, and this article does not constitute investment advice. Investors should make decisions carefully based on their own risk tolerance and are advised to consult professional financial advisors. Never invest more than you can afford to lose.
FAQ
Will GRT reach $10?
GRT has strong potential to reach $10. Based on current trends and market analysis, it could achieve this milestone in the coming years, possibly by 2026-2027.
Does GRT have a future?
Yes, GRT has a promising future. As a key infrastructure for decentralized web apps, its potential growth looks strong. Experts remain optimistic about its adoption and value increase by 2025.
How much is the GRT worth in 2030?
Based on current market analysis, GRT is expected to be worth between $2.38 and $2.81 in 2030, with an average price of $2.47.
Will The Graph reach $5?
While The Graph has potential for growth, reaching $5 is uncertain. Market conditions and adoption will play key roles in its future price performance.
Share
Content
Introduction: GRT's Market Position and Investment Value
I. GRT Price History Review and Current Market Status
II. Key Factors Affecting GRT's Future Price
III. GRT Price Prediction for 2025-2030
IV. Professional GRT Investment Strategies and Risk Management
V. Potential Risks and Challenges for GRT
VI. Conclusion and Action Recommendations
FAQ

