2025 GRT Price Prediction: Will The Graph Protocol Reach New Heights in the Crypto Market?
Introduction: GRT's Market Position and Investment Value
The Graph (GRT), as a decentralized protocol for indexing and querying blockchain data, has made significant strides since its inception in 2020. As of 2025, The Graph's market capitalization has reached $597,661,232, with a circulating supply of approximately 10,576,203,013 tokens, and a price hovering around $0.05651. This asset, often referred to as the "Google of Blockchain," is playing an increasingly crucial role in making blockchain data easily accessible and queryable.
This article will comprehensively analyze The Graph's price trends from 2025 to 2030, considering historical patterns, market supply and demand, ecosystem development, and macroeconomic factors to provide investors with professional price predictions and practical investment strategies.
I. GRT Price History Review and Current Market Status
GRT Historical Price Evolution
- 2020: Initial launch, price started at $0.03
- 2021: Bull market peak, price reached all-time high of $2.84
- 2025: Market downturn, price dropped to all-time low of $0.04626017
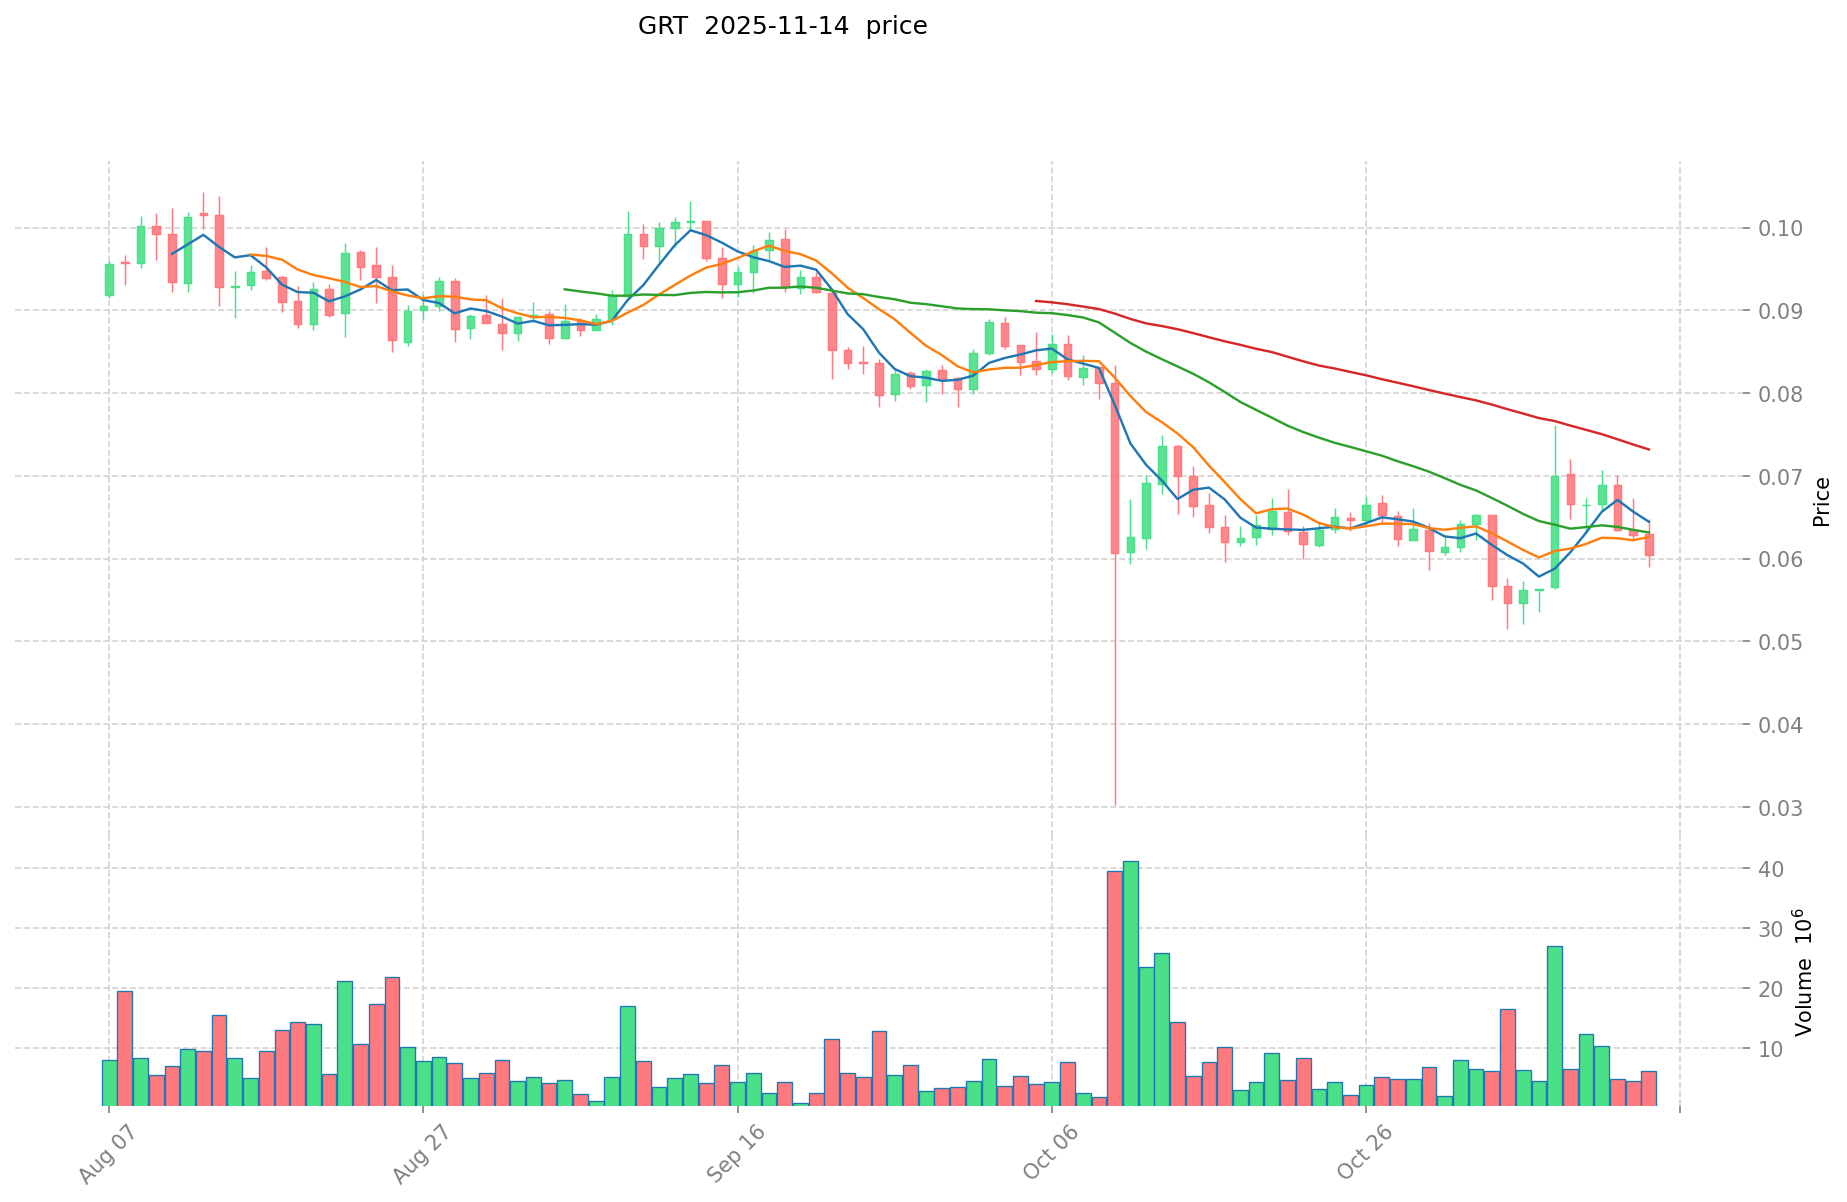
GRT Current Market Situation
As of November 15, 2025, GRT is trading at $0.05651, with a 24-hour trading volume of $372,435.62. The token has experienced a 6.88% decrease in the last 24 hours. GRT's market capitalization currently stands at $597,661,232.25, ranking it 124th in the global cryptocurrency market. The circulating supply is 10,576,203,012.66 GRT, which is 97.93% of the total supply of 10,800,262,823.32 GRT. Over the past week, GRT has seen a significant decline of 21.33%, while the 30-day performance shows a 14.34% decrease. The year-to-date performance indicates a substantial drop of 68.83%.
Click to view the current GRT market price
GRT Market Sentiment Indicator
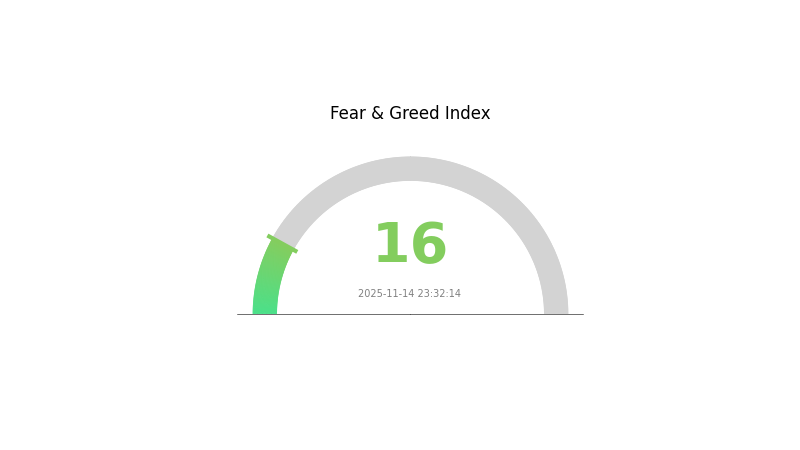
2025-11-14 Fear and Greed Index: 16 (Extreme Fear)
Click to view the current Fear & Greed Index
The crypto market is gripped by extreme fear, with the index plummeting to 16. This level of pessimism often signals a potential buying opportunity for contrarian investors. However, caution is advised as market sentiment can remain negative for extended periods. Traders on Gate.com should consider dollar-cost averaging strategies and thorough risk assessment before making any moves. Remember, market cycles are natural, and extreme fear doesn't necessarily indicate an immediate reversal.
GRT Holdings Distribution
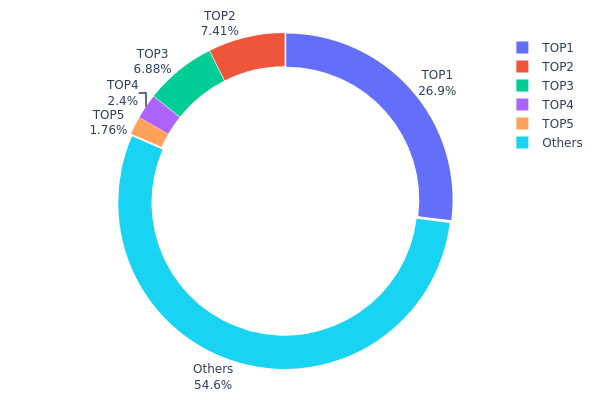
The address holdings distribution data for GRT reveals a significant concentration of tokens among a few top addresses. The largest holder possesses 26.94% of the total supply, while the top 5 addresses collectively control 45.39% of all GRT tokens. This concentration level raises concerns about potential market manipulation and centralization risks.
Despite the substantial holdings of the top addresses, it's noteworthy that 54.61% of GRT tokens are distributed among other addresses. This distribution pattern suggests a mixed market structure, where a handful of major players coexist with a broader base of smaller holders. Such a configuration may lead to increased price volatility, as large holders have the potential to significantly impact market dynamics through their trading activities.
The current GRT holdings distribution reflects a moderate level of decentralization, albeit with some centralization risks. While the presence of major stakeholders could provide stability and long-term commitment to the project, it also underscores the importance of monitoring large address movements for potential market impacts. Overall, this distribution pattern indicates a maturing market structure for GRT, with room for further diversification to enhance on-chain stability and reduce concentration risks.
Click to view the current GRT Holdings Distribution
| Top | Address | Holding Qty | Holding (%) |
|---|---|---|---|
| 1 | 0x36af...77f090 | 2910251.12K | 26.94% |
| 2 | 0x32ec...7f2ca1 | 800833.33K | 7.41% |
| 3 | 0x823f...27396c | 743147.50K | 6.88% |
| 4 | 0xf977...41acec | 259647.12K | 2.40% |
| 5 | 0xf550...1263b9 | 190394.43K | 1.76% |
| - | Others | 5895989.31K | 54.61% |
II. Key Factors Affecting GRT's Future Price
Supply Mechanism
- Token Release Schedule: The Graph (GRT) has a predetermined token release schedule that gradually introduces new tokens into circulation over time.
- Historical Pattern: Past token releases have often led to temporary price pressures as the circulating supply increases.
- Current Impact: The ongoing token release may continue to exert some downward pressure on GRT's price in the short term.
Institutional and Whale Dynamics
- Institutional Holdings: Several major cryptocurrency investment firms and venture capital companies have shown interest in GRT, potentially indicating long-term confidence in the project.
Macroeconomic Environment
- Inflation Hedging Properties: As a utility token for a decentralized data indexing protocol, GRT may offer some hedging properties against inflation, particularly if The Graph's adoption continues to grow.
Technological Development and Ecosystem Building
- Subgraph Migration: The Graph is working on migrating subgraphs from the hosted service to the decentralized network, which could increase demand for GRT tokens.
- Ecosystem Applications: The Graph supports numerous DApps and blockchain projects by providing efficient data indexing services, contributing to its growing ecosystem.
III. GRT Price Prediction for 2025-2030
2025 Outlook
- Conservative prediction: $0.0444 - $0.0562
- Neutral prediction: $0.0562 - $0.07025
- Optimistic prediction: $0.07025 - $0.08 (requires strong market recovery and increased GRT adoption)
2027-2028 Outlook
- Market stage expectation: Potential growth phase with increasing volatility
- Price range forecast:
- 2027: $0.03708 - $0.08943
- 2028: $0.07215 - $0.09566
- Key catalysts: Expansion of The Graph ecosystem, broader crypto market trends, and technological advancements in decentralized indexing
2029-2030 Long-term Outlook
- Base scenario: $0.08837 - $0.10957 (assuming steady growth in GRT utility and adoption)
- Optimistic scenario: $0.13078 - $0.15012 (assuming accelerated blockchain integration and data querying demand)
- Transformative scenario: $0.15012 - $0.18 (extreme favorable conditions such as widespread enterprise adoption and major partnerships)
- 2030-12-31: GRT $0.10957 (93% increase from 2025 levels, reflecting significant market maturation)
| 年份 | 预测最高价 | 预测平均价格 | 预测最低价 | 涨跌幅 |
|---|---|---|---|---|
| 2025 | 0.07025 | 0.0562 | 0.0444 | 0 |
| 2026 | 0.08219 | 0.06323 | 0.05374 | 11 |
| 2027 | 0.08943 | 0.07271 | 0.03708 | 28 |
| 2028 | 0.09566 | 0.08107 | 0.07215 | 43 |
| 2029 | 0.13078 | 0.08837 | 0.08483 | 55 |
| 2030 | 0.15012 | 0.10957 | 0.07013 | 93 |
IV. GRT Professional Investment Strategies and Risk Management
GRT Investment Methodology
(1) Long-term Holding Strategy
- Suitable for: Long-term investors and believers in decentralized data indexing
- Operation suggestions:
- Accumulate GRT during market dips
- Stake GRT to participate in network operations and earn rewards
- Store in non-custodial wallets for enhanced security
(2) Active Trading Strategy
- Technical analysis tools:
- Moving Averages: Use to identify trends and potential reversal points
- Relative Strength Index (RSI): Gauge overbought or oversold conditions
- Key points for swing trading:
- Monitor The Graph ecosystem developments and partnerships
- Pay attention to overall crypto market sentiment and correlation with BTC
GRT Risk Management Framework
(1) Asset Allocation Principles
- Conservative investors: 1-3% of crypto portfolio
- Aggressive investors: 5-10% of crypto portfolio
- Professional investors: Up to 15% of crypto portfolio
(2) Risk Hedging Solutions
- Diversification: Balance GRT with other crypto assets and traditional investments
- Stop-loss orders: Set appropriate levels to limit potential losses
(3) Secure Storage Solutions
- Hot wallet recommendation: Gate Web3 wallet
- Cold storage solution: Hardware wallets for long-term holdings
- Security precautions: Enable two-factor authentication, use strong passwords, and keep private keys offline
V. Potential Risks and Challenges for GRT
GRT Market Risks
- High volatility: Significant price fluctuations common in crypto markets
- Competition: Emergence of alternative blockchain indexing solutions
- Market sentiment: Susceptibility to overall crypto market trends
GRT Regulatory Risks
- Uncertain regulatory landscape: Potential for increased scrutiny of DeFi projects
- Compliance challenges: Adapting to evolving global cryptocurrency regulations
- Tax implications: Changing tax treatment of crypto assets and staking rewards
GRT Technical Risks
- Smart contract vulnerabilities: Potential for exploits in The Graph protocol
- Scalability challenges: Keeping up with increasing demand for indexing services
- Network congestion: Potential for high gas fees on Ethereum affecting GRT transactions
VI. Conclusion and Action Recommendations
GRT Investment Value Assessment
The Graph (GRT) offers long-term potential as a crucial infrastructure for decentralized data indexing, but faces short-term volatility and competitive pressures in the rapidly evolving blockchain ecosystem.
GRT Investment Recommendations
✅ Beginners: Start with small, regular investments to understand the technology and market dynamics ✅ Experienced investors: Consider a balanced approach of staking and trading based on technical analysis ✅ Institutional investors: Explore strategic partnerships and large-scale indexing opportunities within The Graph ecosystem
GRT Trading Participation Methods
- Spot trading: Buy and sell GRT on Gate.com
- Staking: Participate in network operations by delegating GRT to indexers
- DeFi integration: Explore liquidity provision and yield farming opportunities using GRT tokens
Cryptocurrency investments carry extremely high risks, and this article does not constitute investment advice. Investors should make decisions carefully based on their own risk tolerance and are advised to consult professional financial advisors. Never invest more than you can afford to lose.
FAQ
Will GRT reach $10?
While GRT has potential, reaching $10 is ambitious. It may hit $2-$3 in the next few years with increased adoption and market growth, but $10 seems unlikely in the near term.
Does grt crypto have a future?
Yes, GRT has a promising future. As Web3 grows, The Graph's decentralized indexing protocol becomes more vital, potentially driving GRT's value and adoption higher in the coming years.
Is GRT a good investment?
GRT shows strong potential as an investment in 2025. With its role in Web3 data indexing and growing adoption, GRT is likely to see significant price appreciation, making it an attractive option for crypto investors.
Is GRT a good investment in 2025?
Yes, GRT looks promising in 2025. With increased adoption of The Graph protocol and growing demand for decentralized data indexing, GRT's value and utility are likely to rise, making it a potentially good investment.
Share
Content
Introduction: GRT's Market Position and Investment Value
I. GRT Price History Review and Current Market Status
II. Key Factors Affecting GRT's Future Price
III. GRT Price Prediction for 2025-2030
IV. GRT Professional Investment Strategies and Risk Management
V. Potential Risks and Challenges for GRT
VI. Conclusion and Action Recommendations
FAQ

