2025 FITFI Fiyat Tahmini: Dijital Çağda Fitness Finansının Geleceğinin Değerlendirilmesi

Giriş: FITFI'nin Piyasa Konumu ve Yatırım Değeri
Step.app (FITFI), FitFi (Fitness Finance) sektörünün en önde gelen projelerinden biri olarak 2022'deki başlangıcından bu yana dikkat çekici bir ilerleme kaydetti. 2025 itibarıyla FITFI'nin piyasa değeri 3.592.522,5 $ seviyesinde, dolaşımdaki arz yaklaşık 4.172.500.000 adet ve fiyatı 0,000861 $ civarında seyrediyor. “Move-to-earn” modelinin öncüsü olarak kabul edilen bu varlık, fitness ile blokzincir teknolojisinin birleşiminde giderek daha merkezi bir rol üstleniyor.
Bu makale, 2025-2030 yılları arasında FITFI'nin fiyat eğilimlerini; tarihsel gelişim, arz-talep dengesi, ekosistem büyümesi ve makroekonomik etkenleri bir arada değerlendirerek profesyonel fiyat tahminleri ve yatırımcılar için uygulanabilir stratejiler sunacaktır.
I. FITFI Fiyat Geçmişi ve Güncel Piyasa Durumu
FITFI Tarihsel Fiyat Seyri
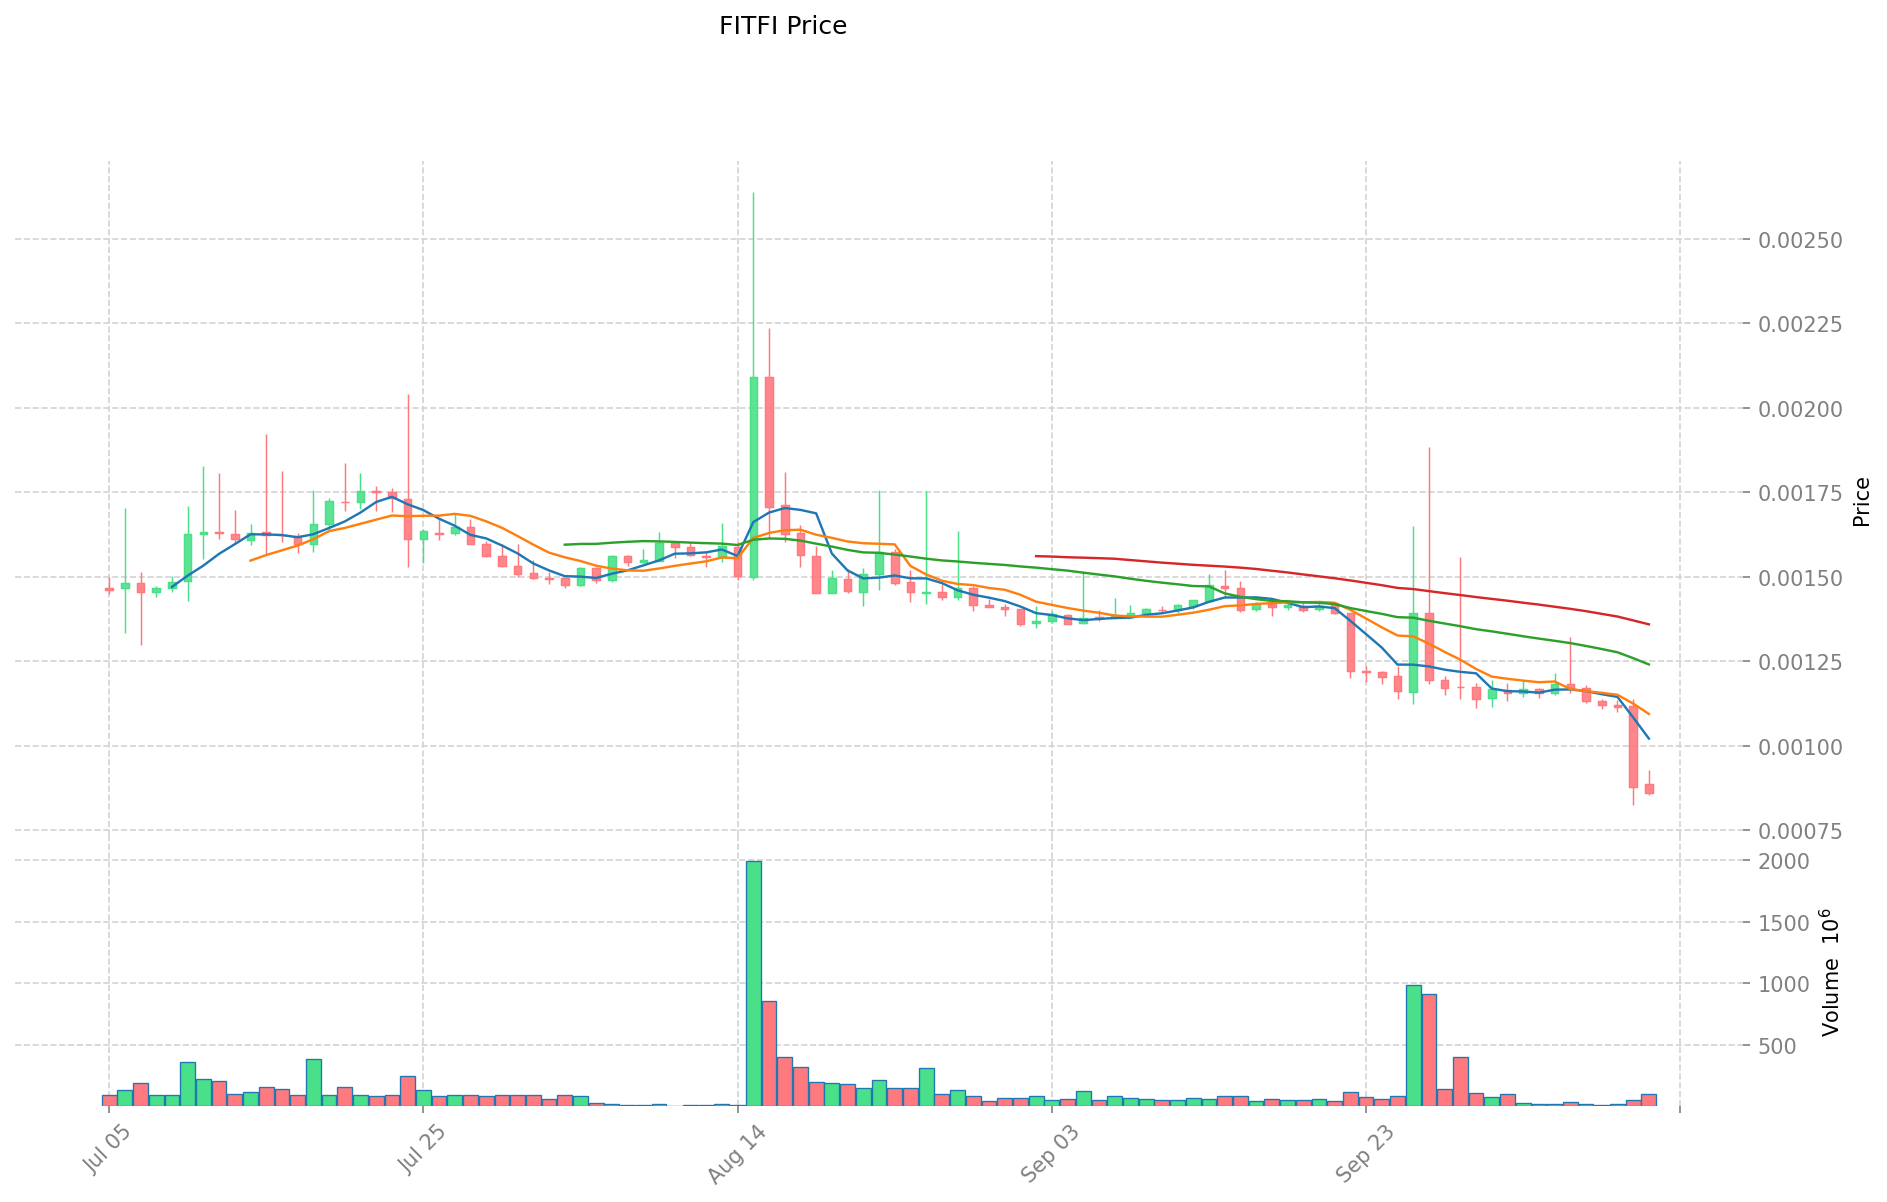
- 2022: Projenin lansmanı; fiyat 5 Mayıs’ta 0,731881 $ ile tüm zamanların en yüksek seviyesine ulaştı
- 2023-2024: Piyasa dalgalanmaları; fiyat kademeli olarak geriledi
- 2025: Ayı piyasası döngüsü; fiyat 12 Ekim’de 0,0008582 $ ile tüm zamanların en düşük seviyesine indi
FITFI Güncel Piyasa Görünümü
12 Ekim 2025 itibarıyla FITFI, 0,000861 $ seviyesinden işlem görüyor ve bu, tarihi zirvesinden %99,88 oranında bir düşüş anlamına geliyor. Token, farklı zaman dilimlerinde ciddi değer kayıpları yaşadı: Son 24 saatte -%2,38, son bir haftada -%25,52, son bir ayda -%39,24 ve son bir yılda -%73,1. Güncel piyasa değeri 3.592.522,5 $ olup, tam seyreltilmiş piyasa değeri 3.960.600 $ seviyesinde. 24 saatlik işlem hacmi 81.635,57 $ ile düşük likiditeyi gösteriyor. Dolaşımdaki FITFI token miktarı 4.172.500.000 ve bu, toplam arzın %90,71’ini oluşturuyor (toplam arz 4.600.000.000). Piyasa eğilimi belirgin şekilde negatif ve token şu anda tarihi dip seviyelerinde.
Güncel FITFI piyasa fiyatını görmek için tıklayın
FITFI Piyasa Hissiyatı Göstergesi
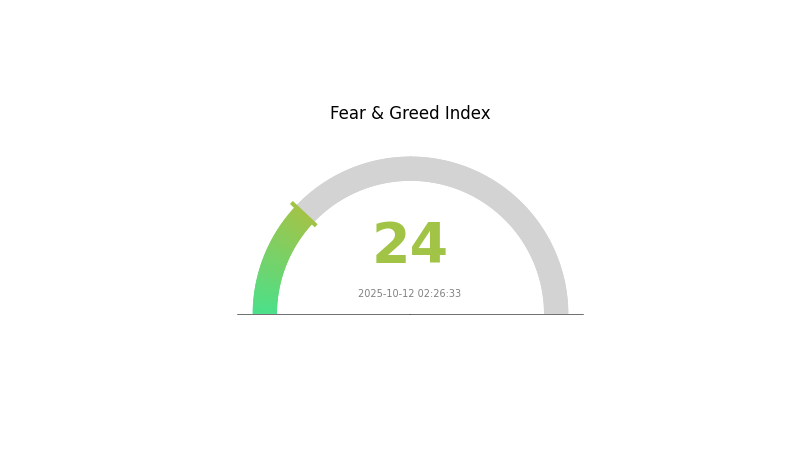
12 Ekim 2025 Korku ve Açgözlülük Endeksi: 24 (Aşırı Korku)
Güncel Korku & Açgözlülük Endeksi için tıklayın
Kripto piyasasında aşırı korku hakim ve Korku ile Açgözlülük Endeksi 24’e kadar geriledi. Bu durum, varlıkların değerinin altında olması nedeniyle tecrübeli yatırımcılar için fırsat yaratabilir. Ancak, piyasa hissiyatı hala zayıf olduğu için dikkatli hareket edilmeli. Yatırımcılar, ortalama maliyetle alım ve detaylı analiz stratejilerini izlemeli. Piyasa döngülerinin doğal olduğunu ve bu korku evresinin bir dönüşün habercisi olabileceğini unutmayın. Dalgalı dönemlerde güncel kalın ve riskinizi bilinçli yönetin.
FITFI Varlık Dağılımı
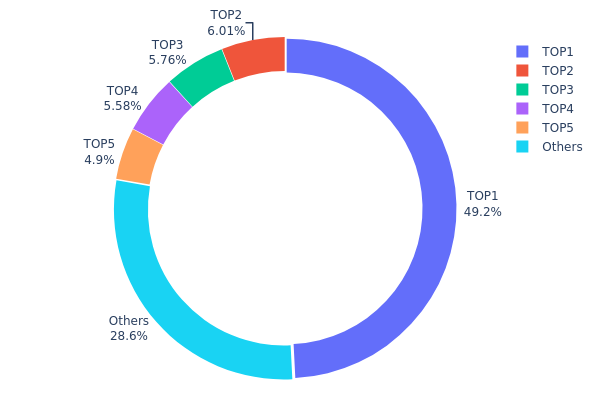
FITFI’nin adres bazlı varlık dağılımı, son derece yoğunlaşmış bir sahiplik yapısına işaret ediyor. En büyük adres, toplam arzın %49,19’unu elinde bulunduruyor. Sonraki dört en büyük adres ise toplamda %22,22’lik bir paya sahip. Bu yoğunlaşma; olası piyasa manipülasyonu ve yüksek volatilite riskini gündeme getiriyor.
Bu derece merkezileşmiş bir dağılım, FITFI'nin piyasa dinamikleri üzerinde ciddi etkilere neden olabilir. Büyük sahiplerin işlemleri, fiyat üzerinde orantısız bir etki yaratabilir ve volatiliteyi artırabilir. Ayrıca, bu merkezileşme, projenin merkeziyetsizlik ilkesine gölge düşürebilir ve yönetişimde tekelleşmeye sebep olabilir.
Mevcut FITFI varlık dağılımı, zincir üzerinde düşük istikrar ve yüksek riskli bir profil ortaya koyuyor. Bu dengesizlik, merkezileşme riskini önemseyen yatırımcıların ilgisini azaltabilir ve uzun vadede tokenin likiditesi ile işlem derinliğini olumsuz etkileyebilir.
Güncel FITFI Varlık Dağılımı için tıklayın
| İlk | Adres | Varlık Miktarı | Varlık (%) |
|---|---|---|---|
| 1 | 0xcd9e...8ac436 | 2.262.835,61K | 49,19% |
| 2 | 0x0a80...2449a2 | 276.230,70K | 6,00% |
| 3 | 0xa893...3213b3 | 265.037,74K | 5,76% |
| 4 | 0xb890...2c5f53 | 256.450,34K | 5,57% |
| 5 | 0x7aad...f695fa | 225.215,98K | 4,89% |
| - | Diğerleri | 1.314.229,64K | 28,59% |
II. FITFI'nin Gelecekteki Fiyatını Etkileyen Temel Unsurlar
Arz Mekanizması
- Piyasa Dinamikleri: FITFI'nin fiyatı, arz-talep ilişkisiyle belirli bir aralıkta dalgalanır.
- Güncel Etki: FITFI fiyatı şu anda 0,003902 $ ile 0,009948 $ arasında dalgalanıyor ve bu, bir yükseliş potansiyelini gösteriyor.
Kurumsal ve Whale Hareketleri
- Kurumsal Benimseme: FITFI, fintech alanında yenilikçi çözümler sunarak ödemelerde hız, güvenlik ve kolaylık sağlar.
Makroekonomik Ortam
- Jeopolitik Faktörler: Uluslararası gelişmeler ve küresel ekonomi politikalarındaki değişiklikler FITFI fiyatını etkileyebilir.
Teknolojik Gelişim ve Ekosistem Oluşumu
- Yenilikçilik: FITFI'nin fintech alanındaki yenilikçi yapısı, olumlu bir beklenti oluşturuyor.
- Ekosistem Uygulamaları: GameFi trendinin bir parçası olarak, FITFI'nin gelişimi oyun-finans entegrasyonundan etkilenebilir.
III. 2025-2030 FITFI Fiyat Tahmini
2025 Görünümü
- İhtiyatlı tahmin: 0,00078 $ - 0,00086 $
- Tarafsız tahmin: 0,00086 $ - 0,00092 $
- İyimser tahmin: 0,00092 $ - 0,00097 $ (olumlu piyasa beklentisiyle)
2027-2028 Görünümü
- Piyasa evresi: Yükselen dalgalanmayla beraber potansiyel büyüme dönemi
- Fiyat aralığı tahmini:
- 2027: 0,00096 $ - 0,00145 $
- 2028: 0,00066 $ - 0,00136 $
- Başlıca katalizörler: Proje gelişmeleri, piyasa kabulü ve genel kripto piyasa eğilimleri
2029-2030 Uzun Vadeli Görünüm
- Temel senaryo: 0,00129 $ - 0,00150 $ (istikrarlı piyasa büyümesi varsayımıyla)
- İyimser senaryo: 0,00150 $ - 0,00171 $ (güçlü proje performansı ve benimseme ile)
- Çığır açıcı senaryo: 0,00171 $ - 0,00200 $ (büyük inovasyon ve yaygın kabul ile)
- 31 Aralık 2030: FITFI 0,00154 $ (potansiyel yıl sonu hedefi)
| Yıl | Tahmini En Yüksek Fiyat | Tahmini Ortalama Fiyat | Tahmini En Düşük Fiyat | Değişim Oranı |
|---|---|---|---|---|
| 2025 | 0,00097 | 0,00086 | 0,00078 | 0 |
| 2026 | 0,00108 | 0,00092 | 0,00081 | 6 |
| 2027 | 0,00145 | 0,001 | 0,00096 | 16 |
| 2028 | 0,00136 | 0,00122 | 0,00066 | 42 |
| 2029 | 0,00171 | 0,00129 | 0,00066 | 50 |
| 2030 | 0,00154 | 0,0015 | 0,00105 | 74 |
IV. FITFI Profesyonel Yatırım Stratejileri ve Risk Yönetimi
FITFI Yatırım Yöntemleri
(1) Uzun Vadeli Tutma Stratejisi
- Kimler için: Yüksek risk toleransına sahip uzun vadeli yatırımcılar
- Öneriler:
- Piyasa geri çekilmelerinde FITFI biriktirin
- FITFI tokenlerini stake ederek ödül kazanın ve yönetişime katılın
- Tokenleri güvenli Gate Web3 cüzdanında saklayın
(2) Aktif Alım-Satım Stratejisi
- Teknik analiz araçları:
- Hareketli Ortalamalar: Trendleri ve potansiyel giriş/çıkış seviyelerini belirlemek için kullanılır
- RSI (Göreli Güç Endeksi): Aşırı alım/aşırı satım koşullarını izleyin
- Swing trade için kritik noktalar:
- FITFI’nin genel kripto piyasasıyla korelasyonunu takip edin
- Kayıp riskini sınırlamak için katı stop-loss emirleri kullanın
FITFI Risk Yönetimi Çerçevesi
(1) Varlık Dağılımı İlkeleri
- Temkinli yatırımcılar: Kripto portföyünün %1-3’ü
- Daha agresif yatırımcılar: Kripto portföyünün %5-10’u
- Profesyonel yatırımcılar: Kripto portföyünün %15’ine kadar
(2) Riskten Korunma Çözümleri
- Çeşitlendirme: Yatırımı farklı kripto paralara yayın
- Stop-loss emirleri: Olası kayıpları sınırlayın
(3) Güvenli Saklama Çözümleri
- Sıcak cüzdan: Gate Web3 cüzdan önerilir
- Soğuk saklama: Uzun vadeli tutum için donanım cüzdanı
- Güvenlik: İki aşamalı doğrulama aktif edin, güçlü şifreler kullanın
V. FITFI İçin Potansiyel Riskler ve Zorluklar
FITFI Piyasa Riskleri
- Yüksek volatilite: FITFI fiyatı ciddi dalgalanmalar gösterebilir
- Düşük likidite: Sınırlı işlem hacmi kayma riskini artırır
- Piyasa hissiyatı: Genel kripto piyasası ruh haline duyarlı
FITFI Düzenleyici Riskleri
- Bilinmeyen düzenlemeler: FITFI üzerinde etkili olabilecek yeni kripto düzenlemeleri olasılığı
- Sınır ötesi kısıtlamalar: Bazı ülkelerde FITFI işlemlerine getirilebilecek sınırlamalar
- Vergi düzenlemeleri: Değişen vergi mevzuatı FITFI sahiplerini etkileyebilir
FITFI Teknik Riskleri
- Akıllı sözleşme açıkları: Temel kodda istismar riski
- Ağ tıkanıklığı: Avalanche ağındaki yoğunluk işlemleri etkileyebilir
- Ölçeklenebilirlik sorunları: Artan kullanıcı talebini karşılama kısıtları
VI. Sonuç ve Eylem Önerileri
FITFI Yatırım Değeri Değerlendirmesi
FITFI, move-to-earn alanında özgün bir fırsat sunar; ancak düşük piyasa değeri ve yüksek volatilitesi nedeniyle ciddi riskler taşır. Step.app ekosistemi büyürse uzun vadeli potansiyel mevcuttur, fakat kısa vadeli fiyat hareketleri öngörülemez kalacaktır.
FITFI Yatırım Tavsiyeleri
✅ Yeni başlayanlar: Küçük yatırımlarla başlayın, teknolojiye odaklanın ✅ Deneyimli yatırımcılar: Portföyün küçük bir kısmını ayırın, sıkı risk yönetimi uygulayın ✅ Kurumsal yatırımcılar: Kapsamlı inceleme yapın, FITFI’yi çeşitlendirilmiş portföyünüzde değerlendirin
FITFI İşlem Katılım Yöntemleri
- Spot işlemler: Gate.com spot piyasasında FITFI alıp satın
- Staking: FITFI staking programlarına katılarak ek getiri elde edin
- DeFi: Step.app ekosistemindeki merkeziyetsiz finans fırsatlarını keşfedin
Kripto para yatırımları oldukça risklidir ve bu makale yatırım tavsiyesi olarak değerlendirilmemelidir. Yatırımcılar kendi risk iştahlarına göre dikkatlice karar vermeli, profesyonel finans danışmanlarına başvurmalıdır. Asla kaybetmeyi göze alabileceğinizden fazlasını yatırmayın.
SSS
FITFI'nin tüm zamanların en yüksek fiyatı nedir?
FITFI'nin tüm zamanların en yüksek fiyatı 0,7319 $’dır. Güncel fiyat bu seviyenin oldukça altındadır.
2025’te hangi meme coin patlama yapacak (fiyat tahmini)?
Başlıca borsalarda listelenen bir meme coin’in 2025’te Ekim ayına kadar %8000 değer artışıyla piyasa değerinin 860 milyon $’a ulaşması bekleniyor.
Hisse senedi fiyat tahmini için en iyi yapay zeka hangisi?
GARCH-LSTM modeli, istatistiki özellikleri derin öğrenmeyle birleştirerek yüksek doğrulukla hisse senedi fiyat tahmini yapan önde gelen yapay zeka modellerinden biridir.
En yüksek fiyat tahminine sahip kripto para hangisi?
Bitcoin, 139.249 $’lık zirve fiyat tahminiyle başı çekerken, Chainlink’in tahmini en yüksek seviyesi ise 59,67 $’dır.
Share
Content
Giriş: FITFI'nin Piyasa Konumu ve Yatırım Değeri
I. FITFI Fiyat Geçmişi ve Güncel Piyasa Durumu
II. FITFI'nin Gelecekteki Fiyatını Etkileyen Temel Unsurlar
III. 2025-2030 FITFI Fiyat Tahmini
IV. FITFI Profesyonel Yatırım Stratejileri ve Risk Yönetimi
V. FITFI İçin Potansiyel Riskler ve Zorluklar
VI. Sonuç ve Eylem Önerileri
SSS
How to Buy Cryptocurrency


Trending Cryptocurrencies


Günde 100 dolar kazan
Gate Fun: Oyun Finansmanı ve Token İhracını Yenilikçi Hale Getiren Etkileşimli Platform
2025 GMT Fiyat Tahmini: Metaverse’in Benimsenmesi Hızlanırken Yükseliş Eğilimi Bekleniyor
WAM nedir: Web Uygulama İzlemenin ve Çevrim İçi İşletmeler İçin Önemi

En İyi Blockchain Kart Oyunları

Web3 teknolojisinin yön verdiği yeni nesil alım satım platformları, sektör profesyonelleri için güçlü bir çekim noktası oluşturuyor
EGRAG Kripto Varlıkları kimdir ve onun Kripto Varlıklar tahminleri neden önemlidir?
Yaklaşan Ethereum 2.0 Güncellemesi: Beklenen Tarihler ve Ayrıntılar

Kapsamlı Web3 Kripto Para Eğitim Merkezi

Solana AUD Fiyat Analizi: Kurumsal Likidite Sinyalleri Patlama Potansiyelini Gösteriyor

Tom Lee, Ethereum'un 2.500 $ seviyesinde dip yaptığını, 112 milyon $ değerinde Eter alımı nedeniyle belirtti.