2025 ENJ Price Prediction: Analyzing Blockchain Gaming Token's Potential Growth and Market Drivers
Introduction: ENJ's Market Position and Investment Value
Enjin Coin (ENJ), as a leading platform in the gaming and virtual goods sector, has made significant strides since its inception in 2017. As of 2025, ENJ's market capitalization has reached $112,084,019, with a circulating supply of approximately 1,885,032,284 coins, and a price hovering around $0.05946. This asset, often hailed as the "gaming blockchain pioneer," is playing an increasingly crucial role in revolutionizing the gaming industry and virtual asset management.
This article will comprehensively analyze ENJ's price trends from 2025 to 2030, considering historical patterns, market supply and demand, ecosystem development, and macroeconomic factors to provide investors with professional price predictions and practical investment strategies.
I. ENJ Price History Review and Current Market Status
ENJ Historical Price Evolution
- 2017: Initial launch, price reached an all-time low of $0.01865964 on November 12
- 2021: Bull market peak, price hit an all-time high of $4.82 on November 25
- 2022-2025: Crypto market downturn, price declined from its peak to current levels
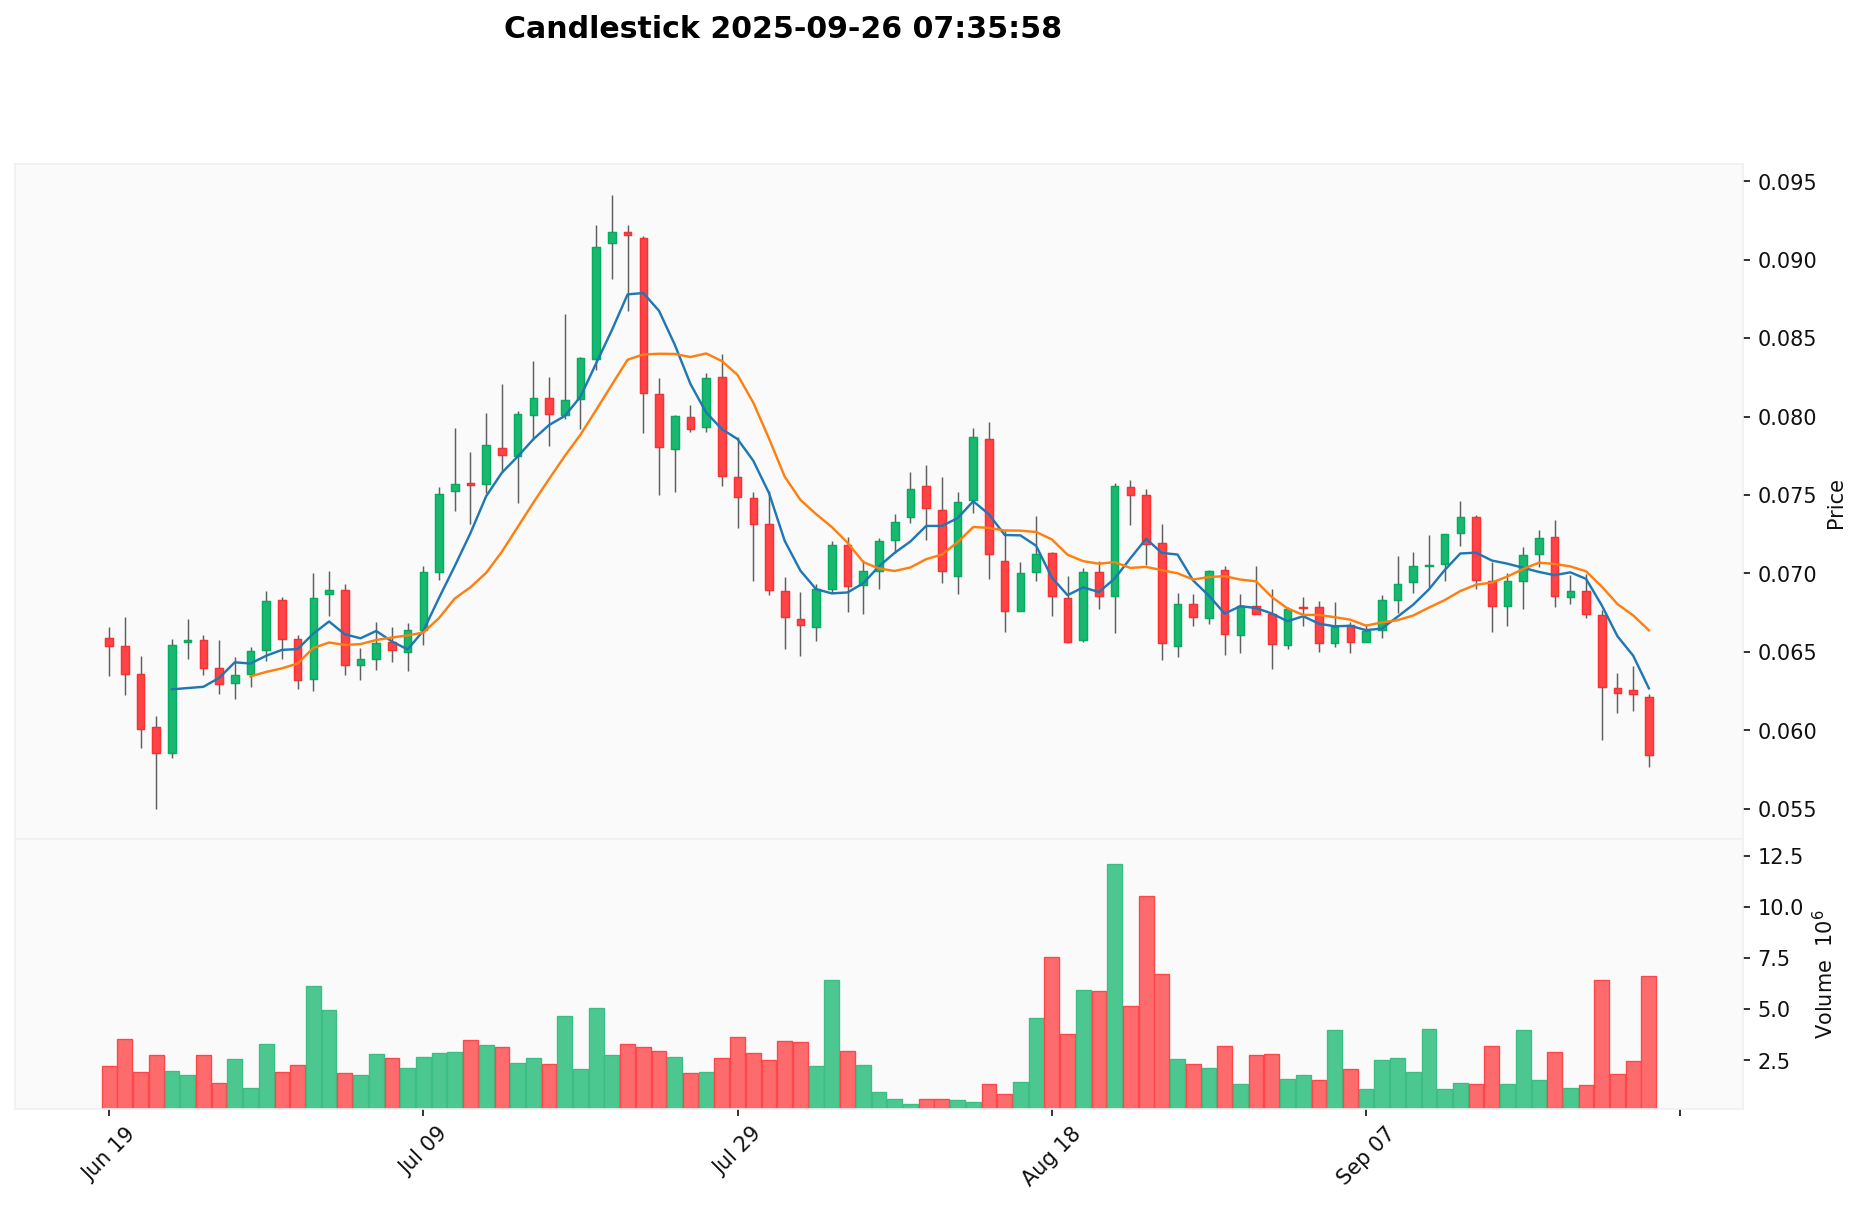
ENJ Current Market Situation
As of September 26, 2025, ENJ is trading at $0.05946, ranking 411th in the crypto market. The token has experienced a 2.5% decrease in the past 24 hours, with a trading volume of $404,215.49. ENJ's market capitalization stands at $112,084,019.66, representing a 0.0027% share of the total crypto market.
The current price is significantly below its all-time high, showing a 98.77% decrease from the peak. Over the past year, ENJ has seen a substantial decline of 62.46%. Short-term price trends also indicate bearish momentum, with 7-day and 30-day declines of 16.08% and 12.07% respectively.
ENJ's circulating supply is 1,885,032,284.84 tokens, with a total supply of 1,812,211,928 and no maximum supply limit. The fully diluted valuation is $59,460,000.
Click to view the current ENJ market price
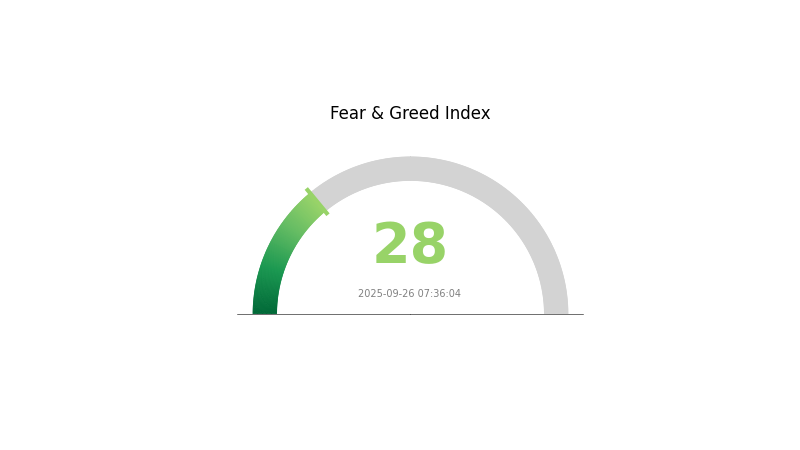
ENJ Market Sentiment Indicator
2025-09-26 Fear and Greed Index: 28 (Fear)
Click to view the current Fear & Greed Index
The crypto market sentiment is currently in a state of fear, with the Fear and Greed Index reading 28. This indicates a cautious atmosphere among investors. During such periods, some traders may see potential buying opportunities, while others might adopt a wait-and-see approach. It's crucial to conduct thorough research and consider your risk tolerance before making any investment decisions. Remember, market sentiment can shift quickly, and it's just one of many factors to consider in crypto trading.
ENJ Holdings Distribution
The address holdings distribution of ENJ reveals a significant concentration of tokens. The top address, likely a burn address or contract, holds 43.08% of the total supply, indicating a substantial portion of ENJ has been removed from circulation. The second-largest holder possesses 10.58%, while the remaining top 5 addresses collectively control 8.22% of the supply.
This distribution pattern suggests a moderate level of centralization, with over half of the tokens concentrated in just five addresses. Such concentration could potentially impact market dynamics, as large holders may exert significant influence on price movements through their trading activities. However, the presence of 38.12% of tokens distributed among other addresses indicates some degree of dispersion among smaller holders.
The current distribution structure implies a mixed market characteristic for ENJ. While the high concentration in top addresses might raise concerns about market manipulation risks, the substantial burn address holdings could be viewed positively as a deflationary mechanism. This balance between centralized control and wider distribution among smaller holders reflects a developing ecosystem, though further decentralization would likely enhance market stability and resilience.
Click to view the current ENJ holdings distribution
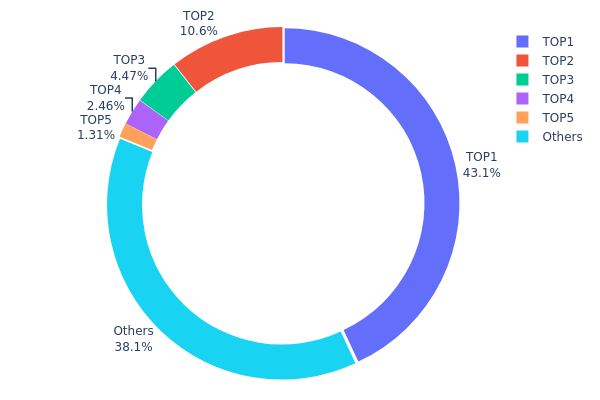
| Top | Address | Holding Qty | Holding (%) |
|---|---|---|---|
| 1 | 0x0000...00dead | 430805.47K | 43.08% |
| 2 | 0xf977...41acec | 105873.12K | 10.58% |
| 3 | 0xd4e6...888127 | 44697.55K | 4.46% |
| 4 | 0x3727...866be8 | 24566.65K | 2.45% |
| 5 | 0xc368...816880 | 13125.97K | 1.31% |
| - | Others | 380931.24K | 38.12% |
II. Key Factors Affecting ENJ's Future Price
Supply Mechanism
- Supply Cap: ENJ has a fixed supply cap, which can influence its price dynamics.
- Current Impact: The limited supply may create scarcity, potentially supporting price growth as demand increases.
Institutional and Whale Dynamics
- Corporate Adoption: Enjin's ecosystem is gaining traction in the virtual goods and gaming industries, potentially attracting more corporate interest.
Macroeconomic Environment
- Inflation Hedging Properties: As a digital asset, ENJ may be viewed as a potential hedge against inflation, affecting its demand and price.
Technological Development and Ecosystem Building
- Metaverse Integration: Enjin's ongoing development in the metaverse space could significantly impact ENJ's value proposition and adoption.
- Ecosystem Applications: The growth of DApps and projects within the Enjin ecosystem may drive demand for ENJ tokens.
III. ENJ Price Prediction for 2025-2030
2025 Outlook
- Conservative prediction: $0.03301 - $0.05894
- Neutral prediction: $0.05894 - $0.06690
- Optimistic prediction: $0.06690 - $0.07485 (requires positive market sentiment and project developments)
2027-2028 Outlook
- Market phase expectation: Potential growth phase with increasing adoption
- Price range forecast:
- 2027: $0.06394 - $0.09394
- 2028: $0.04408 - $0.10286
- Key catalysts: Ecosystem expansion, technological advancements, and broader market trends
2029-2030 Long-term Outlook
- Base scenario: $0.09465 - $0.10459 (assuming steady growth and market stability)
- Optimistic scenario: $0.11453 - $0.12655 (with accelerated adoption and favorable market conditions)
- Transformative scenario: $0.12655+ (under extremely favorable conditions and breakthrough innovations)
- 2030-12-31: ENJ $0.12655 (potential peak price based on current projections)
| 年份 | 预测最高价 | 预测平均价格 | 预测最低价 | 涨跌幅 |
|---|---|---|---|---|
| 2025 | 0.07485 | 0.05894 | 0.03301 | 0 |
| 2026 | 0.09098 | 0.0669 | 0.03479 | 12 |
| 2027 | 0.09394 | 0.07894 | 0.06394 | 32 |
| 2028 | 0.10286 | 0.08644 | 0.04408 | 45 |
| 2029 | 0.11453 | 0.09465 | 0.08329 | 59 |
| 2030 | 0.12655 | 0.10459 | 0.09308 | 75 |
IV. ENJ Professional Investment Strategy and Risk Management
ENJ Investment Methodology
(1) Long-term Holding Strategy
- Suitable for: Long-term value investors
- Operation suggestions:
- Accumulate ENJ during market dips
- Set price targets for partial profit-taking
- Store in secure hardware wallets
(2) Active Trading Strategy
- Technical analysis tools:
- Moving Averages: Identify trends and support/resistance levels
- RSI: Gauge overbought/oversold conditions
- Key points for swing trading:
- Monitor gaming industry news for potential catalysts
- Set stop-loss orders to manage downside risk
ENJ Risk Management Framework
(1) Asset Allocation Principles
- Conservative investors: 1-3%
- Aggressive investors: 5-10%
- Professional investors: 10-15%
(2) Risk Hedging Solutions
- Diversification: Spread investments across multiple gaming-related tokens
- Stop-loss orders: Implement to limit potential losses
(3) Secure Storage Solutions
- Hardware wallet recommendation: Gate Web3 Wallet
- Software wallet option: Official Enjin wallet
- Security precautions: Enable two-factor authentication, use strong passwords
V. Potential Risks and Challenges for ENJ
ENJ Market Risks
- Volatility: High price fluctuations common in crypto markets
- Competition: Emerging gaming tokens may challenge ENJ's market position
- Gaming industry trends: Changes in gamer preferences may impact adoption
ENJ Regulatory Risks
- Unclear regulations: Potential for unfavorable regulatory actions
- Cross-border compliance: Varying regulations across jurisdictions
- Tax implications: Evolving tax laws may affect ENJ holders
ENJ Technical Risks
- Smart contract vulnerabilities: Potential for exploits or bugs
- Scalability challenges: Network congestion during peak usage
- Interoperability issues: Compatibility with various gaming platforms
VI. Conclusion and Action Recommendations
ENJ Investment Value Assessment
ENJ offers long-term potential in the growing blockchain gaming sector, but faces short-term volatility and competitive pressures.
ENJ Investment Recommendations
✅ Beginners: Start with small positions, focus on education
✅ Experienced investors: Consider dollar-cost averaging, monitor gaming trends
✅ Institutional investors: Evaluate ENJ as part of a diversified crypto portfolio
ENJ Participation Methods
- Spot trading: Buy and hold ENJ on Gate.com
- Staking: Participate in available staking programs for passive income
- Gaming: Utilize ENJ within supported blockchain games
Cryptocurrency investments carry extremely high risks, and this article does not constitute investment advice. Investors should make decisions carefully based on their risk tolerance and are advised to consult professional financial advisors. Never invest more than you can afford to lose.
FAQ
What will Enjin be worth in 2025?
Based on current projections, Enjin (ENJ) is expected to trade between $0.063 and $0.084 in 2025, with an average price around $0.074.
Does ENJ have potential?
ENJ's potential has diminished due to increased competition in gaming coins. Its market position has weakened, suggesting limited growth prospects.
What is the highest price of ENJ coin?
The highest price of ENJ coin reached $4.85, which is its all-time high. This peak was achieved in the past, though the exact date is not specified.
What is the price prediction for enjin in 2040?
Based on a 5% annual growth rate, Enjin Coin is projected to reach $0.1335 by 2040, assuming consistent market trends.
Share
Content
Introduction: ENJ's Market Position and Investment Value
I. ENJ Price History Review and Current Market Status
II. Key Factors Affecting ENJ's Future Price
III. ENJ Price Prediction for 2025-2030
IV. ENJ Professional Investment Strategy and Risk Management
V. Potential Risks and Challenges for ENJ
VI. Conclusion and Action Recommendations
FAQ

