2025 DCB Fiyat Tahmini: Piyasa Trendleri ve Olası Büyüme Faktörlerinin Analizi

Giriş: DCB’nin Piyasa Konumu ve Yatırım Değeri
Web3 alanında başarı için hepsi bir arada çözüm sunan Decubate (DCB), kuruluşundan bu yana merkeziyetsiz ekonomide dönüştürücü bir rol üstlenmiştir. 2025 yılı itibarıyla Decubate’in piyasa değeri 2.787.469,93 $’a ulaşırken, yaklaşık 381.845.196 dolaşımdaki token ve 0,0073 $ seviyesinde bir fiyat ile işlem görmektedir. “Web3 etkinleştiricisi” olarak anılan bu varlık, yenilikçilerin güçlenmesini sağlayan ve ileri seviye DeFi çözümleri sunan kritik bir rol üstlenmiştir.
Bu makalede, Decubate’in 2025’ten 2030’a kadar olan fiyat eğilimleri; geçmiş fiyat hareketleri, piyasa arz ve talep dengesi, ekosistem gelişimi ile makroekonomik faktörler ışığında bütüncül bir yaklaşımla analiz edilerek, yatırımcılara uzman fiyat tahminleri ve uygulanabilir yatırım stratejileri sunulacaktır.
I. DCB Fiyat Geçmişi ve Güncel Piyasa Durumu
DCB Tarihsel Fiyat Seyri
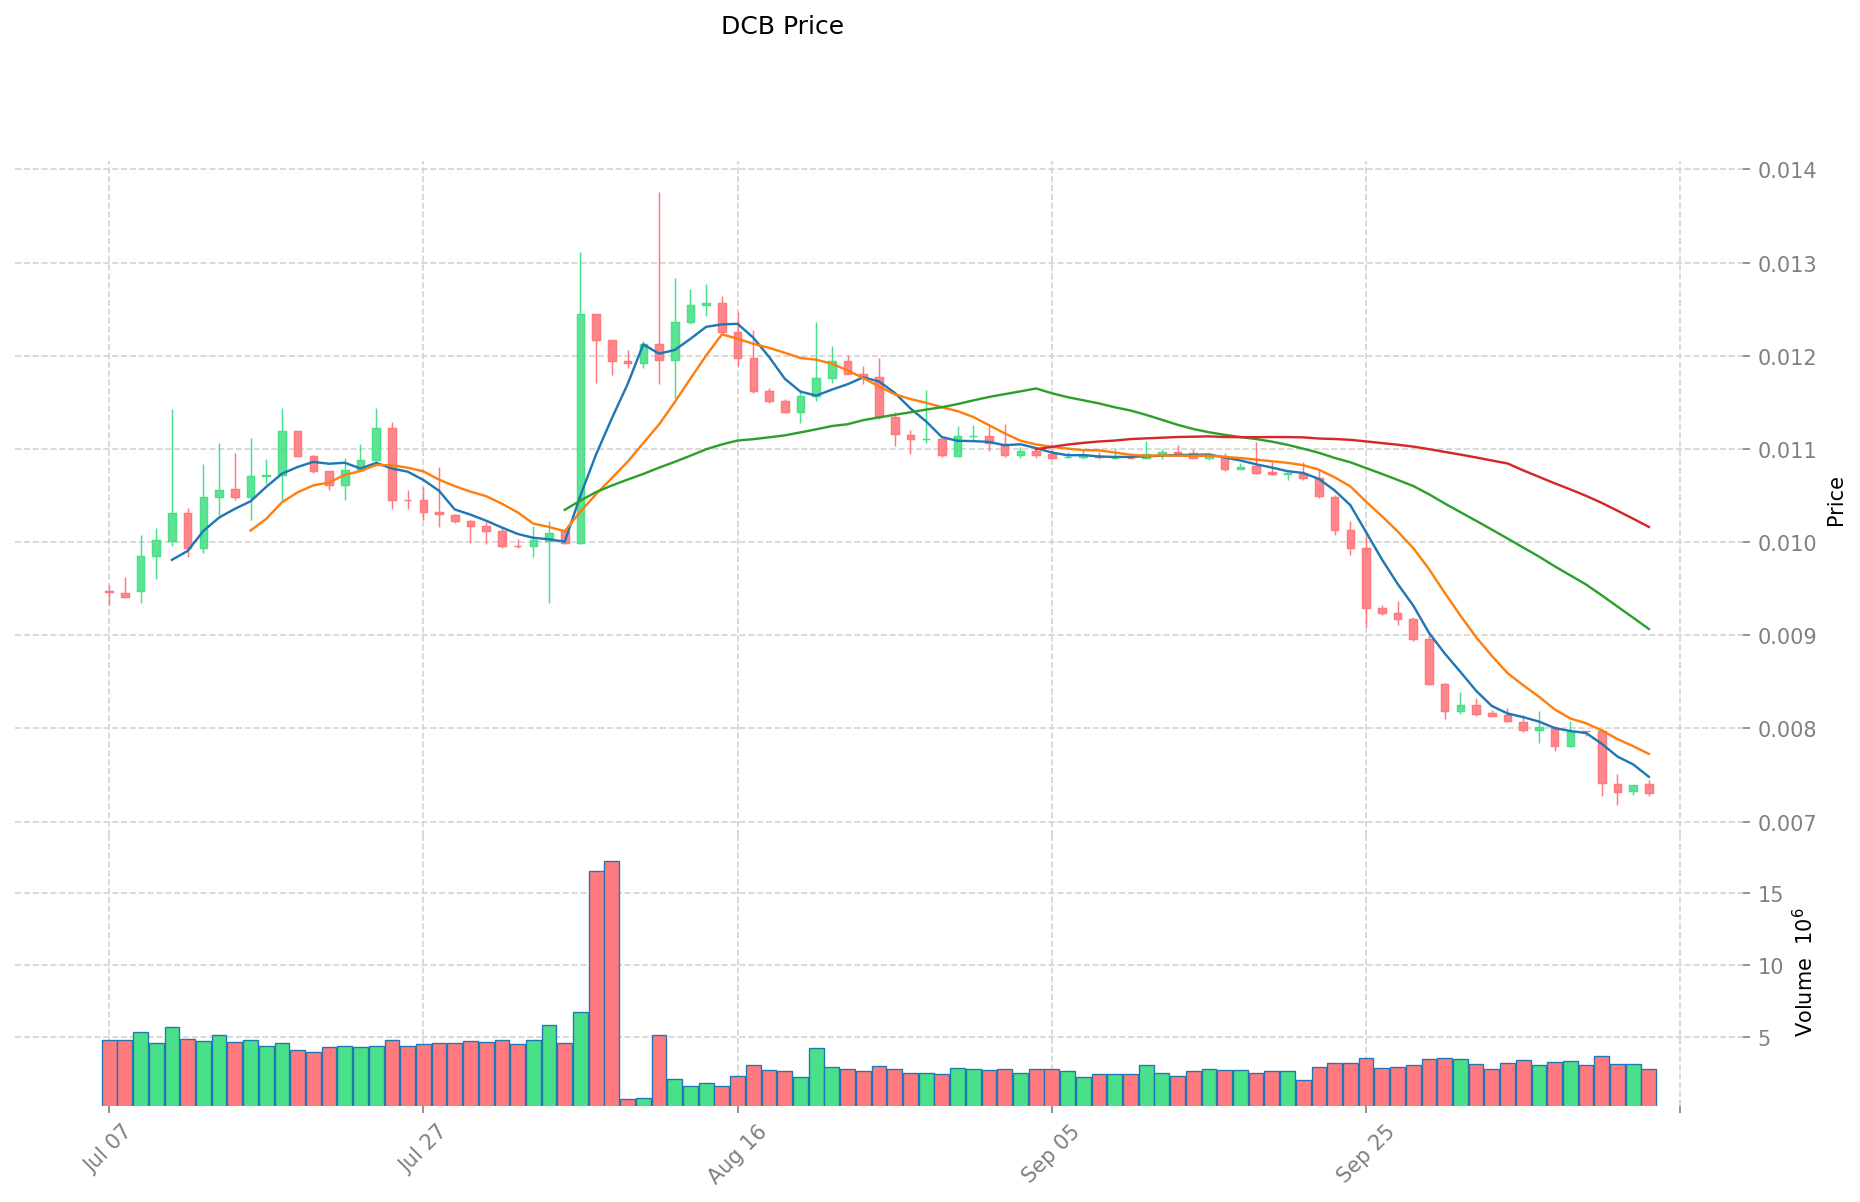
- 2024: 29 Mart’ta 0,19998 $ ile tüm zamanların en yüksek seviyesine ulaşarak önemli bir dönüm noktası yaşandı
- 2025: Sert düşüşle 11 Ekim’de 0,007175 $ ile tüm zamanların en düşük seviyesine indi
- 2025: Düşüş eğilimi sürüyor; 14 Ekim itibarıyla fiyat 0,0073 $’da
DCB Güncel Piyasa Görünümü
14 Ekim 2025 tarihi itibarıyla DCB, 0,0073 $ seviyesinden işlem görerek son 24 saatte %1,37 düşüş kaydetmiştir. Token, son bir haftada %7,32, son 30 günde ise %33,42 oranında ciddi bir değer kaybı yaşamıştır. Yıllık performansta ise %77,64’lük bir gerileme söz konusudur.
DCB’nin mevcut piyasa değeri 2.787.469,93 $ olup, genel kripto para sıralamasında 2.150’nci sıradadır. Dolaşımdaki arzı 381.845.196 DCB token ile toplam arzın %38,18’ine karşılık gelirken, 24 saatlik işlem hacmi 20.532,51 $ ile ılımlı bir işlem hareketliliğine işaret etmektedir.
DCB, 29 Mart 2024’te kaydedilen 0,19998 $’lık tarihsel zirvenin %96,35 altında işlem görmektedir. Şu anki fiyatı, yalnızca üç gün önce 11 Ekim 2025’te ulaşılan 0,007175 $’lık tarihsel dip seviyesinin %1,74 üzerinde bulunuyor.
Güncel DCB piyasa fiyatını görüntülemek için tıklayın
DCB Piyasa Duyarlılığı Endeksi
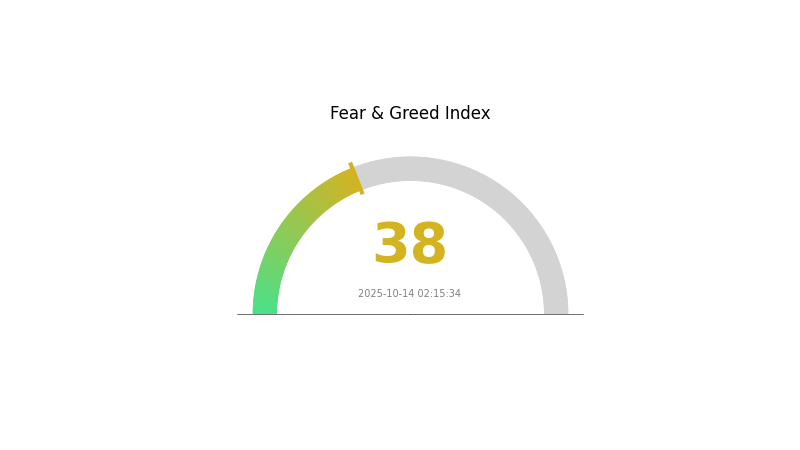
2025-10-14 Korku ve Açgözlülük Endeksi: 38 (Korku)
Güncel Korku & Açgözlülük Endeksi için tıklayın
Kripto piyasasında temkinli bir hava hâkim; Korku ve Açgözlülük Endeksi 38 ile “korku” seviyesini göstermektedir. Bu durum, yatırımcıların çekingen ve riskten kaçınan bir pozisyonda olduğunu gösterir. Ancak, zıt stratejili yatırımcılar için korku dönemleri alım fırsatı doğurabilir. Karar vermeden önce detaylı araştırma yapmak ve kişisel risk toleransınızı göz önünde bulundurmak büyük önem taşır. Piyasa duyarlılığının hızla değişebileceğini ve geçmiş performansın gelecek için garanti oluşturmadığını unutmayın.
DCB Varlık Dağılımı
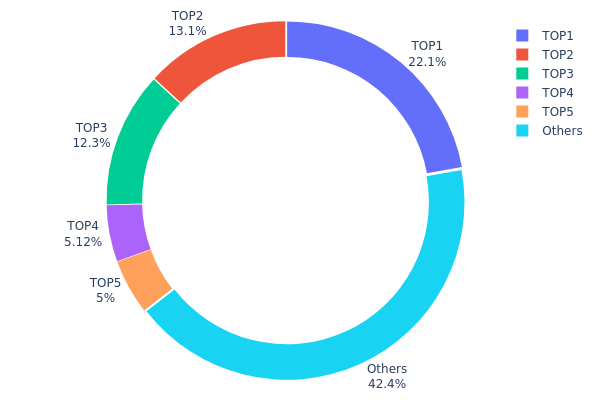
Adres bazında varlık dağılımı, DCB tokenlarının belirli adreslerde yoğunlaşıp yoğunlaşmadığına dair kritik bir analiz sunar. İlk 5 adresin toplam arzın %57,6’sını elinde bulundurması, DCB’de ciddi bir yoğunlaşmaya işaret etmektedir. En büyük adres %22,09’luk payla başı çekerken, onu %13,14 ve %12,25 ile diğer iki büyük adres izlemektedir. Bu yüksek yoğunlaşma, piyasa manipülasyonu ve fiyat dalgalanması riskini artırır.
Bu tür bir dağılım, DCB’nin piyasa dinamiklerinde önemli dalgalanmalara yol açabilir. Büyük sahiplerin alım ya da satış yapması, fiyat oynaklığını artırabileceği gibi, merkeziyetsizlik ilkesinin de zedelenmesine neden olabilir. Az sayıda adresin yönetimde ve fiyat oluşumunda etkili olması, uzun vadede zincir üstü istikrar ve yatırımcı güveni açısından kritik bir husustur.
Arzın %42,4’ü ise diğer adresler arasında dağılmış olsa da, mevcut dağılım DCB için düşük derecede merkeziyetsizliğe işaret etmektedir. Bu yapı, token’ın zincirdeki stabilitesini ve uzun vadeli potansiyelini olumsuz etkileyebileceğinden, yatırımcılar için dikkat edilmesi gereken bir unsurdur.
Güncel DCB Varlık Dağılımını görmek için tıklayın
| Üst | Adres | Varlık Miktarı | Varlık (%) |
|---|---|---|---|
| 1 | 0x8c51...241c22 | 220.990,06K | 22,09% |
| 2 | 0xe740...e48723 | 131.462,94K | 13,14% |
| 3 | 0xeee7...6d2be9 | 122.589,96K | 12,25% |
| 4 | 0x0000...00dead | 51.212,28K | 5,12% |
| 5 | 0x7ff7...def4a7 | 50.000,00K | 5,00% |
| - | Diğerleri | 423.744,75K | 42,4% |
II. DCB’nin Gelecekteki Fiyatını Etkileyecek Temel Unsurlar
Arz Mekanizması
- Sabit Arz: DCB’nin toplam arzı sabittir; bu da kıtlık yaratarak talep değişimlerine bağlı fiyat hareketlerini tetikleyebilir.
Makroekonomik Koşullar
- Enflasyona Karşı Koruma Özelliği: DCB, diğer dijital varlıklar gibi enflasyona karşı potansiyel bir koruma aracı olarak değerlendirilebilir.
Teknolojik Gelişim ve Ekosistem Büyümesi
- Ekosistem Uygulamaları: DCB ekosisteminde çeşitli merkeziyetsiz uygulamaların (DApp) geliştirilmesi, platformun büyümesine ve kullanım değerine katkı sağlar.
III. 2025-2030 Dönemi DCB Fiyat Tahmini
2025 Görünümü
- Ihtiyatlı tahmin: 0,00409 $ – 0,0073 $
- Dengeli tahmin: 0,0073 $ – 0,0081 $
- İyimser tahmin: 0,0081 $ – 0,0089 $ (olumlu piyasa havası ve artan benimseme ile mümkün)
2027-2028 Görünümü
- Piyasa evresi beklentisi: Yükselen oynaklık ile birlikte büyüme dönemi
- Fiyat aralığı tahmini:
- 2027: 0,00788 $ – 0,0111 $
- 2028: 0,00511 $ – 0,01233 $
- Temel katalizörler: Teknolojik ilerlemeler, yaygın piyasa benimsemesi ve düzenleyici netlik
2029-2030 Uzun Vadeli Görünüm
- Temel senaryo: 0,01118 $ – 0,01392 $ (istikrarlı piyasa büyümesi ve benimseme varsayımıyla)
- İyimser senaryo: 0,01392 $ – 0,01666 $ (güçlü piyasa performansı ve artan kullanım ile)
- Dönüştürücü senaryo: 0,01666 $ – 0,02000 $ (devrim niteliğinde yenilikler ve yaygın kabul varsayımıyla)
- 2030-12-31: DCB 0,01433 $ (yıl sonu konsolidasyonu öncesi potansiyel zirve)
| Yıl | Tahmini En Yüksek Fiyat | Tahmini Ortalama Fiyat | Tahmini En Düşük Fiyat | Değişim Oranı (%) |
|---|---|---|---|---|
| 2025 | 0,0089 | 0,0073 | 0,00409 | 0 |
| 2026 | 0,0098 | 0,0081 | 0,00421 | 10 |
| 2027 | 0,0111 | 0,00895 | 0,00788 | 22 |
| 2028 | 0,01233 | 0,01003 | 0,00511 | 37 |
| 2029 | 0,01666 | 0,01118 | 0,00861 | 53 |
| 2030 | 0,01433 | 0,01392 | 0,0071 | 90 |
IV. DCB için Uzman Yatırım Stratejisi ve Risk Yönetimi
DCB Yatırım Yaklaşımları
(1) Uzun Vadeli Tutma Stratejisi
- Kimler için uygun: Yüksek risk toleransına sahip, uzun vadeli yatırımcılar
- Uygulama önerileri:
- Piyasa geri çekilmelerinde DCB biriktirin
- Fiyat hedefleri belirleyip portföyünüzü düzenli olarak gözden geçirin
- Token’ları donanım cüzdanlarında güvenle saklayın
(2) Aktif Alım-Satım Stratejisi
- Teknik analiz araçları:
- Hareketli Ortalamalar: Trend ile giriş ve çıkış seviyelerini belirleyin
- RSI (Göreceli Güç Endeksi): Aşırı alım/aşırı satım seviyelerini tespit edin
- Dalgalı işlemde dikkat edilmesi gerekenler:
- DCB’nin genel kripto piyasasıyla korelasyonunu takip edin
- Zarar durdur emirleri ile riskinizi yönetin
DCB Risk Yönetimi Çerçevesi
(1) Varlık Dağılımı İlkeleri
- Temkinli yatırımcılar: Kripto portföyünün %1-3’ü
- Agresif yatırımcılar: Kripto portföyünün %5-10’u
- Profesyonel yatırımcılar: Kripto portföyünün %15’ine kadar
(2) Riskten Korunma Yöntemleri
- Diversifikasyon: Yatırımlarınızı farklı kripto varlıklara dağıtın
- Zarar durdur emirleri: Olası kayıpları sınırlamak için kullanın
(3) Güvenli Saklama Yöntemleri
- Sıcak cüzdan önerisi: Gate Web3 cüzdanı
- Soğuk depolama: Uzun vadeli tutum için donanım cüzdanı
- Güvenlik önlemleri: İki aşamalı kimlik doğrulama etkinleştirin, güçlü şifreler oluşturun
V. DCB’nin Karşılaşabileceği Riskler ve Zorluklar
DCB Piyasa Riskleri
- Oynaklık: Kripto piyasasında aşırı fiyat dalgalanmaları sık görülür
- Likitide: Düşük işlem hacmi, yüksek miktarlı alım-satımları zorlaştırabilir
- Rekabet: Web3 alanında yeni projeler DCB’nin konumunu zorlayabilir
DCB Düzenleyici Riskler
- Düzenleyici belirsizlik: Devlet politikalarındaki değişiklikler DCB’yi etkileyebilir
- Uyum zorlukları: Farklı ülkelerdeki mevzuata ayak uydurma gerekliliği
- Hukuki sınırlamalar: Bazı ülkelerde DCB’nin kullanımı veya ticareti kısıtlanabilir
DCB Teknik Riskleri
- Akıllı sözleşme güvenlik açıkları: Temel kodda olası riskler
- Ölçeklenebilirlik sorunları: Ağ yoğunluğunda performans sorunları
- Teknolojik eskime: Blockchain alanındaki hızlı gelişmeler DCB’yi geride bırakabilir
VI. Sonuç ve Eylem Önerileri
DCB Yatırım Değeri Analizi
DCB, Web3 ekosisteminde yüksek riskli ve yüksek potansiyele sahip bir yatırım fırsatı sunar. Uzun vadeli değer önerisi, merkeziyetsiz finans ve Web3 gelişimine bağlı olsa da, kısa vadede yüksek oynaklık ve düzenleyici belirsizlikler ciddi riskler oluşturmaktadır.
DCB Yatırım Tavsiyeleri
✅ Yeni başlayanlar: Projeyi yakından tanırken küçük ve düzenli yatırımlarla maruziyet sağlayın ✅ Deneyimli yatırımcılar: Sıkı risk yönetimiyle maliyet ortalaması yöntemi uygulayın ✅ Kurumsal yatırımcılar: Kapsamlı inceleme yaparak DCB’yi çeşitlendirilmiş kripto portföyünde değerlendirin
DCB Alım-Satım Yöntemleri
- Spot alım-satım: Gate.com üzerinden DCB tokenlarını alıp satabilirsiniz
- Staking: Varsa staking programlarına katılarak pasif gelir elde edin
- DeFi entegrasyonu: DCB destekli merkeziyetsiz finans protokollerini değerlendirin
Kripto para yatırımları çok yüksek risk içerir. Bu makale yatırım tavsiyesi değildir. Yatırım kararınızı kendi risk profilinize göre dikkatlice vermeli ve profesyonel finansal danışmanlardan destek almalısınız. Kaybetmeyi göze alabileceğinizden fazla yatırım yapmayın.
SSS
DCB’nin gelecekteki görünümü nedir?
DCB, benimsenme ve değer artışı açısından gelecek vaat eden bir projedir. Kripto piyasası geliştikçe, DCB’nin hem kullanım alanı hem de talebi artabilir; bu da fiyat kazancına ve Web3 ekosisteminde yeni kullanım örneklerine zemin hazırlayabilir.
DCB için fiyat hedefi nedir?
Piyasa analizleri ve mevcut eğilimler doğrultusunda DCB’nin 2025 yıl sonuna kadar 0,50 $ seviyesine ulaşması, ardından da büyümesini sürdürmesi beklenmektedir.
DCB banka hisselerinde neden düşüş yaşanıyor?
DCB banka hisselerindeki düşüş, piyasa oynaklığı, ekonomik belirsizlikler veya bankacılık sektörüne özgü zorluklardan kaynaklanıyor olabilir. Yatırımcılar, son finansal açıklamalar ya da sektörel gelişmelere tepki veriyor olabilir.
2025 için kripto para fiyat tahmini nedir?
Güncel piyasa eğilimleri ve uzman öngörülerine göre, kripto piyasasının 2025’e kadar önemli bir büyüme göstermesi bekleniyor. Birçok analist Bitcoin’in 100.000-150.000 $ aralığına, Ethereum’un ise 10.000-15.000 $ seviyelerine ulaşabileceğini öngörüyor.
Share
Content
Giriş: DCB’nin Piyasa Konumu ve Yatırım Değeri
I. DCB Fiyat Geçmişi ve Güncel Piyasa Durumu
II. DCB’nin Gelecekteki Fiyatını Etkileyecek Temel Unsurlar
III. 2025-2030 Dönemi DCB Fiyat Tahmini
IV. DCB için Uzman Yatırım Stratejisi ve Risk Yönetimi
V. DCB’nin Karşılaşabileceği Riskler ve Zorluklar
VI. Sonuç ve Eylem Önerileri
SSS
How to Buy Cryptocurrency


Trending Cryptocurrencies


2025 Haziran için Chainlink Fiyatı Üzerine Son Analiz ve Yatırım Beklentisi

LMWR vs AAVE: Dil Azınlığı Okuma Yöntemleri ile Afrika Amerikan Vernaküler İngilizcesi Arasındaki Dilbilimsel Tartışmayı Anlamak
Vaulta (A) iyi bir yatırım mı?: Bu yükselen kripto paranın potansiyeli ve risklerini inceliyoruz
Decubate (DCB) iyi bir yatırım mı?: Bu yeni ortaya çıkan kripto paranın potansiyeli ve riskleri üzerine analiz

Debox (BOX) Yatırım İçin Uygun mu?: Web3 Depolama Sektöründe Büyüme Potansiyeli ve Risklerin Değerlendirilmesi

2025 POND Fiyat Tahmini: Merkeziyetsiz Veri Pazarlarının Geleceğinde Yol Alıyoruz
Dropee Günlük Kombinasyonu 12 Aralık 2025

Tomarket Günlük Kombinasyonu 12 Aralık 2025

SEI Airdrop Ödülleri’ne Katılım ve Talep Etme Kılavuzu

Kripto para birimlerinde algoritmik alım satım için etkili stratejiler
Stock-to-Flow Model ile Bitcoin'in Değerlemesini Anlamak