2025 DBRPrice Prediction: Analyzing Market Trends and Future Value Potential for Digital Bond Reserves
Introduction: DBR's Market Position and Investment Value
deBridge (DBR), as a key player in DeFi's internet of liquidity, has been enabling real-time movement of assets and information across the DeFi landscape since its inception. As of 2025, deBridge's market capitalization has reached $48,384,000, with a circulating supply of approximately 1,800,000,000 tokens, and a price hovering around $0.02688. This asset, often referred to as the "liquidity bridge of DeFi," is playing an increasingly crucial role in facilitating cross-chain interactions and enhancing DeFi liquidity.
This article will provide a comprehensive analysis of deBridge's price trends from 2025 to 2030, considering historical patterns, market supply and demand, ecosystem development, and macroeconomic factors to offer professional price predictions and practical investment strategies for investors.
I. DBR Price History Review and Current Market Status
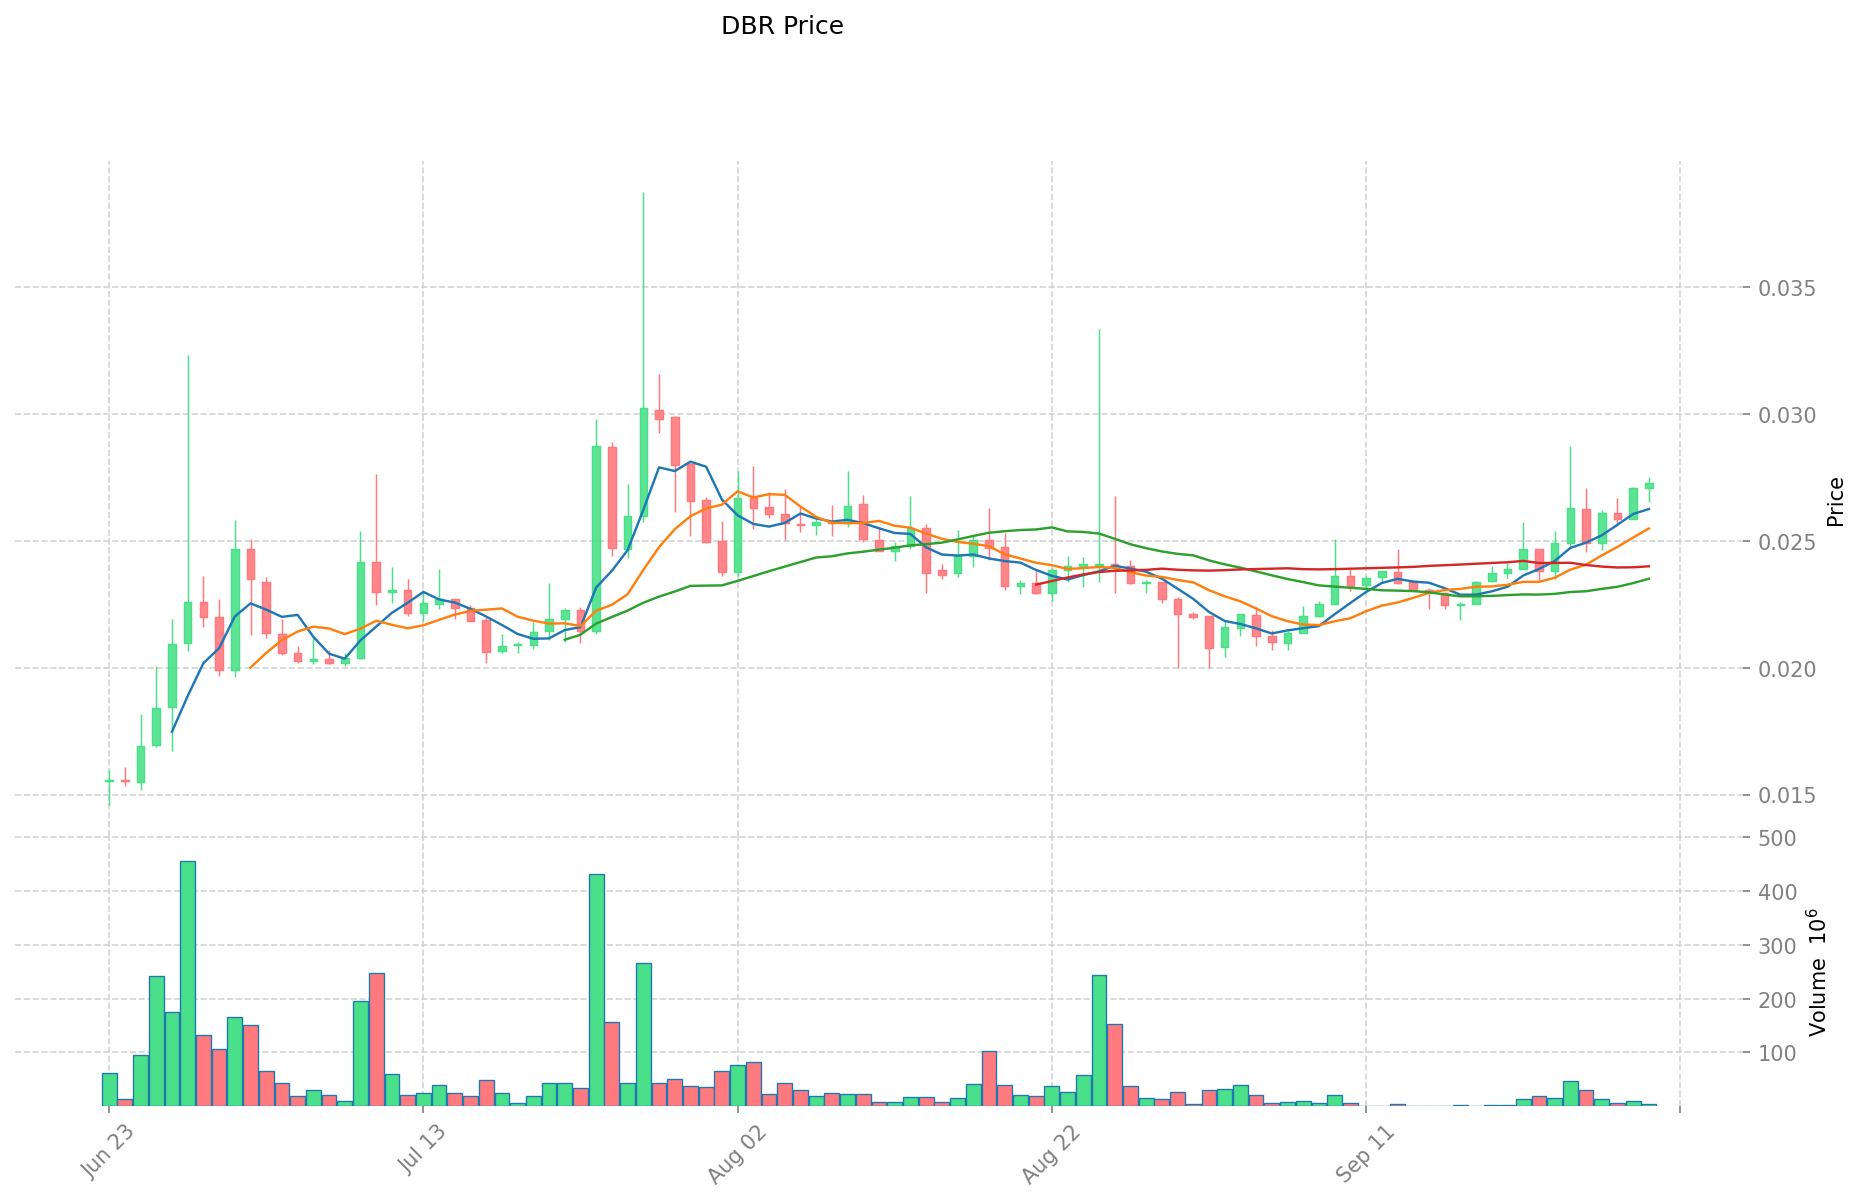
DBR Historical Price Evolution
- 2024: Initial launch, price started at $0.03
- 2024: Reached all-time low of $0.005 on October 17
- 2024: Achieved all-time high of $0.05764 on December 22
DBR Current Market Situation
As of September 30, 2025, DBR is trading at $0.02688, ranking 690th in the cryptocurrency market. The token has experienced a slight decline of 0.51% in the past 24 hours, with a trading volume of $128,641.46. DBR's current price represents a 53.37% decrease from its all-time high and a 437.6% increase from its all-time low.
The market capitalization of DBR stands at $48,384,000, with a circulating supply of 1,800,000,000 DBR tokens. This represents 18% of the total supply of 10,000,000,000 DBR. The fully diluted market cap is $268,800,000.
Short-term price trends show mixed performance: -0.48% in the past hour and -0.51% in the past 24 hours. However, longer-term trends are more positive, with gains of 9.84% over the past week and 22.27% over the past month. The year-to-date performance shows a decline of 33.65%.
Click to view the current DBR market price
DBR Market Sentiment Indicator
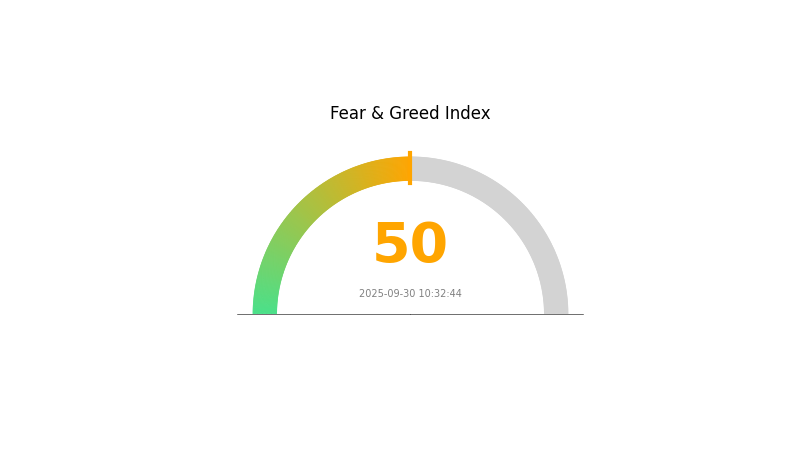
2025-09-30 Fear and Greed Index: 50 (Neutral)
Click to view the current Fear & Greed Index
The cryptocurrency market sentiment is currently balanced, with the Fear and Greed Index at 50, indicating a neutral stance. This equilibrium suggests that investors are neither overly pessimistic nor excessively optimistic about the market's prospects. Such a neutral position often presents opportunities for thoughtful investment decisions, as it typically reflects a more rational market environment. Traders and investors should remain vigilant, analyzing both potential risks and growth opportunities in this balanced climate.
DBR Holdings Distribution
The address holdings distribution chart provides insight into the concentration of DBR tokens among different wallet addresses. Analysis of the current data reveals a significant level of concentration among the top holders. The top 5 addresses collectively control 75.1% of the total DBR supply, with the largest holder possessing 23% of all tokens.
This high concentration of holdings raises concerns about potential market manipulation and price volatility. With such a large portion of tokens in few hands, there's an increased risk of sudden large-scale selling or buying activities that could dramatically impact DBR's market price. Furthermore, this concentration may undermine the project's decentralization efforts, as decision-making power could be disproportionately influenced by a small number of large token holders.
The current distribution structure suggests a relatively low level of on-chain stability and a potential vulnerability in the market. While a certain degree of concentration is common in many cryptocurrency projects, the level observed in DBR's case is notably high. This could lead to increased scrutiny from potential investors and may impact the perceived fairness and accessibility of the token ecosystem.
Click to view the current DBR Holdings Distribution
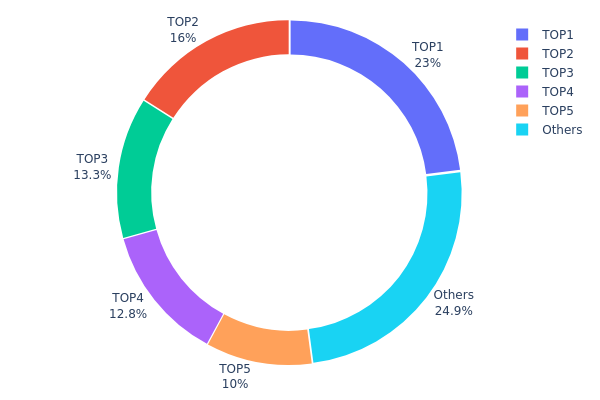
| Top | Address | Holding Qty | Holding (%) |
|---|---|---|---|
| 1 | EKFy8J...DkgBio | 2300000.00K | 23.00% |
| 2 | ARejja...qBRBJn | 1600000.00K | 16.00% |
| 3 | 4NDX7s...49WXk7 | 1330623.27K | 13.30% |
| 4 | 4BtvjB...6BKn1R | 1280351.93K | 12.80% |
| 5 | 2V7DfG...fxJfYA | 1000000.00K | 10.00% |
| - | Others | 2488987.30K | 24.9% |
II. Key Factors Affecting DBR's Future Price
Market Sentiment
- Investor Confidence: Investor sentiment and confidence have a direct impact on DBR's price movements. Positive news about widespread adoption or major technological breakthroughs in DBR can significantly influence its price.
Macroeconomic Environment
- Economic Trends: Macroeconomic trends play a crucial role in determining DBR's value against fiat currencies.
Technical Development
- Technological Innovation: Advancements and innovations in DBR's underlying technology can affect its price and adoption rate.
Regulatory Environment
- Policy Changes: Regulatory decisions and policy changes in various countries can have a substantial impact on DBR's price and market dynamics.
III. DBR Price Prediction for 2025-2030
2025 Outlook
- Conservative prediction: $0.02588 - $0.02696
- Neutral prediction: $0.02696 - $0.03262
- Optimistic prediction: $0.03262 - $0.03828 (requires positive market sentiment)
2027-2028 Outlook
- Market phase expectation: Potential growth phase
- Price range forecast:
- 2027: $0.02192 - $0.04896
- 2028: $0.03463 - $0.05001
- Key catalysts: Increased adoption and technological advancements
2030 Long-term Outlook
- Base scenario: $0.05061 - $0.05751 (assuming steady market growth)
- Optimistic scenario: $0.05751 - $0.06959 (assuming strong market performance)
- Transformative scenario: Above $0.06959 (extremely favorable market conditions)
- 2030-12-31: DBR $0.05751 (113% increase from 2025)
| 年份 | 预测最高价 | 预测平均价格 | 预测最低价 | 涨跌幅 |
|---|---|---|---|---|
| 2025 | 0.03828 | 0.02696 | 0.02588 | 0 |
| 2026 | 0.04045 | 0.03262 | 0.01827 | 21 |
| 2027 | 0.04896 | 0.03654 | 0.02192 | 35 |
| 2028 | 0.05001 | 0.04275 | 0.03463 | 59 |
| 2029 | 0.06864 | 0.04638 | 0.02551 | 72 |
| 2030 | 0.06959 | 0.05751 | 0.05061 | 113 |
IV. Professional Investment Strategies and Risk Management for DBR
DBR Investment Methodology
(1) Long-term Holding Strategy
- Suitable for: Long-term investors with high risk tolerance
- Operation suggestions:
- Accumulate DBR during market dips
- Set price targets and regularly review portfolio
- Store DBR in secure non-custodial wallets
(2) Active Trading Strategy
- Technical analysis tools:
- Moving Averages: Monitor short-term and long-term trends
- Relative Strength Index (RSI): Identify overbought/oversold conditions
- Key points for swing trading:
- Monitor deBridge ecosystem developments
- Track overall DeFi market sentiment
DBR Risk Management Framework
(1) Asset Allocation Principles
- Conservative investors: 1-3% of crypto portfolio
- Aggressive investors: 5-10% of crypto portfolio
- Professional investors: Up to 15% of crypto portfolio
(2) Risk Hedging Solutions
- Diversification: Spread investments across multiple DeFi projects
- Stop-loss orders: Set automatic sell orders to limit potential losses
(3) Secure Storage Solutions
- Hot wallet recommendation: Gate Web3 Wallet
- Cold storage solution: Hardware wallet for long-term holding
- Security precautions: Enable two-factor authentication, use unique passwords
V. Potential Risks and Challenges for DBR
DBR Market Risks
- High volatility: DBR price may experience significant fluctuations
- Liquidity risk: Limited trading volume may impact ability to exit positions
- Competition: Emerging DeFi projects may challenge deBridge's market position
DBR Regulatory Risks
- Uncertain regulatory landscape: Potential for increased scrutiny of DeFi projects
- Cross-chain compliance: Challenges in adhering to regulations across multiple blockchains
- Token classification: Risk of DBR being classified as a security
DBR Technical Risks
- Smart contract vulnerabilities: Potential for exploits in deBridge's code
- Cross-chain bridge security: Risks associated with inter-blockchain transactions
- Scalability challenges: Potential limitations in handling increased transaction volume
VI. Conclusion and Action Recommendations
DBR Investment Value Assessment
DBR presents a high-risk, high-potential opportunity in the evolving DeFi landscape. Long-term value lies in deBridge's cross-chain liquidity solutions, while short-term risks include market volatility and regulatory uncertainties.
DBR Investment Recommendations
✅ Beginners: Consider small, experimental positions to understand deBridge ecosystem ✅ Experienced investors: Implement dollar-cost averaging strategy with set profit targets ✅ Institutional investors: Conduct thorough due diligence and consider OTC options for large positions
DBR Trading Participation Methods
- Spot trading: Available on Gate.com and other exchanges
- DeFi protocols: Participate in liquidity provision on deBridge platform
- OTC trading: For large volume transactions to minimize market impact
Cryptocurrency investments carry extremely high risk. This article does not constitute investment advice. Investors should make decisions carefully based on their own risk tolerance and are advised to consult professional financial advisors. Never invest more than you can afford to lose.
FAQ
Is deBridge a good investment?
Yes, deBridge shows promising potential. Its innovative cross-chain technology and growing ecosystem make it an attractive investment option in the Web3 space.
What is the price prediction for deBridge Token in 2030?
Based on recent price data analysis, the price of deBridge Token (DBR) is predicted to potentially reach $0.0941 by 2030.
What is the price prediction for Electroneum in 2025?
Based on long-term forecasts, Electroneum is predicted to reach a price of $0.003459 by 2025.
How much is a dbr coin worth?
As of September 2025, a DBR coin is worth approximately $0.02677. However, cryptocurrency prices can be highly volatile and subject to rapid changes.
Share
Content
Introduction: DBR's Market Position and Investment Value
I. DBR Price History Review and Current Market Status
II. Key Factors Affecting DBR's Future Price
III. DBR Price Prediction for 2025-2030
IV. Professional Investment Strategies and Risk Management for DBR
V. Potential Risks and Challenges for DBR
VI. Conclusion and Action Recommendations
FAQ

