2025 BR Price Prediction: Market Analysis and Future Outlook for Brazilian Real Exchange Rates
Introduction: BR's Market Position and Investment Value
Bedrock (BR), as the world's first multi-asset liquid restaking protocol, has achieved significant milestones since its inception. As of 2025, Bedrock's market capitalization has reached $17,068,300, with a circulating supply of approximately 230,000,000 tokens, and a price hovering around $0.07421. This asset, known as the "pioneer of Bitcoin staking," is playing an increasingly crucial role in the DeFi ecosystem and Bitcoin market.
This article will comprehensively analyze Bedrock's price trends from 2025 to 2030, combining historical patterns, market supply and demand, ecosystem development, and macroeconomic environment to provide investors with professional price predictions and practical investment strategies.
I. BR Price History Review and Current Market Status
BR Historical Price Evolution
- 2025: Launch of uniBTC, price peaked at $0.2226
- 2025: Market correction, price dropped to $0.01
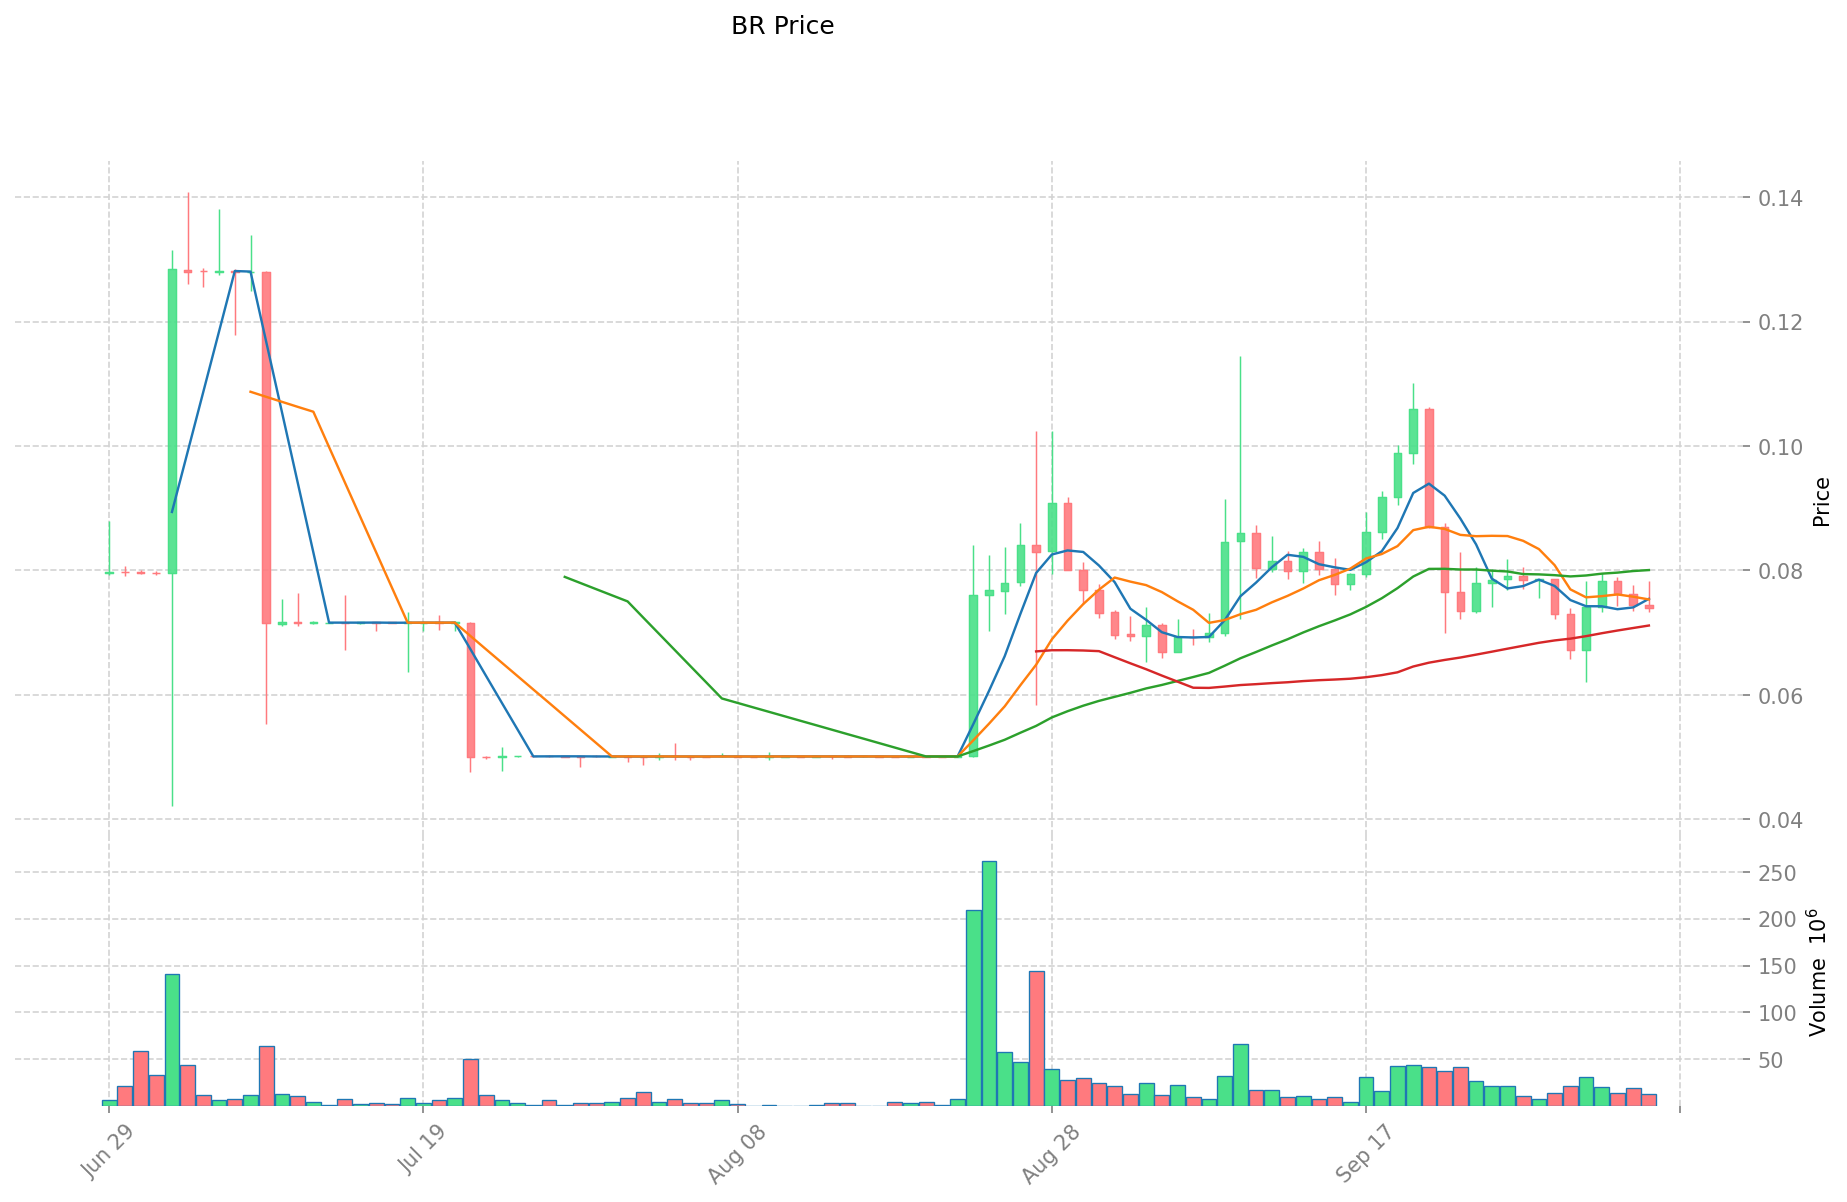
- 2025: Recovery phase, price stabilized around $0.07421
BR Current Market Situation
As of October 6, 2025, BR is trading at $0.07421, with a 24-hour trading volume of $1,151,420.71. The token has experienced a slight decrease of 0.2% in the past 24 hours. BR's market cap currently stands at $17,068,300, ranking it 1176th in the cryptocurrency market.
BR's price has shown mixed performance across different time frames. While it has seen a 7.47% increase over the past 30 days, it has declined by 5.18% in the last week. The token is currently trading significantly below its all-time high of $0.2226, recorded on March 24, 2025.
The circulating supply of BR is 230,000,000 tokens, which represents 23% of its total supply of 1,000,000,000. This relatively low circulation ratio suggests potential for future price movements as more tokens enter circulation.
Click to view the current BR market price
BR Market Sentiment Indicator
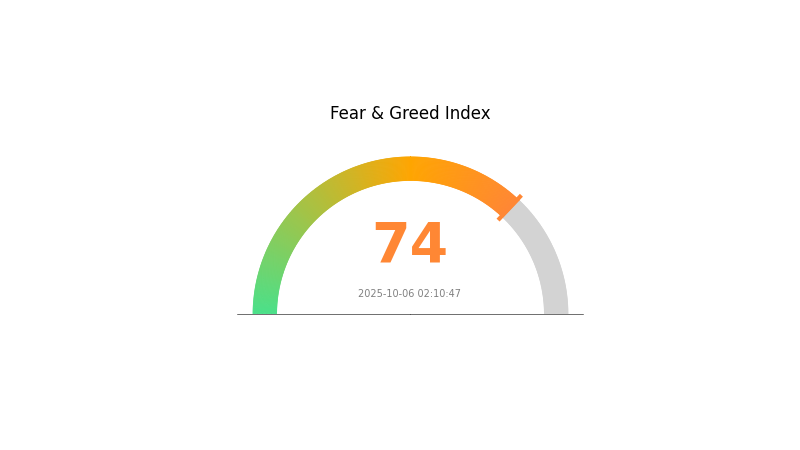
2025-10-06 Fear and Greed Index: 74 (Greed)
Click to view the current Fear & Greed Index
The crypto market is currently experiencing a wave of optimism, with the Fear and Greed Index reaching 74, indicating strong greed. This suggests investors are feeling bullish and confident about the market's potential. However, it's important to remember that extreme greed can sometimes lead to overvaluation and increased volatility. Traders should exercise caution and consider diversifying their portfolios to manage risk effectively. As always, stay informed and make decisions based on thorough research and analysis.
BR Holdings Distribution
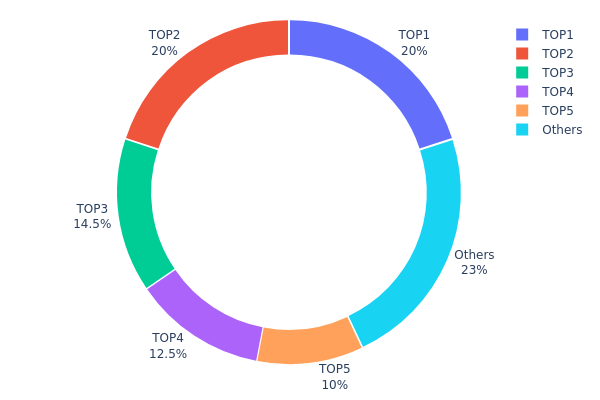
The address holdings distribution chart provides crucial insights into the concentration of BR tokens among different wallet addresses. Analysis of the provided data reveals a significant concentration of BR holdings among the top addresses. The top five addresses collectively hold 77% of the total BR supply, with two addresses each controlling 20% of the tokens.
This high concentration of holdings raises concerns about the decentralization and market stability of BR. The top two addresses, each holding 20% of the supply, have considerable influence over the token's circulating supply and potential price movements. Such concentration could lead to increased volatility if large holders decide to sell or move their holdings. Additionally, the centralization of tokens in a few hands may pose risks to the overall market structure and potentially enable market manipulation.
While 23% of BR tokens are distributed among other addresses, the current distribution pattern suggests a relatively centralized ownership structure. This concentration could impact the token's price discovery process and liquidity dynamics in the market. Investors and traders should be aware of these ownership dynamics when considering BR as part of their portfolio or trading strategies.
Click to view the current BR Holdings Distribution
| Top | Address | Holding Qty | Holding (%) |
|---|---|---|---|
| 1 | 0xd7cd...ad6a62 | 200000.00K | 20.00% |
| 2 | 0x3af2...70290d | 200000.00K | 20.00% |
| 3 | 0xc22a...ec13f2 | 145000.00K | 14.50% |
| 4 | 0x3f36...afba4c | 125000.00K | 12.50% |
| 5 | 0xccdb...24b508 | 100000.00K | 10.00% |
| - | Others | 230000.00K | 23% |
II. Key Factors Influencing BR's Future Price
Technical Development and Ecosystem Building
-
AR/BR Indicator: The AR/BR indicator is a technical analysis tool that can predict price reversals. When there's a divergence between the AR/BR indicator and the price trend, it often signals a potential price reversal.
-
Market Sentiment: The BR indicator, also known as the Buy/Sell Willingness Indicator, is used to analyze the strength of buying and selling intentions in the market. It plays a crucial role in reflecting market sentiment and predicting future price movements.
-
Ecosystem Applications: The BRAR (AR/BR) indicator, originating from Japan, is composed of the AR (Atmosphere Rating) and BR (Buy/Sell Ratio) indicators. These indicators are widely used in quantitative trading strategies and technical analysis, forming an important part of the BR ecosystem.
III. BR Price Prediction for 2025-2030
2025 Outlook
- Conservative prediction: $0.05514 - $0.07452
- Neutral prediction: $0.07452 - $0.08309
- Optimistic prediction: $0.08309 - $0.09166 (requires positive market sentiment and increased adoption)
2027-2028 Outlook
- Market phase expectation: Potential growth phase with increasing adoption
- Price range forecast:
- 2027: $0.07201 - $0.11113
- 2028: $0.07301 - $0.13603
- Key catalysts: Technological advancements, wider market acceptance, and potential partnerships
2029-2030 Long-term Outlook
- Base scenario: $0.11802 - $0.14163 (assuming steady market growth and adoption)
- Optimistic scenario: $0.14163 - $0.16523 (assuming accelerated adoption and favorable market conditions)
- Transformative scenario: $0.15296 - $0.16523 (assuming breakthrough technological developments and mainstream integration)
- 2030-12-31: BR $0.15296 (potential peak before year-end consolidation)
| 年份 | 预测最高价 | 预测平均价格 | 预测最低价 | 涨跌幅 |
|---|---|---|---|---|
| 2025 | 0.09166 | 0.07452 | 0.05514 | 0 |
| 2026 | 0.09472 | 0.08309 | 0.0457 | 11 |
| 2027 | 0.11113 | 0.08891 | 0.07201 | 19 |
| 2028 | 0.13603 | 0.10002 | 0.07301 | 34 |
| 2029 | 0.16523 | 0.11802 | 0.09324 | 59 |
| 2030 | 0.15296 | 0.14163 | 0.08214 | 90 |
IV. Professional Investment Strategies and Risk Management for BR
BR Investment Methodology
(1) Long-term Holding Strategy
- Suitable for: Long-term investors seeking exposure to Bitcoin staking and DeFi innovations
- Operation suggestions:
- Accumulate BR tokens during market dips
- Stake BR tokens to earn additional rewards
- Store tokens in a secure non-custodial wallet
(2) Active Trading Strategy
- Technical analysis tools:
- Moving Averages: Use to identify trends and potential entry/exit points
- RSI (Relative Strength Index): Monitor overbought/oversold conditions
- Key points for swing trading:
- Set stop-loss orders to manage downside risk
- Take profits at predetermined price targets
BR Risk Management Framework
(1) Asset Allocation Principles
- Conservative investors: 1-3% of crypto portfolio
- Moderate investors: 3-5% of crypto portfolio
- Aggressive investors: 5-10% of crypto portfolio
(2) Risk Hedging Solutions
- Diversification: Spread investments across multiple DeFi and staking projects
- Stop-loss orders: Implement to limit potential losses
(3) Secure Storage Solutions
- Hot wallet recommendation: Gate Web3 Wallet
- Cold storage solution: Hardware wallet for long-term holdings
- Security precautions: Enable two-factor authentication, use strong passwords, and keep private keys offline
V. Potential Risks and Challenges for BR
BR Market Risks
- Price volatility: BR token value may fluctuate significantly
- Liquidity risk: Limited trading volume could impact entry/exit
- Competition: Other Bitcoin staking and DeFi projects may emerge
BR Regulatory Risks
- Regulatory uncertainty: Evolving DeFi regulations may impact BR's operations
- Cross-border compliance: Varying international regulations could limit adoption
- Tax implications: Unclear tax treatment of staking rewards in some jurisdictions
BR Technical Risks
- Smart contract vulnerabilities: Potential for exploits in the protocol
- Scalability challenges: High network congestion could affect performance
- Interoperability issues: Compatibility problems with other blockchain networks
VI. Conclusion and Action Recommendations
BR Investment Value Assessment
BR offers exposure to the growing Bitcoin staking and multi-chain DeFi ecosystem. While it presents long-term potential in the BTCFi space, investors should be aware of short-term volatility and regulatory uncertainties.
BR Investment Recommendations
✅ Beginners: Start with small positions and focus on learning about DeFi and staking ✅ Experienced investors: Consider allocating a portion of your portfolio to BR as part of a diversified DeFi strategy ✅ Institutional investors: Evaluate BR as part of a broader crypto asset allocation, focusing on its potential to generate yield from Bitcoin holdings
BR Trading Participation Methods
- Spot trading: Buy and sell BR tokens on Gate.com
- Staking: Participate in BR's staking programs for additional rewards
- DeFi integration: Explore BR's multi-chain DeFi ecosystem for yield opportunities
Cryptocurrency investments carry extremely high risks, and this article does not constitute investment advice. Investors should make decisions carefully based on their own risk tolerance and are advised to consult professional financial advisors. Never invest more than you can afford to lose.
FAQ
Will BitTorrent coin reach $1?
It's possible for BitTorrent coin to reach $1 if market conditions and demand are favorable. However, as of 2025, no definitive prediction can be made due to the volatile nature of cryptocurrencies.
Where will BitTorrent be in 5 years?
By 2030, BitTorrent could see significant growth. With continued token burning and increased adoption, its value may rise substantially. Success will depend on user engagement and technological advancements in the decentralized file-sharing space.
Can Bone ShibaSwap reach $1000?
No, Bone ShibaSwap is unlikely to reach $1000. Current predictions suggest a maximum price of $1.34 by 2025, based on market analysis and historical trends.
Will BTC reach $1 B?
While Bitcoin has shown remarkable growth, reaching $1 billion per coin is extremely unlikely. It would require an unprecedented market cap far beyond global wealth.
Share
Content