2025 ARTEM Price Prediction: Analyzing Market Trends and Potential Growth Factors
Introduction: ARTEM's Market Position and Investment Value
ARTEM Coin (ARTEM), as a governance token for blue-chip contemporary art and luxury NFT acquisitions, has been facilitating planned projects in the art world since its inception in 2022. As of 2025, ARTEM's market capitalization has reached $597,610, with a circulating supply of approximately 399,205,100 tokens, and a price hovering around $0.001497. This asset, known as the "Art Investment Token," is playing an increasingly crucial role in the intersection of decentralized finance and fine art.
This article will comprehensively analyze ARTEM's price trends from 2025 to 2030, combining historical patterns, market supply and demand, ecosystem development, and macroeconomic factors to provide investors with professional price predictions and practical investment strategies.
I. ARTEM Price History Review and Current Market Status
ARTEM Historical Price Evolution
- 2022: All-time high reached, price peaked at $0.101077 on January 11
- 2023: Market downturn, price hit all-time low of $0.00101022 on June 12
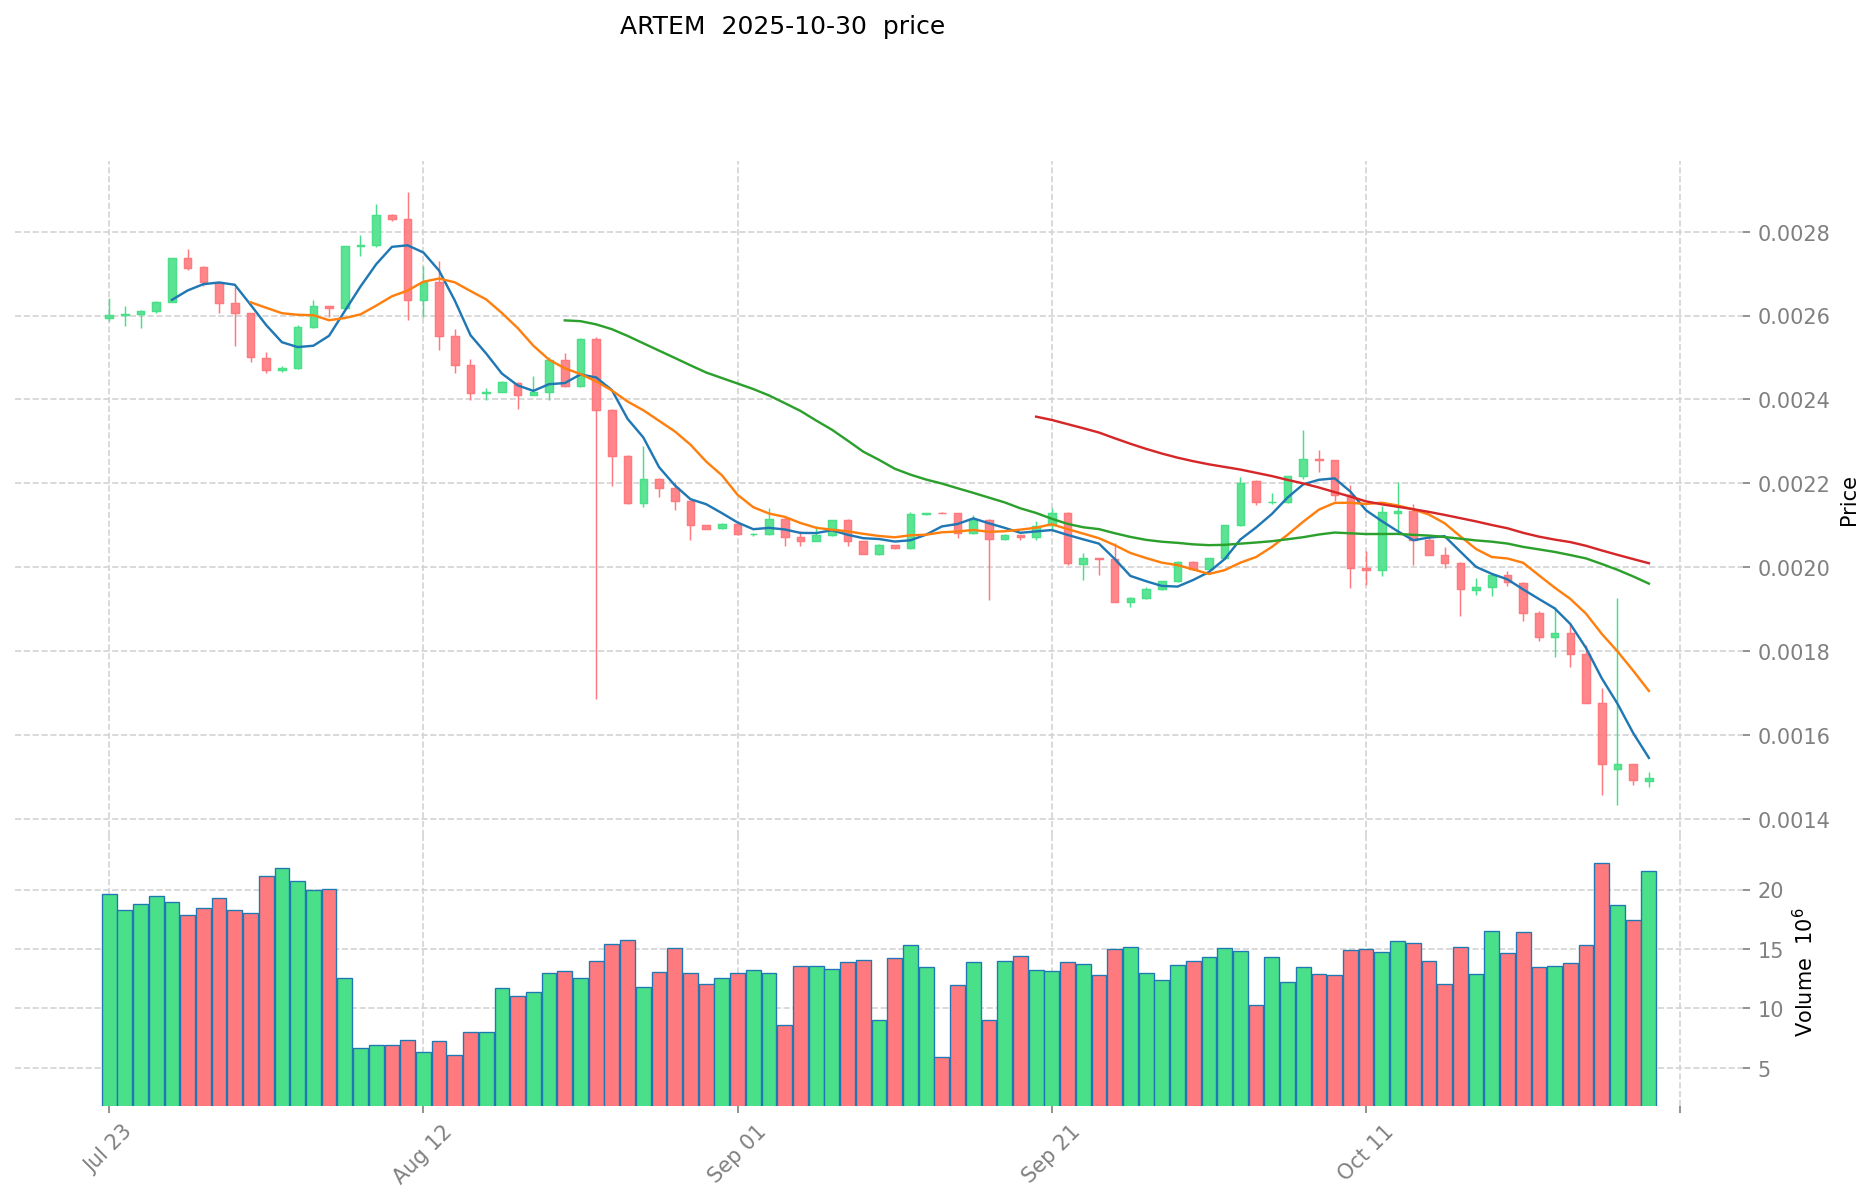
- 2025: Ongoing market fluctuations, price currently at $0.001497
ARTEM Current Market Situation
As of October 30, 2025, ARTEM is trading at $0.001497. The token has experienced a 0.33% increase in the last 24 hours, with a trading volume of $33,123.27. ARTEM's market cap stands at $597,610, ranking it at 3289 in the cryptocurrency market. The circulating supply is 399,205,100 ARTEM, which represents 39.92% of the total supply of 1 billion tokens.
Over the past week, ARTEM has seen a significant decline of 18.79%, while the 30-day performance shows a drop of 25.56%. The year-to-date performance is even more bearish, with a 58.95% decrease. Despite the recent 24-hour gain, the overall trend remains negative across longer timeframes.
The current price is considerably lower than its all-time high of $0.101077, representing a 98.52% decrease from its peak. This suggests that ARTEM is currently in a bearish market cycle, with prices struggling to recover past highs.
Click to view the current ARTEM market price
ARTEM Market Sentiment Indicator
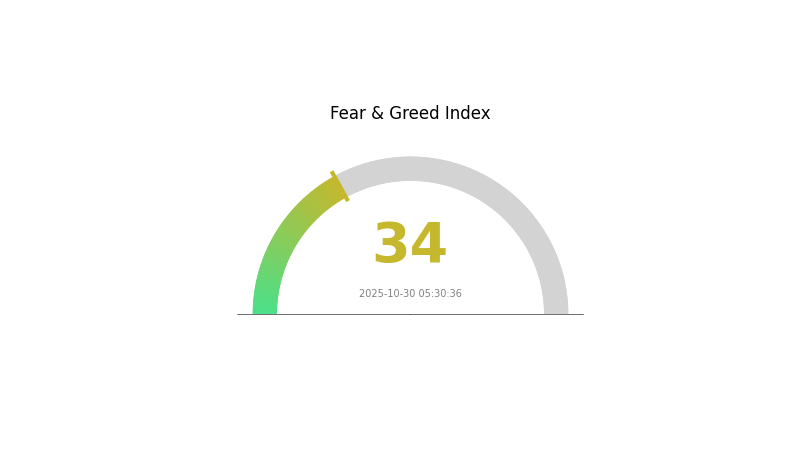
2025-10-30 Fear and Greed Index: 34 (Fear)
Click to view the current Fear & Greed Index
The crypto market sentiment remains cautious as the Fear and Greed Index hovers at 34, indicating a state of fear. This suggests investors are wary and potentially looking for buying opportunities. During such periods, it's crucial to stay informed and consider diversifying your portfolio. Gate.com offers a wide range of trading options and market analysis tools to help navigate these uncertain times. Remember, market fear can often precede significant price movements, so stay vigilant and trade responsibly.
ARTEM Holdings Distribution
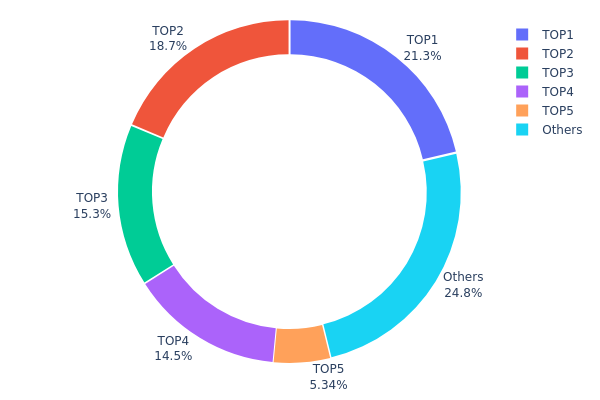
The address holdings distribution chart for ARTEM reveals a highly concentrated ownership structure. The top 5 addresses collectively hold 75.17% of the total supply, with the largest address controlling 21.34%. This level of concentration raises concerns about the token's decentralization and market stability.
Such a concentrated distribution could potentially lead to increased price volatility and susceptibility to market manipulation. The actions of these major holders could significantly impact ARTEM's price movements. Moreover, this concentration may deter smaller investors due to perceived centralization risks.
While some level of concentration is common in newer projects, ARTEM's current distribution suggests a need for improved token dispersal to enhance market resilience and align with decentralization principles. Monitoring changes in this distribution over time will be crucial for assessing the project's evolution and market health.
Click to view the current ARTEM Holdings Distribution
| Top | Address | Holding Qty | Holding (%) |
|---|---|---|---|
| 1 | 0x0d07...b492fe | 213460.31K | 21.34% |
| 2 | 0xab7b...d7a3a7 | 186713.43K | 18.67% |
| 3 | 0x02e3...e2b529 | 153233.33K | 15.32% |
| 4 | 0x5d8c...b58d9e | 145000.00K | 14.50% |
| 5 | 0xe944...7e2133 | 53428.10K | 5.34% |
| - | Others | 248164.83K | 24.83% |
II. Key Factors Influencing ARTEM's Future Price
Market Sentiment
- Investor Confidence: The sentiment and confidence of investors have a direct impact on ARTEM's price movements. When positive news about ARTEM's widespread adoption or potential emerges, it can significantly influence its price trajectory.
Macroeconomic Environment
- Geopolitical Factors: International geopolitical situations can affect ARTEM's price, as they may impact overall market stability and investor risk appetite.
Technological Development and Ecosystem Building
- Ecosystem Applications: The development of DApps and ecosystem projects built on ARTEM could drive demand and potentially influence its price.
III. ARTEM Price Prediction for 2025-2030
2025 Outlook
- Conservative forecast: $0.0012 - $0.0015
- Neutral forecast: $0.0015 - $0.00172
- Optimistic forecast: $0.00172 - $0.00193 (requires favorable market conditions)
2027-2028 Outlook
- Market phase expectation: Potential growth phase
- Price range predictions:
- 2027: $0.00156 - $0.00298
- 2028: $0.00167 - $0.0037
- Key catalysts: Increasing adoption and technological advancements
2029-2030 Long-term Outlook
- Base case scenario: $0.0031 - $0.00367 (assuming steady market growth)
- Optimistic scenario: $0.00367 - $0.00425 (with strong ecosystem development)
- Transformative scenario: $0.00425 - $0.00503 (with breakthrough applications and mass adoption)
- 2030-12-31: ARTEM $0.00503 (potential peak based on optimistic projections)
| 年份 | 预测最高价 | 预测平均价格 | 预测最低价 | 涨跌幅 |
|---|---|---|---|---|
| 2025 | 0.00193 | 0.0015 | 0.0012 | 0 |
| 2026 | 0.00233 | 0.00172 | 0.00089 | 14 |
| 2027 | 0.00298 | 0.00202 | 0.00156 | 35 |
| 2028 | 0.0037 | 0.0025 | 0.00167 | 66 |
| 2029 | 0.00425 | 0.0031 | 0.00301 | 107 |
| 2030 | 0.00503 | 0.00367 | 0.00353 | 145 |
IV. ARTEM Professional Investment Strategy and Risk Management
ARTEM Investment Methodology
(1) Long-term Holding Strategy
- Suitable for: Art enthusiasts and long-term crypto investors
- Operation suggestions:
- Accumulate ARTEM tokens during market dips
- Participate in HOFA DAO governance
- Store tokens in a secure hardware wallet
(2) Active Trading Strategy
- Technical analysis tools:
- Relative Strength Index (RSI): Identify overbought and oversold conditions
- Moving Averages: Determine trend direction and potential reversals
- Key points for swing trading:
- Monitor NFT market trends and art industry news
- Set stop-loss orders to limit potential losses
ARTEM Risk Management Framework
(1) Asset Allocation Principles
- Conservative investors: 1-3%
- Aggressive investors: 5-10%
- Professional investors: 10-15%
(2) Risk Hedging Solutions
- Diversification: Allocate investments across various art-related tokens and NFTs
- Stop-loss orders: Implement automatic sell orders to limit potential losses
(3) Secure Storage Solutions
- Hot wallet recommendation: Gate Web3 Wallet
- Cold storage solution: Use hardware wallets for long-term holdings
- Security precautions: Enable two-factor authentication and use strong passwords
V. Potential Risks and Challenges for ARTEM
ARTEM Market Risks
- Volatility: Art market fluctuations may impact token value
- Liquidity: Limited trading volume could affect price stability
- Competition: Emerging art-focused cryptocurrencies may challenge market share
ARTEM Regulatory Risks
- NFT regulations: Potential changes in NFT laws could affect ARTEM's use cases
- Securities classification: Risk of being classified as a security token
- Cross-border restrictions: International art trade regulations may impact adoption
ARTEM Technical Risks
- Smart contract vulnerabilities: Potential for exploits or bugs in the token contract
- Blockchain scalability: Ethereum network congestion could affect transaction speeds
- Integration issues: Challenges in seamlessly connecting with art platforms and marketplaces
VI. Conclusion and Action Recommendations
ARTEM Investment Value Assessment
ARTEM presents a unique opportunity in the intersection of art and cryptocurrency, offering potential long-term value for art enthusiasts and investors. However, short-term volatility and regulatory uncertainties pose significant risks.
ARTEM Investment Recommendations
✅ Beginners: Start with small positions and focus on learning about the art market and NFT ecosystem
✅ Experienced investors: Consider allocating a portion of their crypto portfolio to ARTEM as part of a diversified strategy
✅ Institutional investors: Explore partnerships with HOFA and conduct thorough due diligence before significant investments
ARTEM Trading Participation Methods
- Spot trading: Purchase ARTEM tokens on Gate.com
- DeFi staking: Participate in HOFA's DeFi pools for potential yields
- DAO involvement: Engage in HOFA DAO governance to gain insights and influence project direction
Cryptocurrency investments carry extremely high risks, and this article does not constitute investment advice. Investors should make decisions carefully based on their own risk tolerance and are advised to consult professional financial advisors. Never invest more than you can afford to lose.
FAQ
What is the share price forecast for Artemis Resources in 2025?
The share price forecast for Artemis Resources in 2025 is $0.0403 on average, with a potential high of $0.0531.
What is the price prediction for API3 in 2026?
API3 is predicted to reach around $1.7 in 2026, with a potential range between $0.814 and $1.7 based on current market trends and analysis.
What is the price prediction for ADX in 2030?
Based on current market analysis, the price of ADX is predicted to reach $0.127461 by 2030.
What crypto has the highest price prediction?
Bitcoin is often predicted to have the highest price due to its market dominance and widespread adoption. Many analysts forecast substantial long-term growth for Bitcoin's value.
Share
Content
Introduction: ARTEM's Market Position and Investment Value
I. ARTEM Price History Review and Current Market Status
II. Key Factors Influencing ARTEM's Future Price
III. ARTEM Price Prediction for 2025-2030
IV. ARTEM Professional Investment Strategy and Risk Management
V. Potential Risks and Challenges for ARTEM
VI. Conclusion and Action Recommendations
FAQ

