2025 APT Price Prediction: Bullish Trends and Key Factors Driving Aptos' Future Value
Introduction: APT's Market Position and Investment Value
Aptos (APT), as a high-performance Layer 1 blockchain project, has made significant strides since its inception in 2022. As of 2025, Aptos has achieved a market capitalization of $2.61 billion, with a circulating supply of approximately 716,859,619 tokens, and a price hovering around $3.643. This asset, often referred to as the "secure and scalable Layer 1 solution," is playing an increasingly crucial role in blockchain application development and optimization.
This article will comprehensively analyze Aptos' price trends from 2025 to 2030, combining historical patterns, market supply and demand, ecosystem development, and macroeconomic environment to provide investors with professional price predictions and practical investment strategies.
I. APT Price History Review and Current Market Status
APT Historical Price Evolution Trajectory
- 2022: Aptos launched, price fluctuated around initial trading levels
- 2023: APT reached all-time high of $19.92 on January 26th
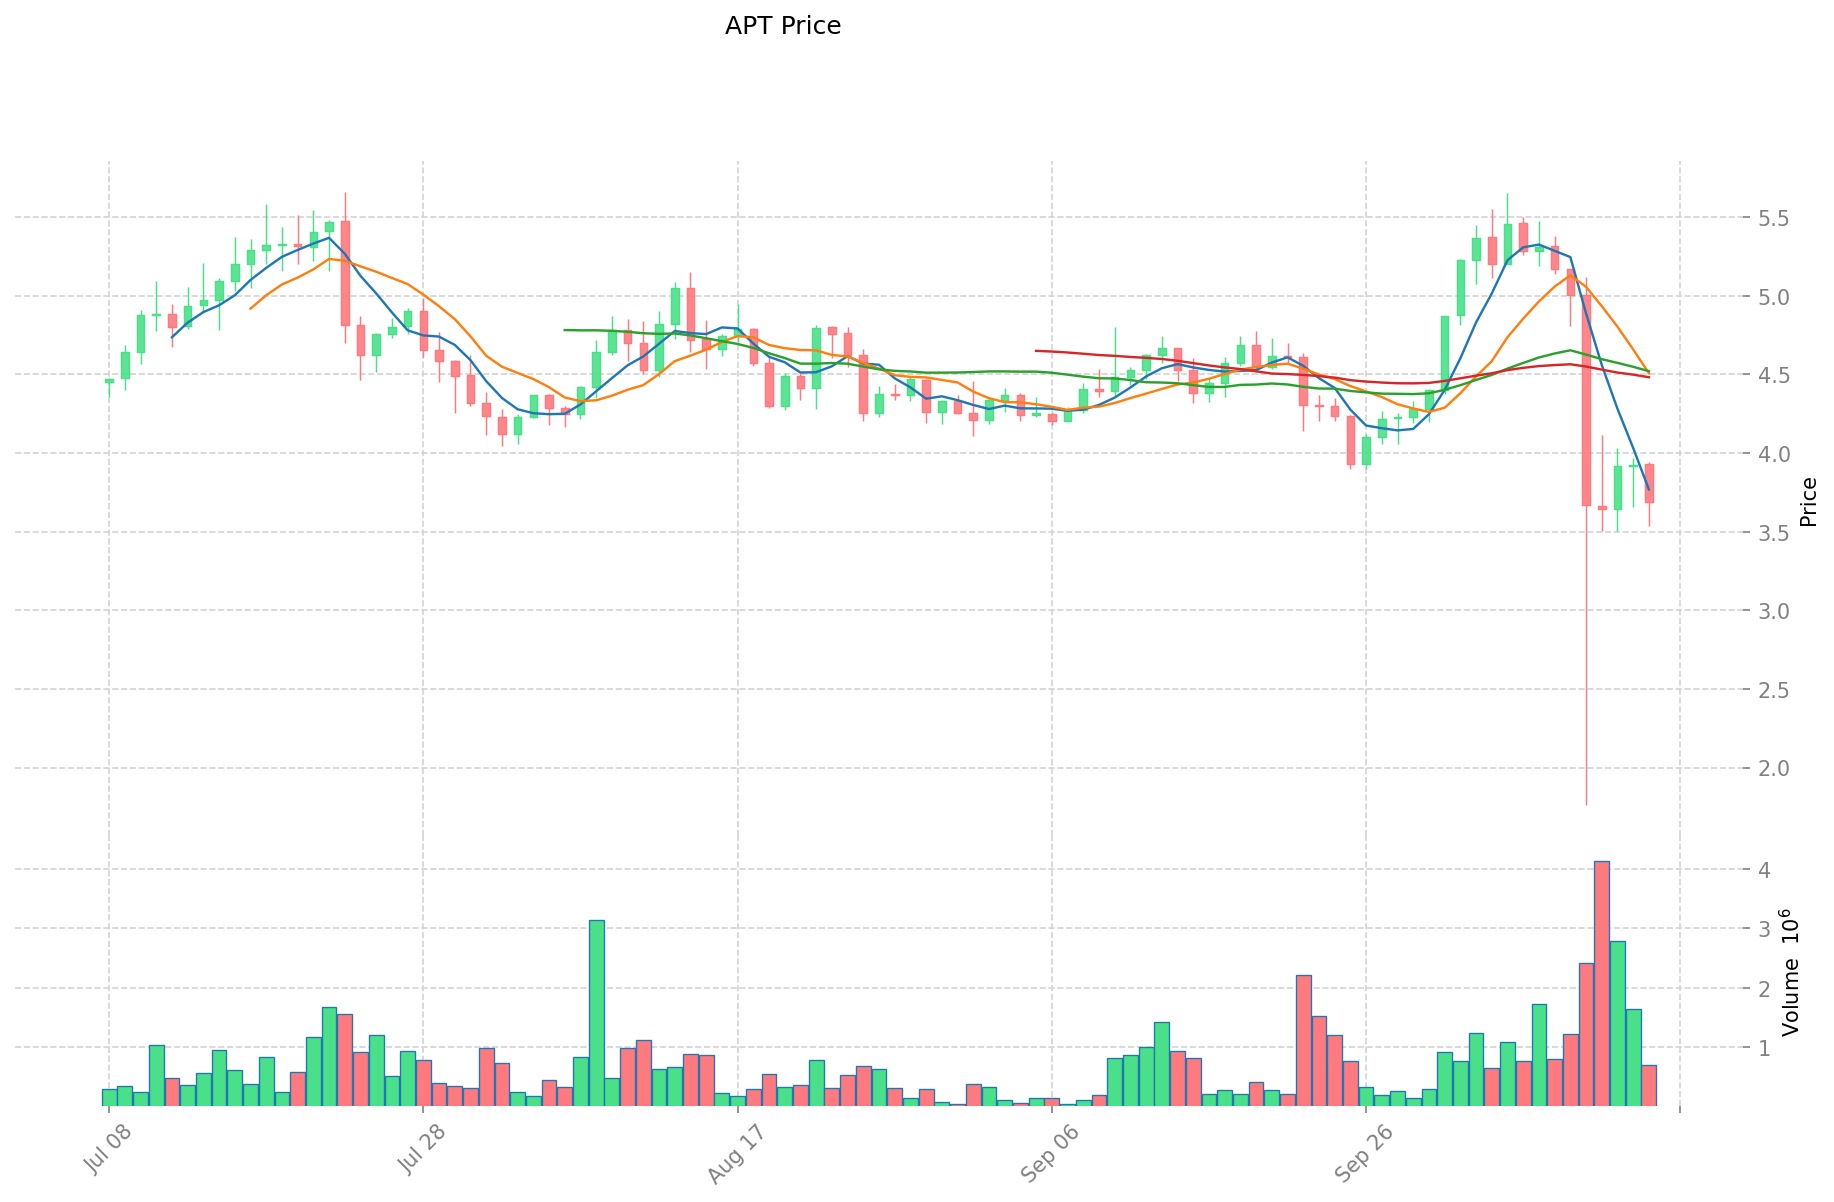
- 2025: Market downturn, price dropped to all-time low of $2.80 on October 11th
APT Current Market Situation
As of October 15, 2025, APT is trading at $3.643, ranking 52nd by market capitalization. The token has experienced significant price volatility in recent periods:
- 1 hour: -1.2%
- 24 hours: -3.82%
- 7 days: -31.78%
- 30 days: -19.50%
- 1 year: -64.19%
APT's current market cap stands at $2.61 billion, with a circulating supply of 716,859,619 APT tokens. The 24-hour trading volume is $2,610,481, indicating moderate market activity. The current price represents a 81.7% decrease from its all-time high and a 30.1% increase from its recent all-time low.
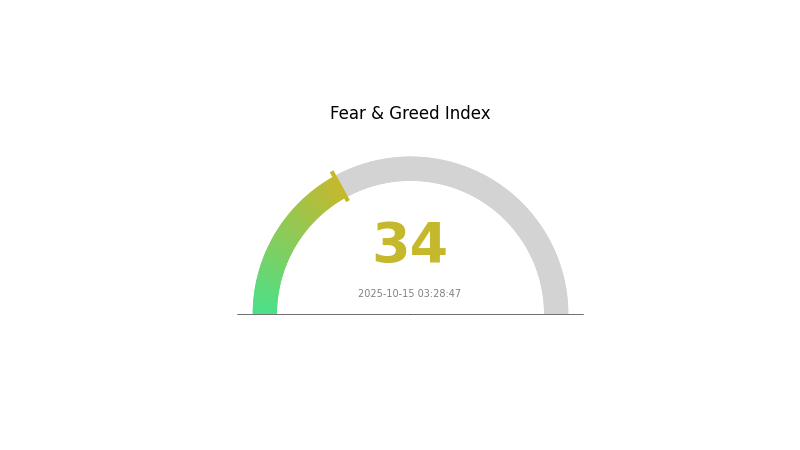
The overall crypto market sentiment is fearful, with a VIX index of 34, which may be contributing to APT's recent price decline.
Click to view the current APT market price
APT Market Sentiment Indicator
2025-10-15 Fear and Greed Index: 34 (Fear)
Click to view the current Fear & Greed Index
The crypto market is currently gripped by fear, with the sentiment index at 34. This indicates a cautious atmosphere among investors. During such periods, some traders see opportunity, adhering to the adage "be fearful when others are greedy, and greedy when others are fearful." However, it's crucial to conduct thorough research and manage risks wisely. Gate.com offers tools and resources to help navigate these market conditions effectively.
APT Holdings Distribution
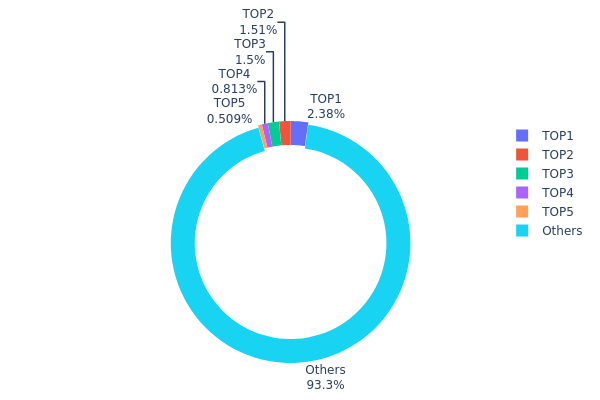
The address holdings distribution data provides crucial insights into the concentration of APT tokens across different addresses. Analysis of this data reveals a moderate level of concentration among top holders. The top 5 addresses collectively control 37.2% of the total APT supply, with the largest holder possessing 13.18%. This concentration, while notable, does not indicate excessive centralization.
The distribution pattern suggests a relatively balanced market structure. With 62.8% of tokens held by addresses outside the top 5, there is still significant dispersion among smaller holders. This distribution may contribute to market stability by reducing the impact of large-scale movements from any single address. However, the presence of several addresses holding substantial portions of the supply could potentially influence short-term price volatility if large transfers occur.
Overall, the current APT address distribution reflects a moderate level of decentralization. While there are prominent large holders, the majority of tokens are spread across numerous addresses, indicating a diverse participant base. This structure may contribute to the overall resilience of the APT ecosystem, balancing between institutional involvement and broader community participation.
Click to view the current APT Holdings Distribution
| Top | Address | Holding Qty | Holding (%) |
|---|---|---|---|
| 1 | 0xed8c...c0a60e | 28017.53K | 13.18% |
| 2 | 0xae1a...6e9c70 | 17849.02K | 8.39% |
| 3 | 0xcc03...1b207e | 17638.68K | 8.30% |
| 4 | 0x84b1...dba6e0 | 9592.81K | 4.51% |
| 5 | 0x292f...6e8ef3 | 6000.00K | 2.82% |
| - | Others | 1100570.29K | 62.8% |
II. Key Factors Influencing APT's Future Price
Supply Mechanism
- Token Unlocking: Periodic token unlocks can increase supply and potentially impact price.
- Historical Pattern: Previous token unlocks have led to short-term price volatility.
- Current Impact: Recent unlock of 65 million APT tokens may cause temporary price pressure.
Institutional and Whale Dynamics
- Institutional Holdings: Growing interest from institutional investors in APT.
- Corporate Adoption: Increasing partnerships and integrations with Aptos blockchain.
Macroeconomic Environment
- Monetary Policy Impact: Central bank policies and global economic conditions affect crypto market sentiment.
- Geopolitical Factors: International events and regulatory changes can influence APT's price.
Technological Development and Ecosystem Growth
- Block-STM Algorithm: Enhances transaction processing speed and scalability.
- Move Programming Language: Improves smart contract security and developer experience.
- Ecosystem Applications: Growing DeFi, NFT, and DApp ecosystem on Aptos platform.
III. APT Price Prediction for 2025-2030
2025 Outlook
- Conservative prediction: $2.482 - $3.65
- Neutral prediction: $3.65 - $4.50
- Optimistic prediction: $4.50 - $4.891 (requires strong market momentum and project developments)
2027-2028 Outlook
- Market stage expectation: Potential growth phase
- Price range forecast:
- 2027: $3.99 - $6.79
- 2028: $4.89 - $7.79
- Key catalysts: Increased adoption, network upgrades, and overall crypto market recovery
2030 Long-term Outlook
- Base scenario: $6.31 - $7.99 (assuming steady growth and adoption)
- Optimistic scenario: $8.00 - $11.03 (assuming widespread adoption and favorable market conditions)
- Transformative scenario: $11.03+ (extreme positive developments in technology and adoption)
- 2030-12-31: APT $11.03 (potential peak price under highly favorable conditions)
| 年份 | 预测最高价 | 预测平均价格 | 预测最低价 | 涨跌幅 |
|---|---|---|---|---|
| 2025 | 4.891 | 3.65 | 2.482 | 0 |
| 2026 | 4.91108 | 4.2705 | 3.3737 | 17 |
| 2027 | 6.79437 | 4.59079 | 3.99399 | 25 |
| 2028 | 7.79883 | 5.69258 | 4.89562 | 56 |
| 2029 | 9.24161 | 6.7457 | 5.8013 | 85 |
| 2030 | 11.03125 | 7.99366 | 6.31499 | 119 |
IV. APT Professional Investment Strategies and Risk Management
APT Investment Methodology
(1) Long-term Holding Strategy
- Suitable for: Value investors and blockchain technology enthusiasts
- Operation suggestions:
- Accumulate APT during market dips
- Set price targets for partial profit-taking
- Store APT in secure non-custodial wallets
(2) Active Trading Strategy
- Technical analysis tools:
- Moving Averages: Use to identify trend directions and potential reversals
- Relative Strength Index (RSI): Monitor overbought/oversold conditions
- Key points for swing trading:
- Identify support and resistance levels
- Use stop-loss orders to manage risk
APT Risk Management Framework
(1) Asset Allocation Principles
- Conservative investors: 1-3% of portfolio
- Aggressive investors: 5-10% of portfolio
- Professional investors: 10-15% of portfolio
(2) Risk Hedging Solutions
- Diversification: Spread investments across multiple cryptocurrencies and traditional assets
- Options strategies: Use protective puts to limit downside risk
(3) Secure Storage Solutions
- Hot wallet recommendation: Gate Web3 wallet
- Cold storage solution: Hardware wallets for long-term holdings
- Security precautions: Enable two-factor authentication, use strong passwords, and regularly update software
V. APT Potential Risks and Challenges
APT Market Risks
- High volatility: Significant price fluctuations can lead to substantial losses
- Competition: Other Layer 1 blockchains may outperform Aptos
- Market sentiment: Negative news or events can rapidly impact price
APT Regulatory Risks
- Regulatory uncertainty: Changing government policies may affect APT's adoption and use
- Compliance challenges: Increased regulatory scrutiny could impact APT's operations
- Cross-border restrictions: International regulations may limit APT's global reach
APT Technical Risks
- Smart contract vulnerabilities: Potential exploits in the Aptos ecosystem
- Scalability issues: Challenges in maintaining high performance as network usage grows
- Centralization concerns: Risks associated with validator concentration
VI. Conclusion and Action Recommendations
APT Investment Value Assessment
APT presents a high-risk, high-reward investment opportunity. Its innovative technology and strong development team offer long-term potential, but short-term volatility and competition from other Layer 1 platforms pose significant risks.
APT Investment Recommendations
✅ Beginners: Start with small positions and focus on education about blockchain technology ✅ Experienced investors: Consider APT as part of a diversified crypto portfolio, using dollar-cost averaging ✅ Institutional investors: Conduct thorough due diligence and consider APT for long-term blockchain exposure
APT Trading Participation Methods
- Spot trading: Buy and hold APT on reputable exchanges like Gate.com
- Staking: Participate in APT staking to earn passive income
- DeFi integration: Explore decentralized finance applications built on the Aptos blockchain
Cryptocurrency investments carry extremely high risk. This article does not constitute investment advice. Investors should make decisions based on their own risk tolerance and are advised to consult professional financial advisors. Never invest more than you can afford to lose.
FAQ
Will Aptos reach $100?
Aptos reaching $100 is possible but not guaranteed. Market trends and project developments will influence its future price trajectory.
Does apt coin have a future?
Yes, APT coin shows promise. Experts predict an average price of $124.38 by 2033, up from $9.09 now. Its future depends on market trends and wider adoption in the crypto ecosystem.
What is the apt price prediction for 2025?
Based on market trends and expert analysis, the APT price is predicted to reach around $15 by 2025. This forecast considers current market conditions and historical data.
What is Aptos' potential long-term value?
Aptos (APT) has significant long-term potential, with experts projecting an average price of $124.38 by 2033. This represents a substantial increase from its current price of $9.09, indicating strong growth prospects for the cryptocurrency.
Share
Content