2025 APP Fiyat Tahmini: Mobil Yazılım Maliyetlerinin Geleceğinde Yol Haritası Çizmek


Giriş: APP'nin Piyasa Konumu ve Yatırım Değeri
RWAX (APP), Injective ekosistemine odaklanan bir launchpad süper uygulaması olarak, kuruluşundan itibaren gelişmiş zincir üstü alım-satım botlarını entegre etmiştir. 2025 yılı itibarıyla RWAX'in piyasa değeri 3.133.821 dolar seviyesine yükselmiş, dolaşımdaki arzı yaklaşık 1.985.944.981 token olarak kaydedilmiş ve fiyatı yaklaşık 0,001578 dolar civarında sabitlenmiştir. Yenilikçi alım-satım özellikleriyle bilinen bu varlık, merkeziyetsiz finans ve zincir üstü ticaret alanında giderek daha önemli bir rol üstlenmektedir.
Bu makalede, 2025-2030 döneminde RWAX'in fiyat eğilimleri; geçmiş veriler, piyasa arz-talep dengesi, ekosistem gelişimi ve makroekonomik etmenler ışığında bütüncül olarak analiz edilerek, yatırımcılara profesyonel fiyat tahminleri ve pratik yatırım stratejileri sunulacaktır.
I. APP Fiyat Geçmişi ve Mevcut Piyasa Durumu
APP Tarihsel Fiyat Gelişimi
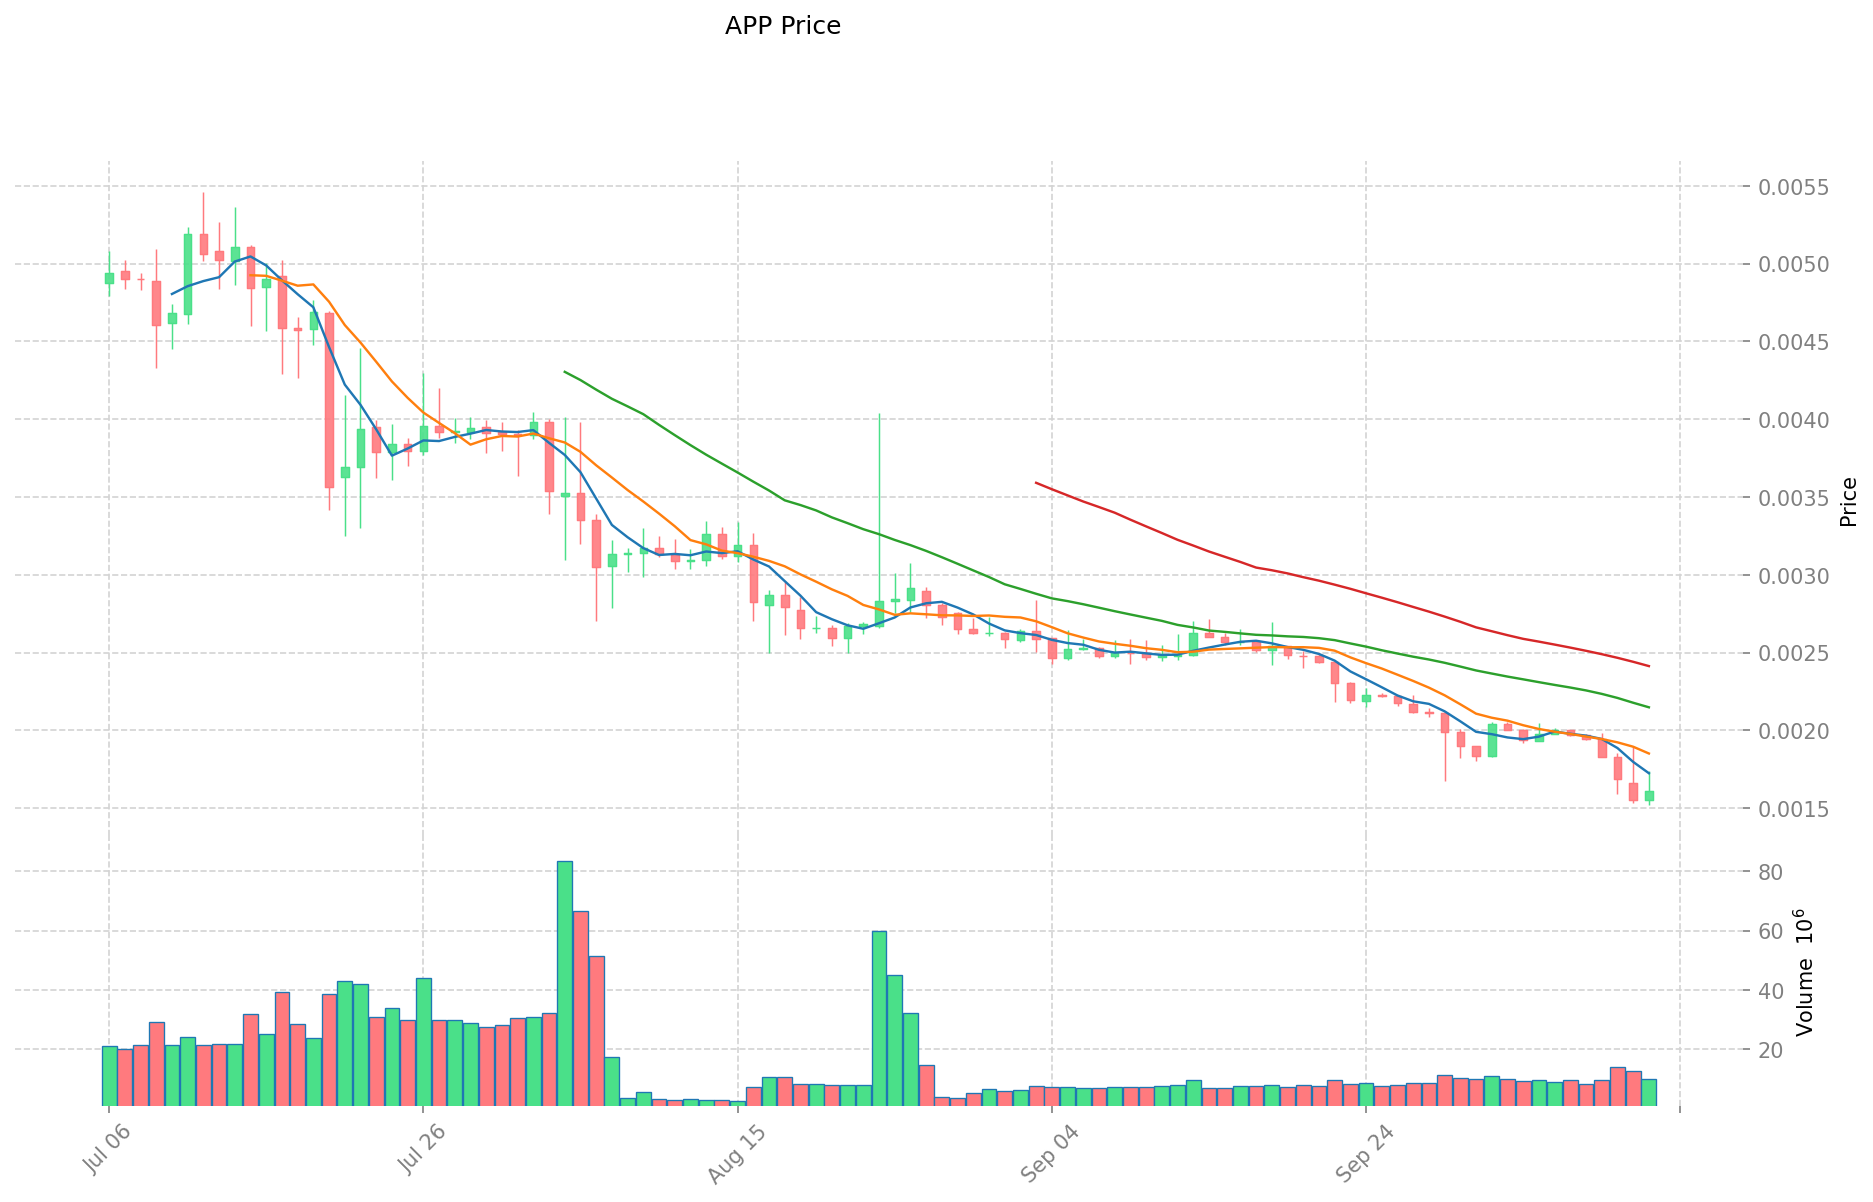
- 2024: İlk lansman, fiyat en yüksek 0,051 dolara ulaştı
- 2025: Piyasa düzeltmesi, fiyat tüm zamanların en düşük seviyesi olan 0,001518 dolara geriledi
APP Mevcut Piyasa Durumu
13 Ekim 2025 tarihi itibarıyla APP, 0,001578 dolar seviyesinden işlem görmektedir ve 24 saatlik işlem hacmi 16.000,77 dolar olarak gerçekleşmiştir. Token, son 24 saatte %1,21 oranında yükselmiş olsa da; bir haftada %20,82, son bir ayda ise %36,89 oranında düşüş göstermiştir. Mevcut fiyat, 16 Ocak 2024 tarihinde kaydedilen 0,051 dolarlık tüm zamanların en yüksek seviyesinin %96,91 altındadır. APP'nin piyasa değeri 3.133.821 dolar olup, kripto para piyasasında 2.055. sırada yer almaktadır. Dolaşımdaki arz 1.985.944.981,93 APP token olup, bu miktar toplam 3.000.000.000 APP arzının %66,2'sine karşılık gelmektedir.
Güncel APP piyasa fiyatını görmek için tıklayın
APP Piyasa Duyarlılığı Göstergesi
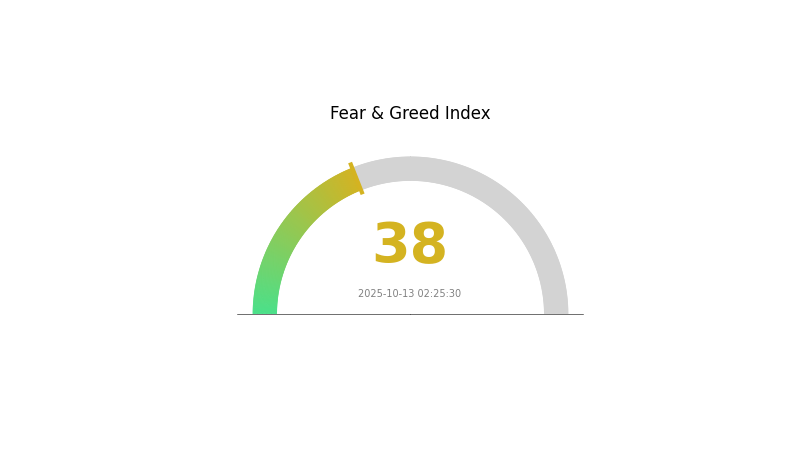
13.10.2025 Korku ve Açgözlülük Endeksi: 38 (Korku)
Güncel Korku & Açgözlülük Endeksini görmek için tıklayın
Kripto para piyasasında şu anda korku hâkim; Korku ve Açgözlülük Endeksi 38 seviyesinde. Bu durum, yatırımcıların temkinli davrandığını ve “diğerleri korkarken açgözlü ol” yaklaşımını benimseyenler için alım fırsatı doğurabileceğini gösteriyor. Ancak, yatırım kararı almadan önce detaylı araştırma yapmak ve temkinli davranmak önemlidir. Piyasadaki korku; düzenleyici endişeler, makroekonomik belirsizlikler veya son fiyat dalgalanmalarından kaynaklanabilir. Gelişmeleri takip edin ve piyasa trendlerine dikkatlice göz atın.
APP Varlık Dağılımı
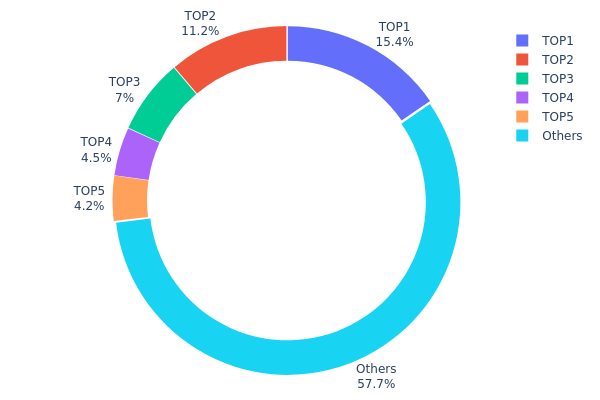
Adres varlık dağılımı verileri, APP tokenlerinin çeşitli cüzdanlara dağılımındaki yoğunluk hakkında önemli bilgiler sunar. Analizler, en büyük sahipler arasında yüksek bir yoğunlaşma olduğunu göstermektedir. İlk 5 adres, toplam APP arzının %42,29'unu elinde bulundururken, en büyük holder %15,39 paya sahiptir.
Bu derece yoğunlaşma, potansiyel piyasa manipülasyonu ve fiyat oynaklığına ilişkin endişeleri artırmaktadır. Arzın %15'inden fazlasını elinde tutan en büyük holder, satış ya da ek alım yaparsa piyasayı önemli ölçüde etkileyebilir. Ayrıca, ilk 5 adresin toplam arzın %40'ını aşan bir kısmını elinde bulundurması, kripto projelerinde sıkça vurgulanan merkeziyetsizlik ilkeleriyle çelişen merkezi bir dağılıma işaret edebilir.
Bununla birlikte, tokenlerin %57,71'inin “Diğerleri” arasında dağılması, küçük yatırımcılar arasında kayda değer bir dağılım olduğunu gösterir. Bu yapı, hem merkezi hem de merkeziyetsiz özelliklerin bir arada bulunduğu karma bir piyasa yapısını yansıtır. Büyük sahiplerin yoğunluğu risk oluştururken, küçük adreslerin geniş payı genel piyasa istikrarı ve tek taraflı manipülasyona karşı direnç sağlayabilir.
Güncel APP Varlık Dağılımını görmek için tıklayın
| En Yüksek | Adres | Varlık Miktarı | Varlık (%) |
|---|---|---|---|
| 1 | 0xc882...84f071 | 461.838,58K | 15,39% |
| 2 | 0x5ddd...cc6cfb | 336.000,00K | 11,20% |
| 3 | 0xe190...170182 | 210.000,00K | 7,00% |
| 4 | 0xe459...c5d02f | 135.000,03K | 4,50% |
| 5 | 0x183c...62f59a | 126.000,00K | 4,20% |
| - | Diğerleri | 1.731.161,39K | 57,71% |
II. APP'nin Gelecekteki Fiyatını Etkileyecek Temel Faktörler
Arz Mekanizması
- Halving: Yeni coin arzının genellikle her dört yılda bir periyodik olarak azaltılması
- Tarihsel örüntüler: Önceki halving dönemleri, genellikle takip eden aylarda fiyat artışı getirmiştir
- Mevcut etki: Sonraki halving’in enflasyonu azaltıp fiyat artışını tetiklemesi bekleniyor
Kurumsal ve Whale Hareketleri
- Kurumsal varlıklar: Büyük kurumlar kripto paralardaki yatırımlarını artırmaya devam ediyor
- Şirket adaptasyonu: Tesla ve MicroStrategy gibi şirketler bilançolarına kripto ekledi
- Devlet politikaları: Bazı ülkelerde düzenleyici netlik, kurumsal katılımı teşvik etti
Makroekonomik Ortam
- Para politikası etkisi: Merkez bankalarının gevşek para politikası, yatırımcıları kriptoya yönlendirebilir
- Enflasyona karşı koruma: Kripto paralar, enflasyon dönemlerinde değer saklama aracı olarak görülüyor
- Jeopolitik faktörler: Küresel ekonomik belirsizlikler merkeziyetsiz varlıklara talebi artırabilir
Teknik Gelişim ve Ekosistem Büyümesi
- Ölçeklenebilirlik çözümleri: Layer-2 teknolojileriyle işlem hızı ve düşük ücretler sağlanıyor
- DeFi entegrasyonu: Blockchainlerde DeFi uygulamaları yaygınlaşıyor
- Ekosistem uygulamaları: Büyük blockchain platformlarında DApp ve proje sayısı artıyor
III. 2025-2030 Dönemi APP Fiyat Tahmini
2025 Görünümü
- İhtiyatlı tahmin: 0,00082 - 0,00157 dolar
- Neutral tahmin: 0,00157 - 0,00180 dolar
- İyimser tahmin: 0,00180 - 0,00203 dolar (olumlu piyasa ve artan benimseme halinde)
2027-2028 Görünümü
- Piyasa fazı: Yüksek volatiliteyle potansiyel büyüme dönemi
- Fiyat aralığı tahmini:
- 2027: 0,00173 - 0,00312 dolar
- 2028: 0,00176 - 0,00286 dolar
- Kilit katalizörler: Teknolojik gelişmeler, piyasa kabulü ve düzenleyici netlik
2030 Uzun Vadeli Görünüm
- Temel senaryo: 0,00294 - 0,00350 dolar (istikrarlı piyasa büyümesi ve benimseme ile)
- İyimser senaryo: 0,00350 - 0,00411 dolar (güçlü piyasa ve artan kullanım ile)
- Dönüştürücü senaryo: 0,00411 - 0,00450 dolar (çığır açan gelişmeler, kitlesel benimseme ile)
- 31 Aralık 2030: APP 0,00294 dolar (ortalama tahmini fiyat)
| Yıl | Tahmini En Yüksek Fiyat | Tahmini Ortalama Fiyat | Tahmini En Düşük Fiyat | Değişim (%) |
|---|---|---|---|---|
| 2025 | 0,00203 | 0,00157 | 0,00082 | 0 |
| 2026 | 0,00247 | 0,0018 | 0,00123 | 14 |
| 2027 | 0,00312 | 0,00214 | 0,00173 | 35 |
| 2028 | 0,00286 | 0,00263 | 0,00176 | 66 |
| 2029 | 0,00313 | 0,00275 | 0,00167 | 73 |
| 2030 | 0,00411 | 0,00294 | 0,00176 | 86 |
IV. APP İçin Profesyonel Yatırım Stratejileri ve Risk Yönetimi
APP Yatırım Metodolojisi
(1) Uzun Vadeli Tutma Stratejisi
- Hedef yatırımcı: Yüksek risk toleransına sahip uzun vadeli yatırımcılar
- Operasyon önerileri:
- Piyasa düşüşlerinde APP token biriktirin
- Fiyat hedefleri belirleyip sadık kalın
- Daha fazla güvenlik için tokenleri Gate Web3 cüzdanında tutun
(2) Aktif Alım-Satım Stratejisi
- Teknik analiz araçları:
- Hareketli Ortalamalar: Trend ve yön değişimlerini tespit edin
- RSI: Aşırı alım veya aşırı satım koşullarını belirleyin
- Dalgalı işlem için başlıca noktalar:
- Fiyat hareketini onaylamak için işlem hacmini izleyin
- Kayıpları sınırlamak için zarar-durdur emirleri kullanın
APP Risk Yönetimi Çerçevesi
(1) Varlık Dağılımı İlkeleri
- Temkinli yatırımcılar: Kripto portföyünün %1-3'ü
- Agresif yatırımcılar: %5-10
- Profesyonel yatırımcılar: Maksimum %15
(2) Riskten Korunma Yöntemleri
- Diversifikasyon: Yatırımları farklı kripto paralara yayarak riski azaltın
- Zarar-durdur emirleri: Olası kayıpları sınırlayın
(3) Güvenli Saklama Yöntemleri
- Sıcak cüzdan önerisi: Gate Web3 cüzdanı
- Soğuk depolama: Uzun vadede donanım cüzdanı kullanın
- Güvenlik: İki faktörlü kimlik doğrulama ve güçlü şifreler uygulayın
V. APP İçin Potansiyel Riskler ve Zorluklar
APP Piyasa Riskleri
- Yüksek volatilite: APP fiyatında ciddi dalgalanmalar görülebilir
- Sınırlı likidite: Düşük işlem hacmi giriş ve çıkışları zorlaştırabilir
- Rekabet: Benzer özellikler sunan projeler APP'nin pazar payını azaltabilir
APP Regülasyon Riskleri
- Düzenleyici belirsizlik: Yeni regülasyonlar APP'nin faaliyetlerini etkileyebilir
- Sınır ötesi kısıtlamalar: Uluslararası düzenlemeler APP'nin küresel büyümesini sınırlayabilir
- Uyum maliyetleri: Yeni yasalara uyum için masraflar artabilir
APP Teknik Riskler
- Akıllı sözleşme açıkları: Temel kodda olası açıklar
- Ölçeklenebilirlik sorunları: Kullanıcı talebindeki artışta APP zorlanabilir
- Entegrasyon sorunları: Injective protokolündeki problemler APP'nin işleyişini etkileyebilir
VI. Sonuç ve Eylem Önerileri
APP Yatırım Değeri Değerlendirmesi
APP, yenilikçi zincir üstü işlem özellikleri sunar; ancak ciddi piyasa ve teknik risklerle karşı karşıyadır. Proje zorlukları aşar ve yaygın benimseme sağlarsa uzun vadeli potansiyele sahip olabilir.
APP Yatırım Tavsiyeleri
✅ Yeni başlayanlar: Detaylı araştırmadan sonra küçük ve deneysel pozisyonlar alınabilir
✅ Deneyimli yatırımcılar: Sıkı risk yönetimiyle ortalama maliyet stratejisi uygulanabilir
✅ Kurumsal yatırımcılar: Derinlemesine analiz yapıp çeşitlendirilmiş kripto portföyünde değerlendirin
APP Alım-Satım Katılım Yöntemleri
- Spot alım-satım: Gate.com üzerinden doğrudan APP token alınabilir
- Limit emirler: Belirli fiyatlardan alım-satım emirleri verilebilir
- DCA stratejisi: Fiyat dalgalanmasını azaltmak için düzenli küçük alımlar yapılabilir
Kripto para yatırımları son derece yüksek risk taşır; bu makale yatırım tavsiyesi niteliği taşımaz. Yatırımcılar, kendi risk toleranslarına göre dikkatli karar vermeli ve profesyonel finans danışmanlarına danışmalıdır. Kaybetmeyi göze alabileceğinizden fazlasını asla yatırmayın.
SSS
APPS alınması için iyi bir hisse mi?
Evet, APPS alınması için iyi bir hisse olarak görülmektedir. Güncel analizler Güçlü Al sinyali vermekte ve fiyatı 6,25 dolar düzeyindedir. Son piyasa hareketleri bu tavsiyeyi desteklemektedir.
2025 yılı için APLD hissesi fiyat hedefi nedir?
APLD hissesi için 2025 fiyat hedefi analist tahminlerine göre 20 dolardır. Bu, mevcut fiyata kıyasla değişiklik olmadığı anlamına gelir.
AppLovin hâlâ alınır mı?
Evet, AppLovin hâlâ alınabilir olarak değerlendiriliyor. Hisse fiyatı son dönemde %4,52 artarak 649,59 dolara ulaştı. Hem kısa hem uzun vadeli hareketli ortalamalardan gelen al sinyalleri olumlu bir görünüm sunuyor.
2030'da AppLovin hissesi ne olur?
Piyasa analizine göre, AppLovin hissesinin 2030 yılında ortalama fiyatı 111,39 dolar olacak; tahminler 66,00 ile 156,79 dolar arasında değişiyor.
Share
Content
Giriş: APP'nin Piyasa Konumu ve Yatırım Değeri
I. APP Fiyat Geçmişi ve Mevcut Piyasa Durumu
II. APP'nin Gelecekteki Fiyatını Etkileyecek Temel Faktörler
III. 2025-2030 Dönemi APP Fiyat Tahmini
IV. APP İçin Profesyonel Yatırım Stratejileri ve Risk Yönetimi
V. APP İçin Potansiyel Riskler ve Zorluklar
VI. Sonuç ve Eylem Önerileri
SSS
How to Buy Cryptocurrency


Trending Cryptocurrencies


BANANA nedir: Dünya genelindeki beslenme alışkanlıklarını dönüştüren besleyici güç merkezi

2025 NUTS Fiyat Tahmini: Küresel Arz Sıkıntıları ve Piyasa Dalgalanmaları Belirsizliği Artırıyor

2025 BANANA Fiyat Tahmini: Dijital varlıklara olan talebin artmasıyla birlikte değerinde olası yükseliş
BANANA nedir: Sadece atıştırmalık değil, çok yönlü bir tropikal meyve

EDGE nedir: Mobil internet teknolojisinin yeni nesli
Blokzincirin Temel Bileşenleri ve İşlevleri: Node’ların Anlaşılması
Merkeziyetsiz Kripto Ticareti İçin En İyi Platformlar

NFT’lerin Güvenli Saklanması İçin En İyi Donanım Çözümleri

Zincirler Arası Çözümler Hakkında Bilgi: Blockchain İnteroperabilitesi Rehberi
İdeal ENS alan adınızı zahmetsizce bulun ve hemen rezerve edin