2025 ANDR Price Prediction: Bullish Outlook as DeFi Adoption Surges
Introduction: ANDR's Market Position and Investment Value
Andromeda (ANDR), as the first true 100% on-chain, IBC-enabled, decentralized web3 Operating System, has made significant strides since its inception. As of 2025, ANDR's market capitalization stands at $230,627.93, with a circulating supply of approximately 229,938,116 tokens, and a price hovering around $0.001003. This asset, often referred to as the "Web3 OS Pioneer," is playing an increasingly crucial role in decentralized application building and enterprise-grade web3 solutions.
This article will provide a comprehensive analysis of ANDR's price trends from 2025 to 2030, combining historical patterns, market supply and demand, ecosystem development, and macroeconomic factors to offer professional price predictions and practical investment strategies for investors.
I. ANDR Price History Review and Current Market Status
ANDR Historical Price Evolution
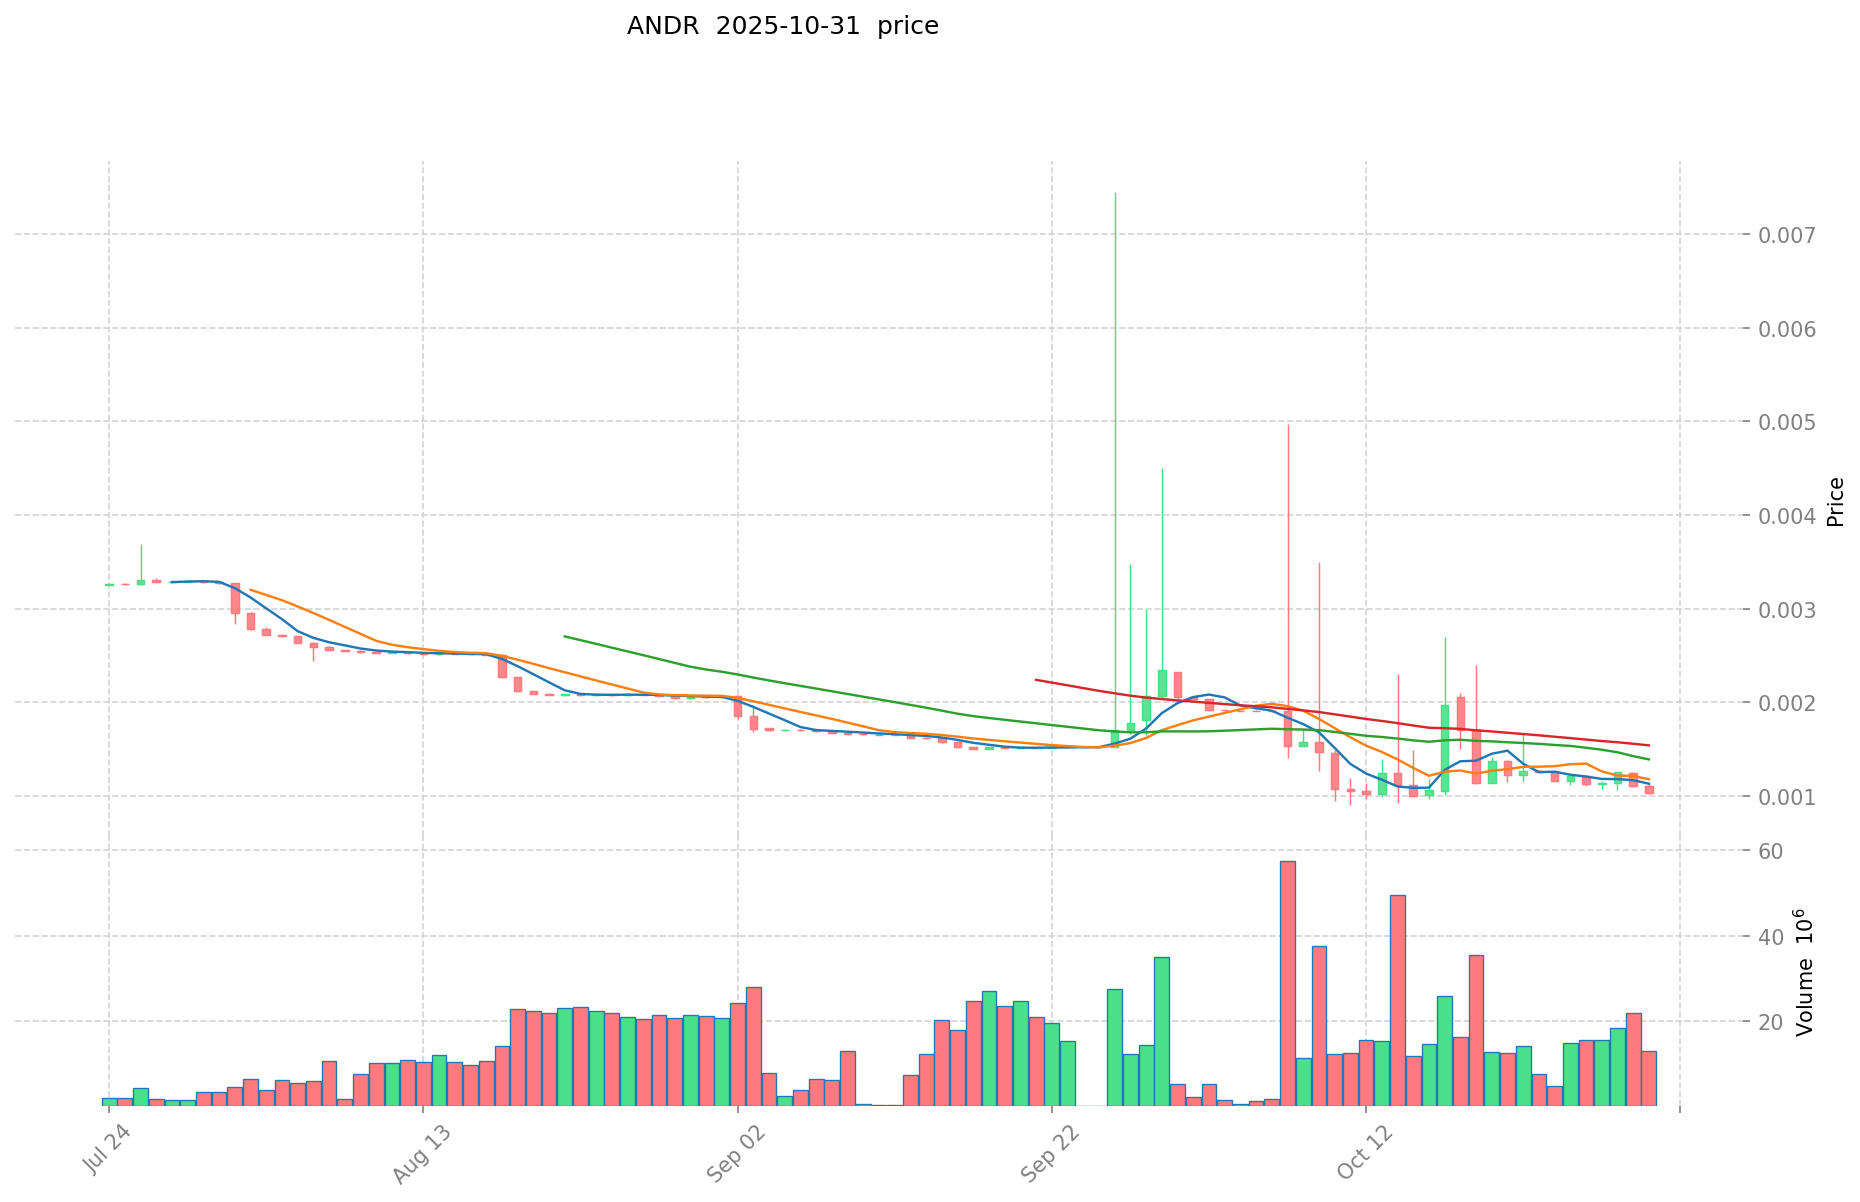
- 2024: Initial launch, price reached an all-time high of $0.5869 on May 6th
- 2025: Significant market downturn, price dropped to an all-time low of $0.0009 on October 31st
ANDR Current Market Situation
As of November 1, 2025, ANDR is trading at $0.001003, experiencing a 6.72% decrease in the last 24 hours. The token's market capitalization stands at $230,627.93, with a circulating supply of 229,938,116.83 ANDR. The current price represents a substantial 99.83% decline from its all-time high, indicating a prolonged bearish trend.
The trading volume in the past 24 hours is $10,894.36, which is relatively low compared to its market cap. This suggests limited liquidity and trading activity. The token's fully diluted valuation is $1,003,000, with a circulating supply ratio of 22.99% to the total supply of 1 billion ANDR tokens.
ANDR has shown significant volatility, with price changes of -15.27% over the past week and -51.53% over the last month. The year-to-date performance is particularly concerning, with a 96.67% decrease, reflecting a severe market correction or loss of investor confidence.
Click to view the current ANDR market price
ANDR Market Sentiment Indicator
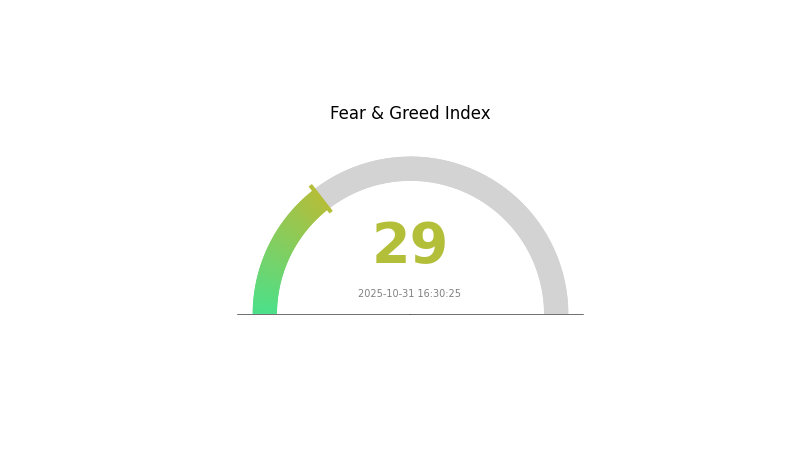
2025-10-31 Fear and Greed Index: 29 (Fear)
Click to view the current Fear & Greed Index
The crypto market sentiment remains cautious as the Fear and Greed Index hovers at 29, indicating a state of fear. This suggests investors are exercising caution and may be hesitant to make bold moves. During such periods, some traders view it as a potential buying opportunity, adhering to the contrarian investment strategy. However, it's crucial to conduct thorough research and risk assessment before making any investment decisions in the volatile crypto market.
ANDR Holding Distribution
The address holding distribution data for ANDR reveals an intriguing pattern in token ownership. This analysis provides insights into the concentration of ANDR tokens among different addresses, which is crucial for understanding the token's market structure and potential price dynamics.
Based on the available data, it appears that the ANDR token distribution is relatively decentralized, with no single address holding a significant portion of the total supply. This suggests a healthy distribution of tokens among various holders, which can contribute to market stability and reduce the risk of price manipulation by large individual holders.
The absence of highly concentrated holdings is a positive indicator for ANDR's market structure. It implies that the token's price movements are less likely to be influenced by the actions of a few large holders, potentially leading to more organic price discovery and reduced volatility. This distribution pattern also aligns with the principles of decentralization, which is often valued in the cryptocurrency ecosystem.
Click to view the current ANDR holding distribution

| Top | Address | Holding Qty | Holding (%) |
|---|
II. Key Factors Influencing Future ANDR Price
Macroeconomic Environment
-
Impact of Monetary Policy: The Federal Reserve is expected to continue its rate-cutting cycle, with potentially 3 more cuts (2 this year, 1 next year). This easing monetary environment is likely to support risk assets like ANDR.
-
Inflation Hedging Properties: As inflation concerns persist, ANDR may be viewed as a potential hedge, especially if it demonstrates stability compared to traditional assets.
-
Geopolitical Factors: Ongoing trade tensions and geopolitical uncertainties continue to influence global markets and may impact ANDR's perceived value as a potential safe haven.
Technical Development and Ecosystem Building
-
AI Integration: ANDR's ecosystem is likely developing AI-related applications, following the global trend. This could enhance its utility and attract more users and investors.
-
Ecosystem Applications: While specific details are not provided, the continued development of DApps and ecosystem projects on ANDR's network would be crucial for its growth and adoption.
III. ANDR Price Prediction for 2025-2030
2025 Outlook
- Conservative prediction: $0.0007 - $0.0009
- Neutral prediction: $0.0009 - $0.0011
- Optimistic prediction: $0.0011 - $0.00121 (requires positive market sentiment and project developments)
2027-2028 Outlook
- Market stage expectation: Potential growth phase with increasing adoption
- Price range forecast:
- 2027: $0.00121 - $0.00154
- 2028: $0.00122 - $0.00174
- Key catalysts: Technological advancements, broader market trends, and potential partnerships
2029-2030 Long-term Outlook
- Base scenario: $0.00158 - $0.00164 (assuming steady market growth and continued project development)
- Optimistic scenario: $0.00170 - $0.00218 (with significant ecosystem expansion and mainstream adoption)
- Transformative scenario: $0.00220+ (under extremely favorable market conditions and breakthrough innovations)
- 2030-12-31: ANDR $0.00218 (potential peak price for the period)
| 年份 | 预测最高价 | 预测平均价格 | 预测最低价 | 涨跌幅 |
|---|---|---|---|---|
| 2025 | 0.00121 | 0.001 | 0.0007 | 0 |
| 2026 | 0.00147 | 0.0011 | 0.00077 | 10 |
| 2027 | 0.00154 | 0.00129 | 0.00121 | 28 |
| 2028 | 0.00174 | 0.00141 | 0.00122 | 41 |
| 2029 | 0.0017 | 0.00158 | 0.00104 | 57 |
| 2030 | 0.00218 | 0.00164 | 0.00105 | 63 |
IV. Professional Investment Strategies and Risk Management for ANDR
ANDR Investment Methodology
(1) Long-term Holding Strategy
- Suitable for: Risk-tolerant investors with a long-term outlook
- Operation suggestions:
- Accumulate ANDR during market dips
- Set price targets for partial profit-taking
- Store tokens in secure, non-custodial wallets
(2) Active Trading Strategy
- Technical analysis tools:
- Moving Averages: Monitor short-term and long-term trends
- RSI (Relative Strength Index): Identify overbought/oversold conditions
- Key points for swing trading:
- Set stop-loss orders to limit potential losses
- Use limit orders to capture volatility
ANDR Risk Management Framework
(1) Asset Allocation Principles
- Conservative investors: 1-3%
- Aggressive investors: 5-10%
- Professional investors: 10-15%
(2) Risk Hedging Solutions
- Diversification: Spread investments across multiple cryptocurrencies and traditional assets
- Stop-loss orders: Implement automatic sell orders to limit potential losses
(3) Secure Storage Solutions
- Hot wallet recommendation: Gate Web3 Wallet
- Cold storage solution: Hardware wallet for long-term holdings
- Security precautions: Enable two-factor authentication, use strong passwords, and regularly update software
V. Potential Risks and Challenges for ANDR
ANDR Market Risks
- High volatility: Extreme price fluctuations can lead to significant losses
- Low liquidity: Limited trading volume may cause slippage and difficulty in executing large orders
- Market sentiment: Susceptible to rapid shifts in investor sentiment and speculative behavior
ANDR Regulatory Risks
- Regulatory uncertainty: Changing cryptocurrency regulations may impact ANDR's adoption and value
- Compliance challenges: Potential difficulties in meeting evolving regulatory requirements
- Cross-border restrictions: Varying regulations across jurisdictions may limit ANDR's global accessibility
ANDR Technical Risks
- Smart contract vulnerabilities: Potential bugs or exploits in the underlying code
- Scalability issues: Challenges in handling increased transaction volume as the network grows
- Interoperability concerns: Potential difficulties in integrating with other blockchain networks or protocols
VI. Conclusion and Action Recommendations
ANDR Investment Value Assessment
ANDR presents a high-risk, high-potential investment opportunity. Its innovative approach to creating a decentralized web3 Operating System offers long-term value potential, but investors should be aware of the significant short-term volatility and regulatory uncertainties in the cryptocurrency market.
ANDR Investment Recommendations
✅ Beginners: Consider small, exploratory investments to gain exposure while learning about the project ✅ Experienced investors: Implement a dollar-cost averaging strategy and set clear profit-taking targets ✅ Institutional investors: Conduct thorough due diligence and consider ANDR as part of a diversified crypto portfolio
ANDR Trading Participation Methods
- Spot trading: Buy and sell ANDR tokens directly on Gate.com
- Staking: Participate in staking programs if available to earn passive income
- DeFi integration: Explore decentralized finance opportunities using ANDR tokens, if supported by the protocol
Cryptocurrency investments carry extremely high risks, and this article does not constitute investment advice. Investors should make decisions carefully based on their own risk tolerance and are advised to consult professional financial advisors. Never invest more than you can afford to lose.
FAQ
Will ACH reach $1?
Based on current trends, ACH is unlikely to reach $1 in the near future. Forecasts suggest it will stay below $0.035, with long-term prospects remaining uncertain.
What is the stock price prediction for AMD in 2030?
AMD's stock price is predicted to be between $171.91 and $586.37 in 2030, based on current market analysis and trends.
Will render reach $50?
Render Token has a low to moderate chance of reaching $50. Current projections suggest this target may be challenging to achieve in the near future.
What is the future of the Ardor coin?
Ardor is projected to grow, reaching $0.1141 by late 2025. The market outlook is bearish, but technical analysis suggests potential for value increase.
Share
Content

