Before00zero
vip
Age0.3Year
Peak Tier0
Analyze, delve into, and dive into the world of cryptocurrencies and pave the way for navigating the blockchain.
#White House Crypto Report#
Data spotlight: Institutional demand backs Ethereum's stability
Risk appetite for Ethereum investment products has remained steady in July, backed by increased demand from both institutional and retail investors. Capital inflow into Ethereum-related financial products flipped Bitcoin last week, averaging $1.59 billion. In contrast, Bitcoin investment products recorded a net outflow volume of $175 million last week, according to a CoinShares report.
Meanwhile, US ETH spot ETFs attracted a net inflow of around $219 million on Tuesday, continuing the unbroken bullish s
HOUSE2.81%
ETH-5.55%
BTC-2.81%
NET-13.07%
post-image
  • Reward
  • Comment
  • Share
Altcoin updates: XRP
For XRP, it seems that sellers are regaining control, supported by a sell signal from the MACD indicator and a drop in the relative strength index at 56 after peaking at around 88 during the period leading up to the all-time high of $3.66, which was reached on July 18.
If the trend of the Relative Strength Index (RSI) and the Moving Average Convergence Divergence (MACD) continues to decline with increasing risks, traders will shift their focus to the support range between $2.95 and $3.00. From here, a rebound could occur if the bulls absorb the selling pressure and buy th
XRP-6.26%
View Original
post-image
  • Reward
  • 1
  • Share
Ybaservip:
Quick, enter a position! 🚗
#Ethereum 10th Anniversary#
Altcoin Updates: Ethereum Challenges the Frenzied Market Conditions
The price of Ethereum has risen near the $4000 barrier, primarily driven by institutional demand and increased interest from individuals. High spot trading volumes, an open interest ratio of (OI) in futures, and funding rates continue to support the bullish trend of the token, which has remained volatile around the $3800 level.
However, the Relative Strength Index (RSI) indicates an overbought condition at 74, which may lead to a pullback before the next upward wave. The Relative Strength Index show
ETH-5.55%
View Original
post-image
  • Reward
  • 1
  • Share
Ybaservip:
Quick, enter a position! 🚗
#July Market Forecast# , BTC
The price of Bitcoin generally holds above the support level at 116,000 US dollars and the resistance level at 120,000 US dollars. The technical price forecasts tend to drop slightly, as the Moving Average Convergence Divergence (MACD) maintains a sell signal on the daily chart below since Thursday.
If macroeconomic uncertainty leads to a state of instability, traders may consider reducing their exposure, which will contribute to increased selling pressure. Therefore, another increase in liquidity at lower support areas, such as $116,000, and the 50-day exponentia
BTC-2.81%
View Original
post-image
  • Reward
  • 1
  • Share
Ybaservip:
Quick, enter a position! 🚗
#XRP # #July Market Forecast#
Technical Forecast: The technical indicators for XRP provide mixed signals.
XRP traders are watching cautiously as the price movement has stabilized at the resistance level of $3.20, while the risk of a downturn is increasing. The Moving Average Convergence Divergence (MACD) indicator signaled a sell on Thursday when the blue line crossed below the red signal line.
Investors often think about reducing their exposure after identifying this signal, which is currently reinforced by the red histogram bars below the zero line.
Although the Relative Strength Index shows
XRP-6.26%
View Original
post-image
  • Reward
  • 2
  • Share
Ybaservip:
Quick, enter a position! 🚗
View More
#July Market Forecast#
#XRP#
XRP recovery halts amid declining open interest
The correction from the highest level ever, which was achieved on July 18, can be attributed to the cryptocurrency price break last week when the price of Bitcoin (BTC) slightly dropped below $115,000.
Other factors that may have contributed to the sell-offs, which saw the price of XRP drop to the support level of $2.95, include potential profit-taking activities and a shift in market sentiment, especially with the release of key macroeconomic data from the United States this week.
John Isige John Isige
FXStreet
Foll
XRP-6.26%
BTC-2.81%
View Original
post-image
  • Reward
  • Comment
  • Share
#ETH Back to $3,800#
BTCS enhances its exposure by 14,240 ETH
BTCS Inc. announced on Monday the purchase of an additional 14,240 ETH at an average price of $3,850, bringing its total holdings to 70,028 ETH valued at approximately $270 million.
The blockchain technology company, also known as Blockchain Technology Consensus Solutions, has closed its issuance of convertible bonds worth 10 million dollars, which were structured with a conversion price of about 13 dollars per share.
The CEO of BTCS, Charles Allen, stated that the company’s Accretion Flywheel strategy for decentralized finance (DeF
ETH-5.55%
DEFI-12.83%
View Original
post-image
  • Reward
  • Comment
  • Share
#ETH Trading Volume Surges#
Ethereum is nearing a breakout
The price of Ethereum is nearing a new breakout after bouncing from a support level close to $3,700. The chart below, for the four-hour time frame, shows that the price of Ethereum is testing the resistance of the trend line, which, if broken, could encourage risk-taking and strengthen the upward trend towards the $4,000 barrier.
In the event of a reversal, the 50-period exponential moving average at $3,675 will form the primary support level. If the decline continues, the 100-period exponential moving average at $3,451 and the 200-per
ETH-5.55%
View Original
post-image
  • Reward
  • 1
  • Share
Lethevip:
It will eventually have a big dump, there are too many profitable positions...
The Bitcoin cycle index (IBCI) closed at the distribution zone, a range known to reflect euphoria and potential market peaks, now for the third time during the current bullish BTC cycle, according to CryptoQuant.
"However, the index only touched the lower boundary of this zone, reaching the 80% mark, which is still far from the 100% that indicated major peaks in previous BTC cycles," one analyst at CryptoQuant highlighted on Thursday.
The IBCI indicator level, as shown in the chart below, indicates that the market is undergoing an expansion phase, but it has not yet reached its peak, which sig
BTC-2.81%
View Original
post-image
post-image
  • Reward
  • Comment
  • Share
ETH-5.55%
[The user has shared his/her trading data. Go to the App to view more.]
  • Reward
  • Comment
  • Share
#July Market Forecast#
#XRP#
For Ripple (XRP), its price is rebounding above the support level at USD$3.07, provided by the 100-period exponential moving average on the four-hour chart. A steady uptrend in price may trigger a buy signal from the MACD indicator, prompting traders to look for investment opportunities. Therefore, traders should watch for the cross of the blue MACD line above the red signal line.
Despite the improvement in the technical picture in the short term, the fundamentals of XRP show weakness, particularly in open interest rates for futures and funding rates, which have de
XRP-6.26%
View Original
post-image
  • Reward
  • Comment
  • Share
#ETH Trading Volume Surges#
Traded in analyses and news of cryptocurrencies that "Ethereum is approaching a breakout"
"Ethereum's price is approaching a new breakout after bouncing off a support level near $3,500. The chart below, for the four-hour timeframe, shows that Ethereum's price is testing the resistance of the trend line, which, if broken, could encourage risk-taking and bolster the upward trend towards the $4,000 barrier.
In the event of a reversal, the 50-period exponential moving average at $3,575 will form the first major support. If the decline continues, the 100-period exponenti
GT-3.6%
XRP-6.26%
ETH-5.55%
BTC-2.81%
View Original
post-image
  • Reward
  • Comment
  • Share
#July Market Forecast#
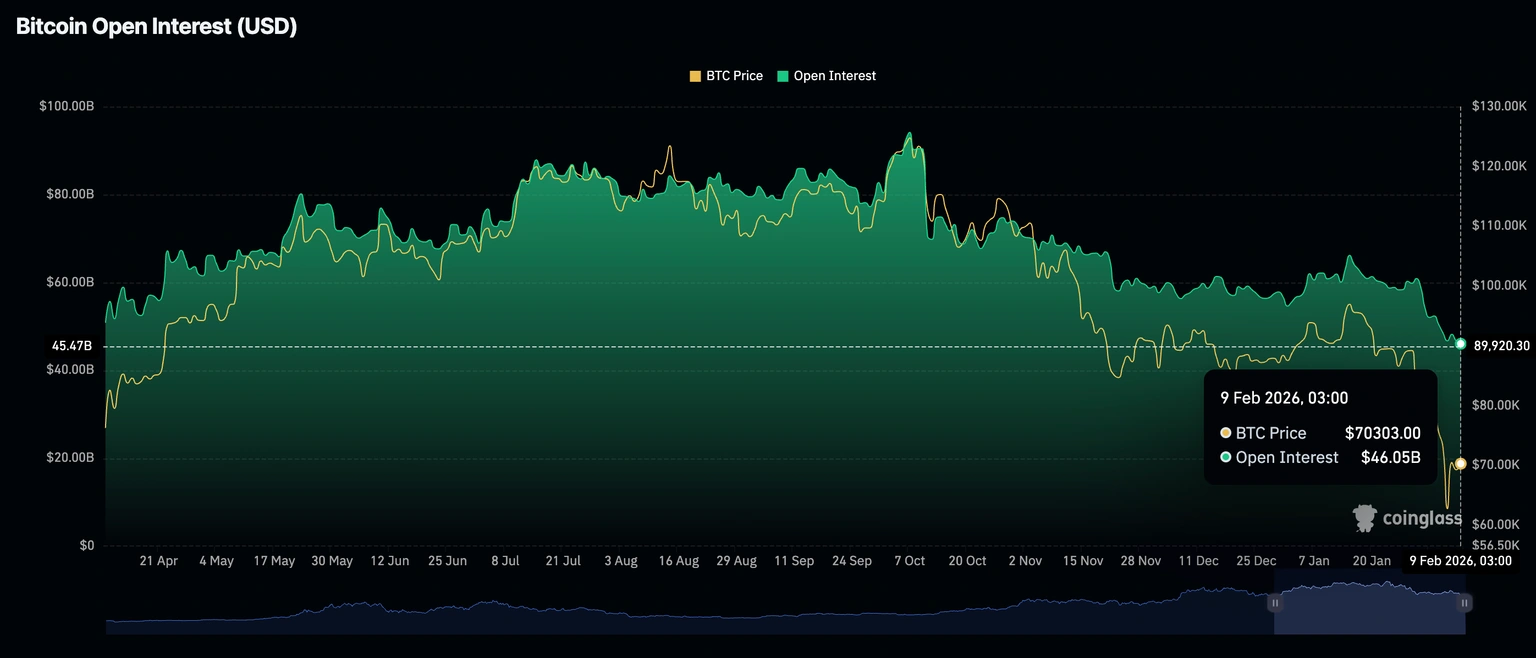
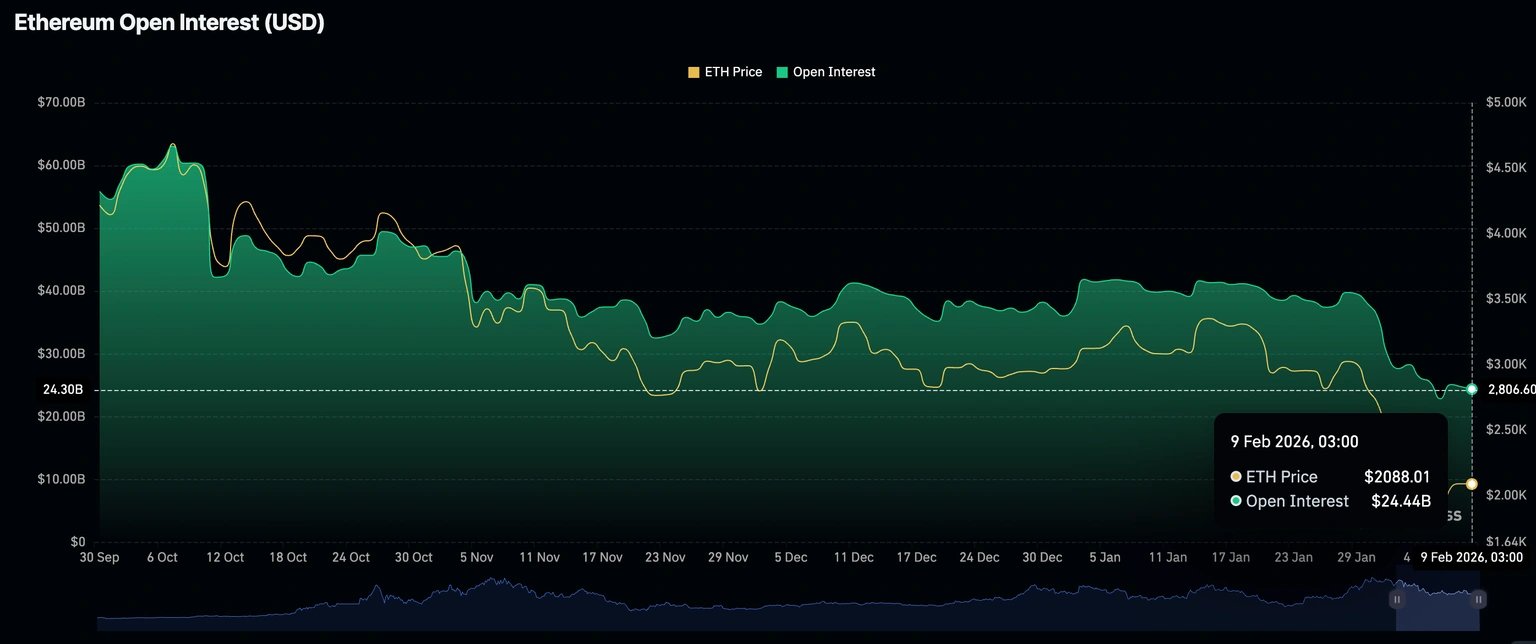
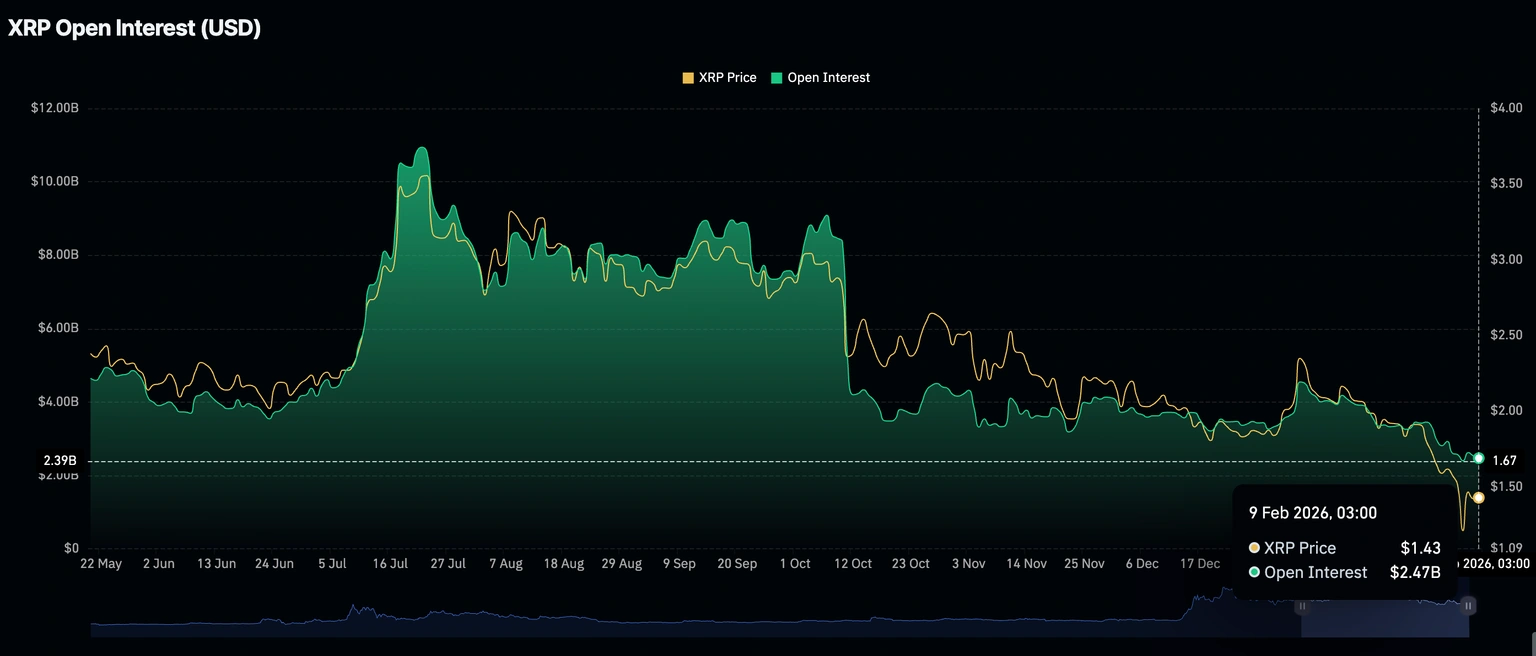
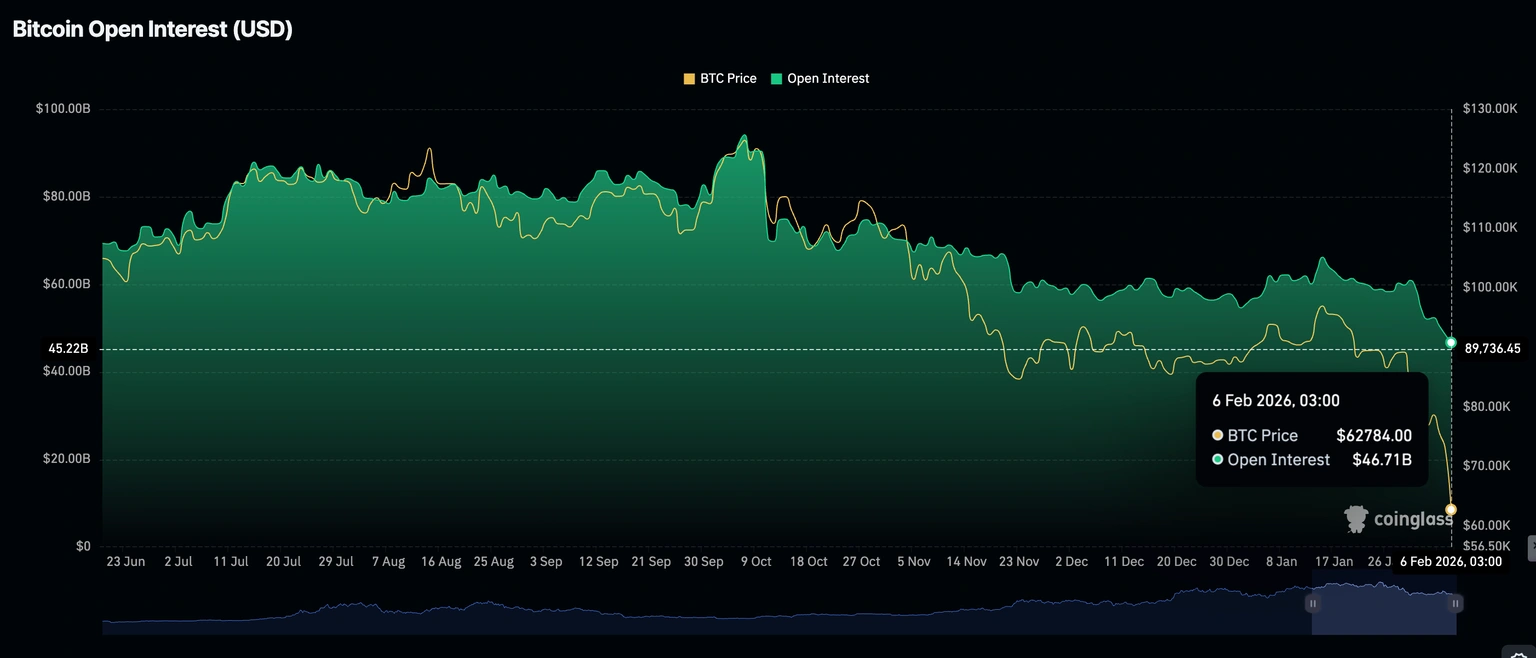
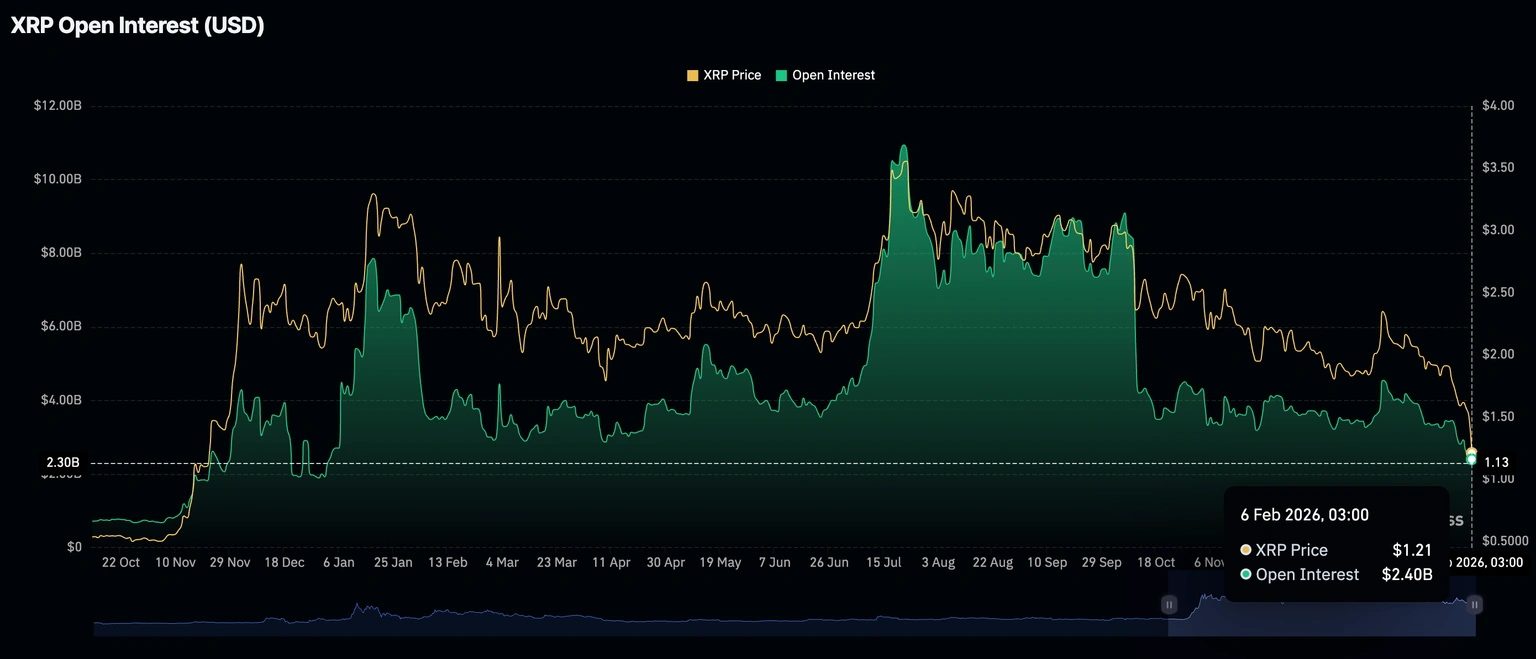
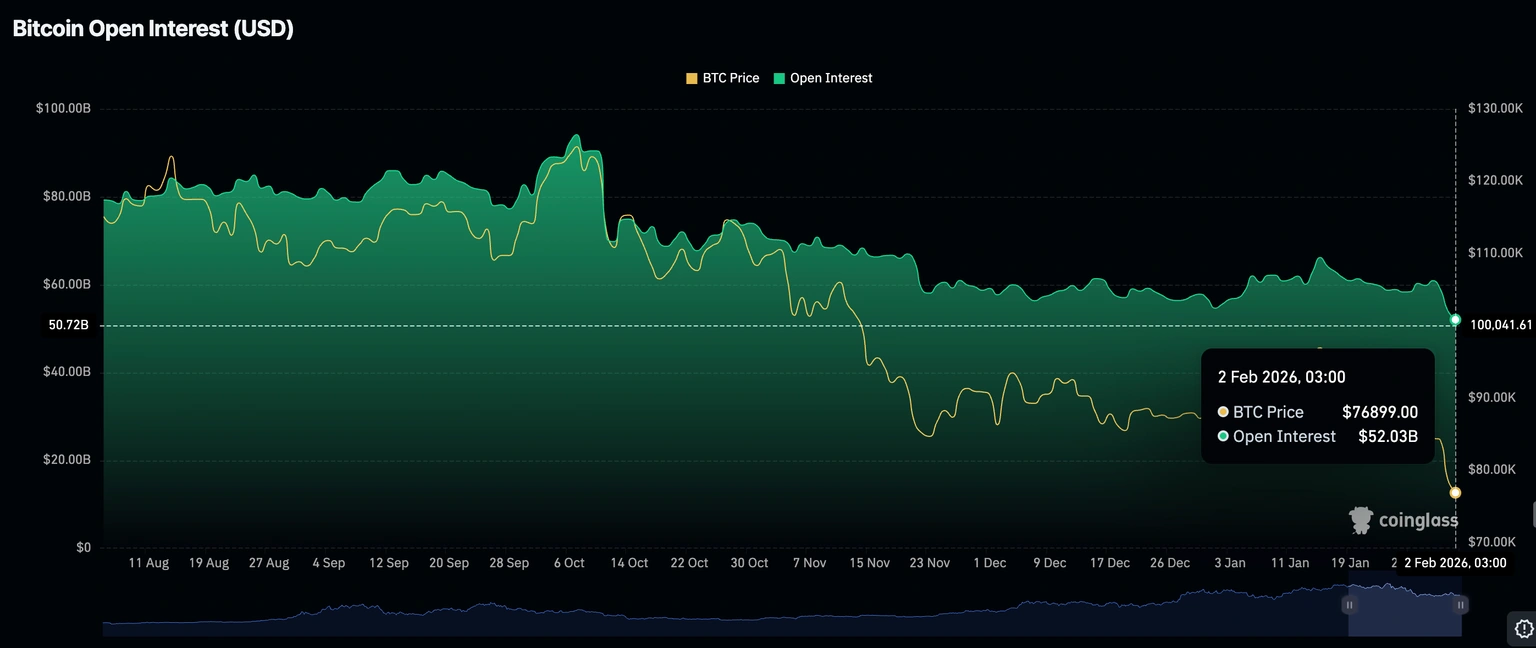
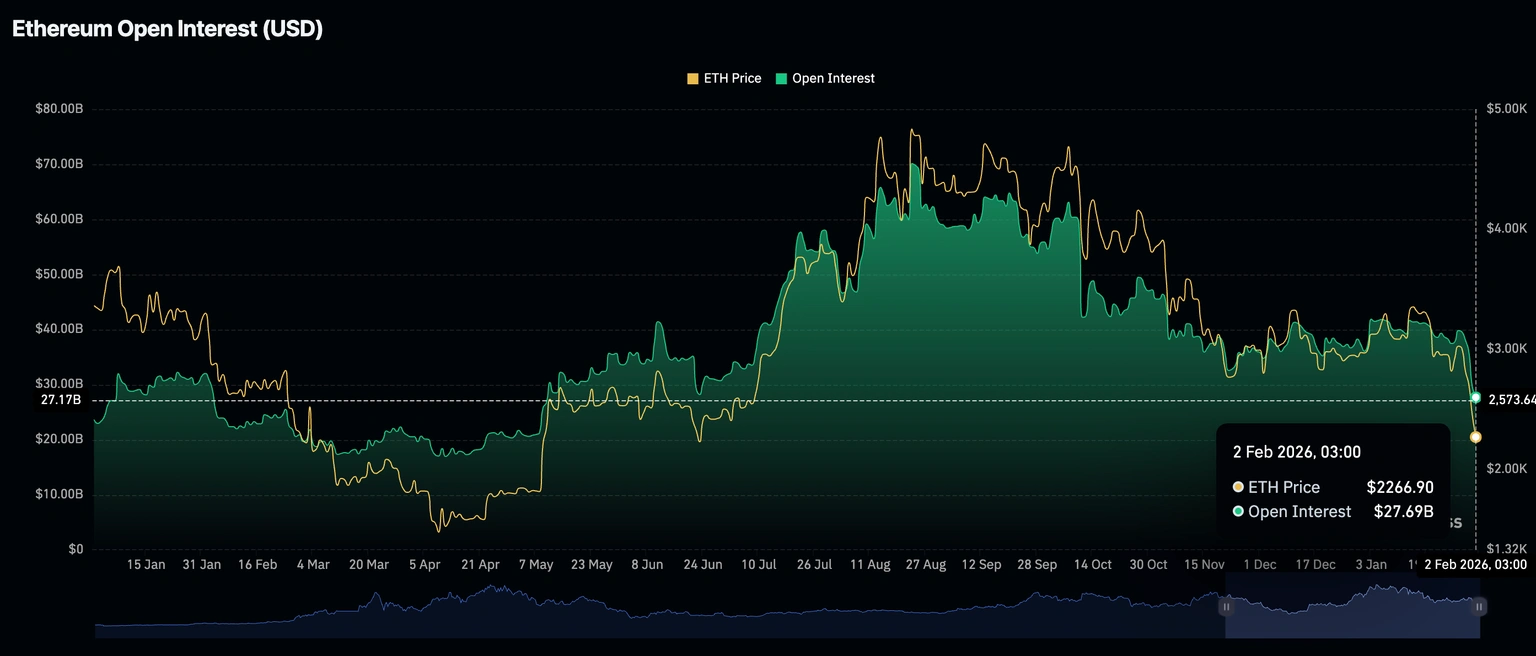
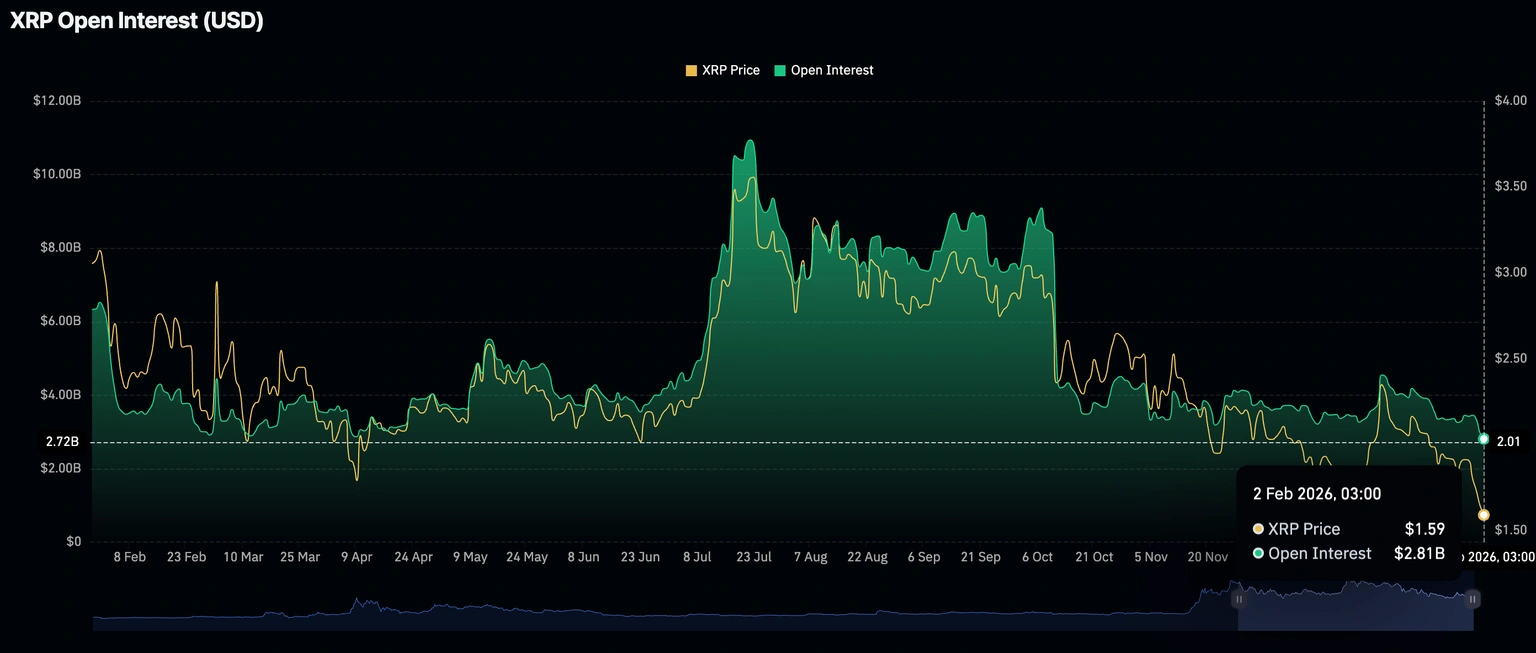
Market Overview: Decline in open interest for BTC, ETH, and XRP
The open interest rate (OI) in the derivatives market is a key indicator of investor interest in the cryptocurrency market. By closely monitoring it, traders can understand the potential trend of various assets in the short term.
For example, the volume of Bitcoin futures, which has maintained a general downward trend in the past few days, reached $83.55 billion compared to $87.89 billion recorded on July 15.
The decrease in OI reflects the suppressed bullish price movement of Bitcoin, which reached $120,090
BTC-2.81%
ETH-5.55%
XRP-6.26%
View Original
post-image
post-image
post-image
  • Reward
  • 2
  • Share
JokerTCvip:
Watch closely 🔍
View More
#July Market Forecast#
Bitcoin is sweeping liquidity around the support level of $117,116 and igniting a new rally targeting $120,000.
Ethereum is retesting support at $3500 and is recovering slightly, but bearish concerns remain amid a decline in technical strength.
XRP is facing continuous selling supported by a decline in the Relative Strength Index and a potential sell signal from the MACD indicator.
Cryptocurrencies are facing relatively strong fluctuations on Thursday, especially altcoins, led by Ethereum (ETH) and Ripple (XRP). The largest smart contract token is stabilizing at around $
XRP-6.26%
ETH-5.55%
BTC-2.81%
View Original
post-image
  • Reward
  • Comment
  • Share
#ETH Hits 4800#
Ethereum's exit is reaching nine days of waiting, with nearly 2 billion dollars worth of Ethereum ready to exit the network:
- The waiting time for Ethereum investigators to exit reaches nine days after the recent increase of 160%.
- A total of 521,252 ETH is shown in the checklist waiting to exit the Ethereum network.
- The number of investigators leaving the Ethereum network exceeds the number of new investigators entering by 3 days.
The Ethereum network (ETH) is witnessing a mass exodus of validators waiting in line to exit with the Ethereum they staked. The 160% rise in Eth
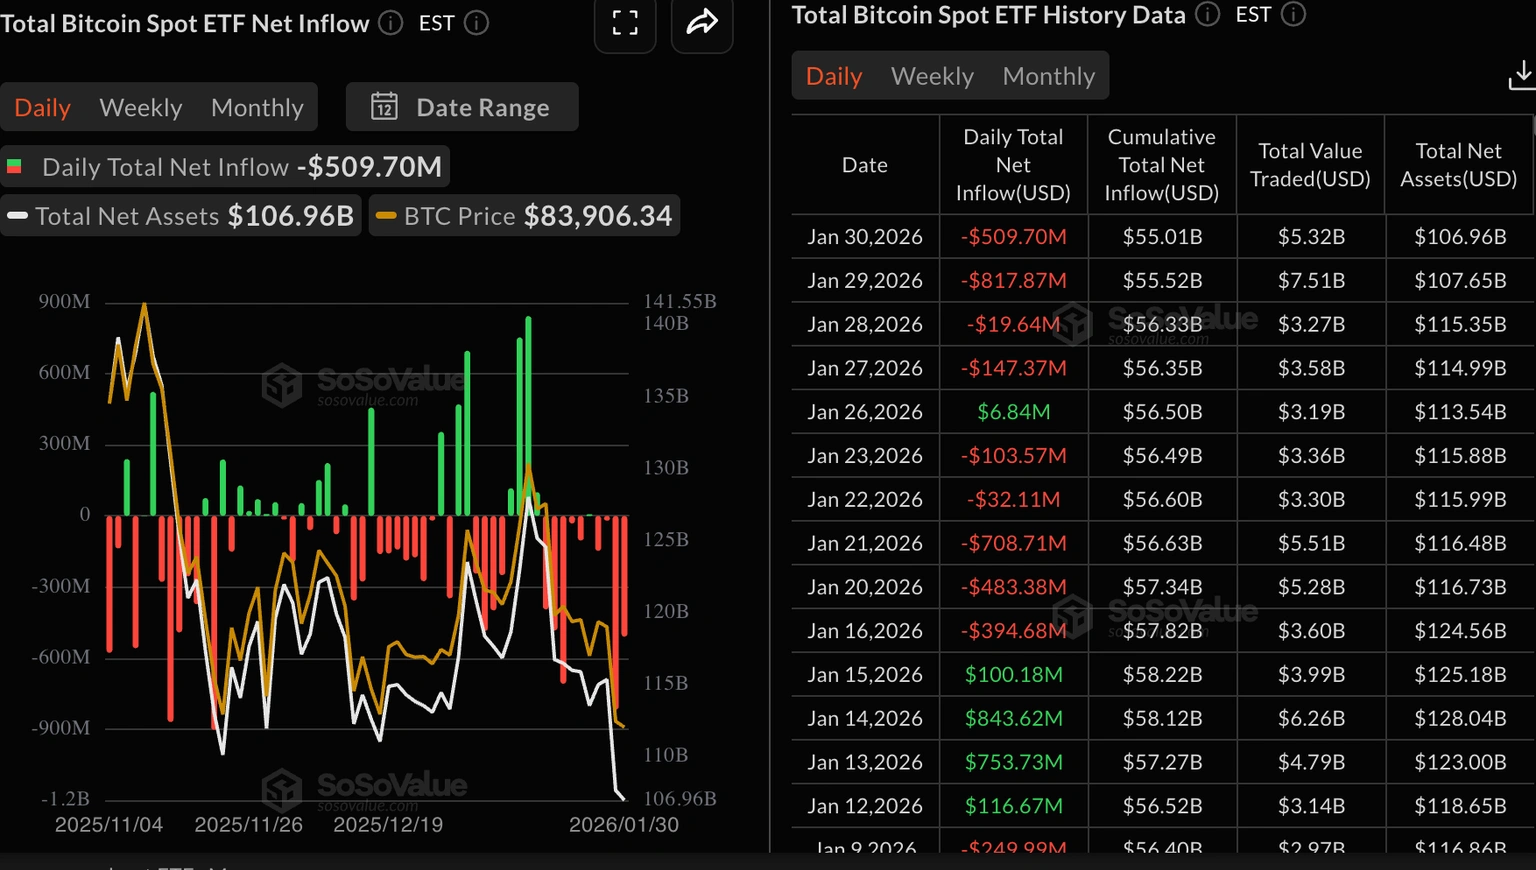
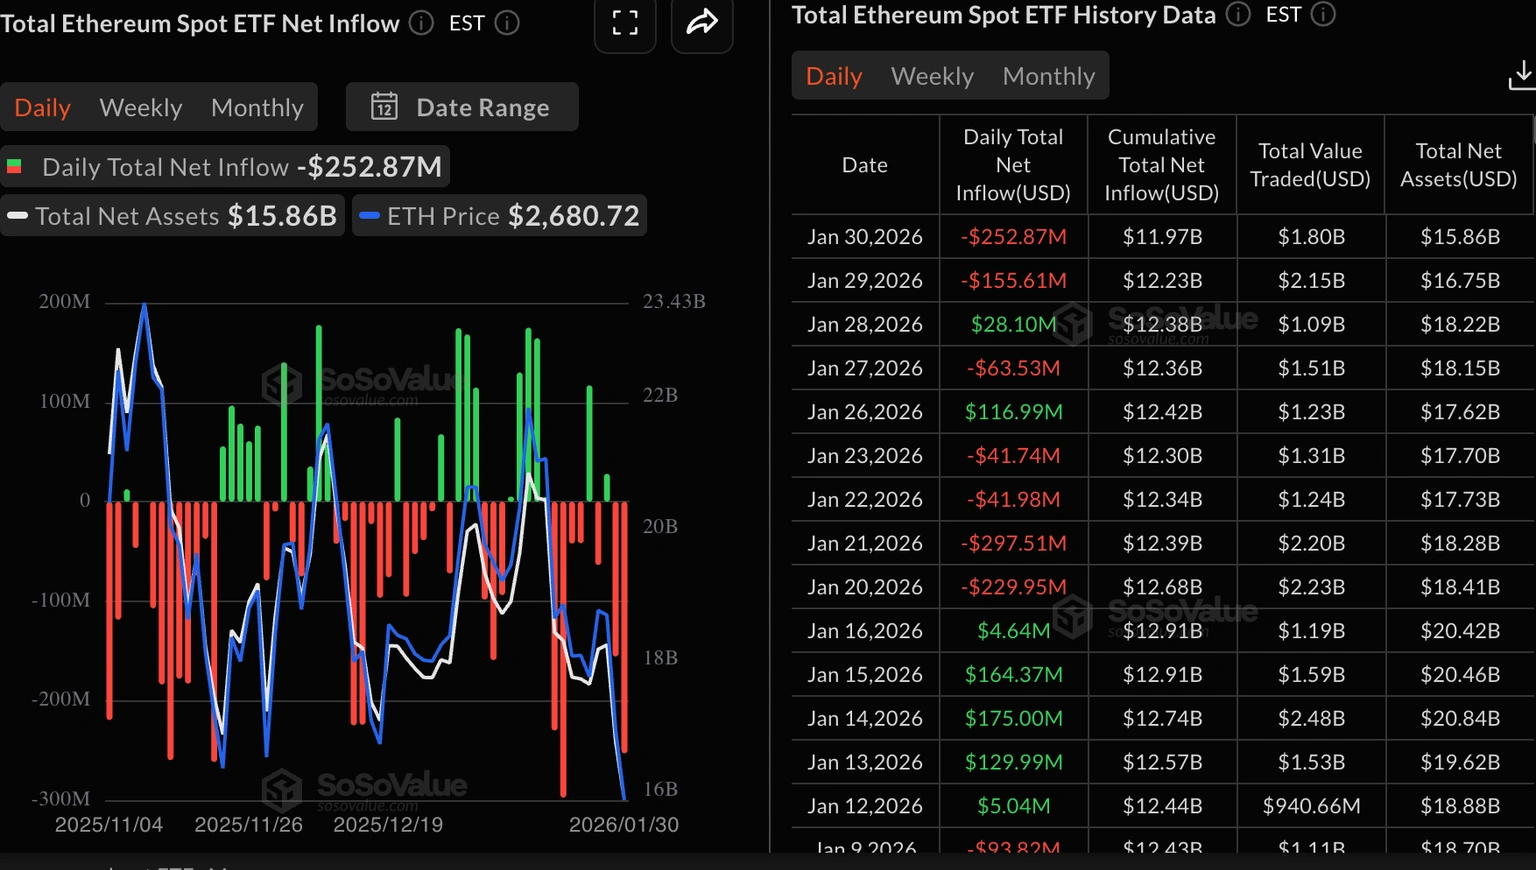
ETH-5.55%
View Original
post-image
post-image
post-image
post-image
  • Reward
  • Comment
  • Share
#July Market Forecast#
#Institutions Buying Bitcoin#
Today's Plan: Bitcoin Holds Its Bullish Potential
The price of Bitcoin shows signs of continuing the upward trend, starting from the Relative Strength Index (RSI), which recently declined from high levels around 60. The trend following tool has risen to 65 at the time of writing this report, indicating the building of upward momentum.
The rising moving averages support, which is significantly below the current price, the solid technical structure. In the daily chart below, the 50-day Exponential Moving Average (EMA) is at $110,596, the 100-d
BTC-2.81%
XRP-6.26%
ETH-5.55%
View Original
post-image
  • Reward
  • 1
  • Share
ZamiBaevip:
Bull Run 🐂
Bitcoin is consolidating in a symmetrical triangle for four hours.
The value of Bitcoin rose at the beginning of last week, touching a range of 120,000 to 123,000 USD before being rejected near the 78.6% Fibonacci extension level. Since then, it has formed a symmetrical triangle pattern on the four-hour chart, which is a traditional consolidation pattern preceding any major breakouts.
The volume accumulates at the peak of the triangle, and can be observed through the fixed volume profile, indicating an aggressive stance before a potential breakout.
Technologies to watch:'
The measured movement
ETH-5.55%
BTC-2.81%
View Original
post-image
  • Reward
  • Comment
  • Share
#GENIUS Stablecoin Act#
The signing of the Genius Law, and a big rise in Bitcoin and altcoin prices - what's next?
Bitcoin recorded a new weekly all-time high, while Ethereum rose by more than 20%, and the Altcoin Season Index just broke above the 50 level – a key threshold indicating that the momentum for altcoins has just begun.
On the macroeconomic front, the "Crypto Week" in Washington achieved real victories, with the Genius Act now becoming law, and other key bills receiving approval from the House of Representatives.
If you are waiting for a signal, this week may have dropped by only th
ACT-9.31%
View Original
post-image
  • Reward
  • Comment
  • Share
#ETH Breaks $3600#
#BTC Hits New High#
Bitcoin and Ethereum market analysis on Sunday evening and weekly summary
I reviewed the weekend market, and Bitcoin's performance was relatively stable, dropping in the morning to a low of 117245 before rising again, while reaching a high of 118214 in the afternoon, providing buyers with over 1000 points of upward space. As for Ethereum, it showed a strong upward trend overall this week, although the pace slowed down during the weekend. In the morning as well, it stopped at a low point of 3531 before rising concurrently, reaching its current high of 3695
ETH-5.55%
BTC-2.81%
View Original
post-image
post-image
  • Reward
  • 6
  • Share
GateUser-e9783215vip:
top-notch. soon Ethereum 10000$. waiting ⚡⚡⚡
View More
#ETH Breaks $3600#
$ETH is being attracted towards $4,000 like a magnet! 🧲
This breakout is no joke - Ethereum just printed a massive weekly candle, surpassing resistance and confirming a reversal.
📈 Key levels:
Strong rebound from the long-term support trendline ✅
It has surpassed a significant resistance around $2,400–$2,800 🔓
The next major area? $4,000 – and the price action is moving towards it with momentum.
Don't be surprised when the price of $ETH reaches $4K or 4.8k in the coming days. The price discovery comes after that! 🚀
{Spot}(ETHUSDT)
{spot}(XRPUSDT)
#ETHBreaks3700 #
Also: $
ETH-5.55%
View Original
post-image
  • Reward
  • Comment
  • Share
  • Topic
    1/3
  • Pin
Trade Crypto Anywhere Anytime
qrCode
Scan to download Gate app
Community
English
  • 简体中文
  • English
  • Tiếng Việt
  • 繁體中文
  • Español
  • Русский
  • Français (Afrique)
  • Português (Portugal)
  • Bahasa Indonesia
  • 日本語
  • بالعربية
  • Українська
  • Português (Brasil)