Futures
Access hundreds of perpetual contracts
TradFi
Gold
One platform for global traditional assets
Options
Hot
Trade European-style vanilla options
Unified Account
Maximize your capital efficiency
Demo Trading
Introduction to Futures Trading
Learn the basics of futures trading
Futures Events
Join events to earn rewards
Demo Trading
Use virtual funds to practice risk-free trading
Launch
CandyDrop
Collect candies to earn airdrops
Launchpool
Quick staking, earn potential new tokens
HODLer Airdrop
Hold GT and get massive airdrops for free
Launchpad
Be early to the next big token project
Alpha Points
Trade on-chain assets and earn airdrops
Futures Points
Earn futures points and claim airdrop rewards
More
Zhang Yaoxi: Although the US-Iran agreement only a ceasefire for two weeks, gold and silver still have the potential to reach new highs within the year
Zhang Yao Xi: The U.S.-Iran deal only pauses the fighting for two weeks, yet gold and silver still have prospects for new highs within the year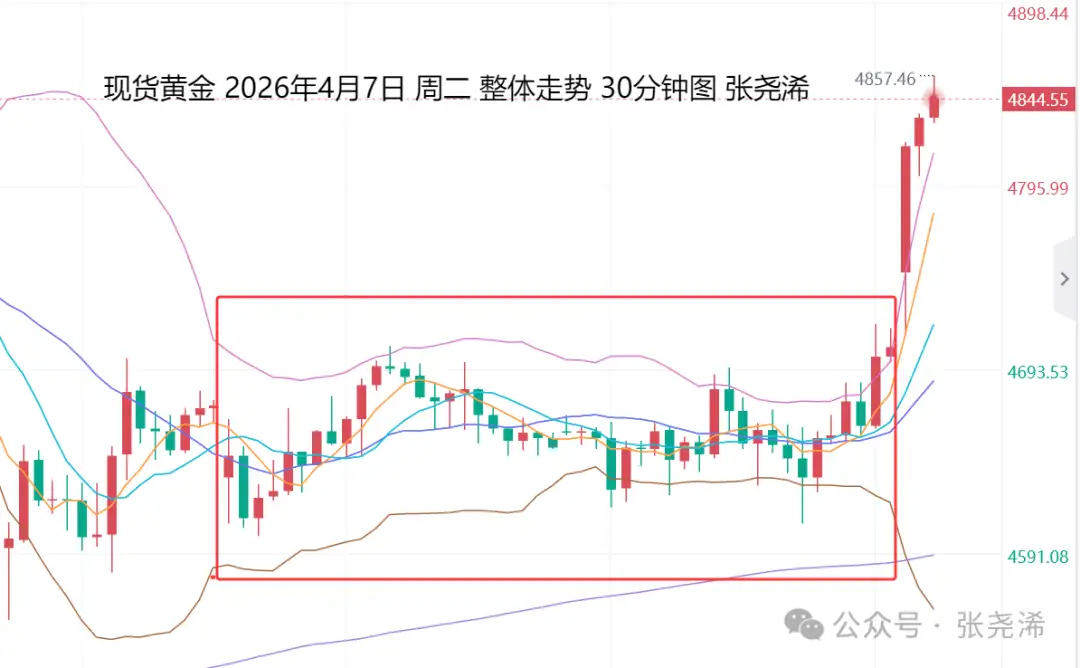
In the previous trading day on Tuesday (April 7): After international gold opened at 4651.27 dollars per ounce in the Asian session, it first moved lower, logging an intraday low of 4607.87 dollars, as Trump issued a last ultimatum to Iran, demanding it open the Strait of Hormuz before the end of Tuesday; otherwise, it would hit Iranian power plants and other infrastructure, pushing oil prices higher and weighing on gold prices first;
However, supported by bargain-buying demand, as well as the People’s Bank of China continuing to increase its gold holdings for the 17th consecutive month, and as Iran is actively considering the request from Pakistan to pause fighting for two weeks, oil’s rebound was limited and gold prices recovered and strengthened. In the U.S. session’s late-hour period, it hit the intraday high of 4717.98 dollars; in the end, it met some resistance at the pressure of the midline, closing at 4705.87 dollars, with an intraday range of 110.11 dollars, closing up 54.6 dollars, up 1.17%.
Looking ahead to today, Wednesday (April 8): International gold opened with a direct surge, gaining more than 2% in the early session. Since Iran accepted the ceasefire proposal put forward by Pakistan, and Trump also said he agreed to pause bombardment and attacks on Iran within two weeks, geopolitical risk and the bullish outlook for crude oil were greatly reduced, causing oil prices to fall by more than 15% in the early session. The probability of the Federal Reserve cutting rates this year has risen.
So in the short term, over the next two weeks, the gold price will either rebound due to the ceasefire agreement maintaining support, or pull back because of profit-taking from positions that were previously trapped; overall it will likely see range-bound volatility, but the direction is still biased upward, making it difficult to keep probing lower. The only factor that could cause a pullback is the Federal Reserve meeting minutes that will be released soon this week. At that time, they may reveal officials’ concerns about inflation and the potential economic impact brought by interruptions to the Iran conflict and related energy and other commodity flows—but this is also two-sided. On the one hand, inflation rises; on the other, the economy is harmed. Overall, it results in stagflation, which still remains supportive for gold.
Furthermore, Friday 20:30 U.S. March CPI. The market expects that, affected by the Iran war driving up gasoline prices, March CPI will rise by around 1%. This would be the biggest single-month increase since 2022. It will weaken the outlook for the Fed to cut rates and be bearish for gold; but currently, geopolitical tensions have eased, the ceasefire lasts for two weeks, and crude oil has fallen sharply as well. Therefore, if it matches expectations, the market reaction is expected to be very small—or after a pullback, it may rebound again. Thus, in terms of trading, this week is still mainly biased bullish.
On fundamentals, Zhang Yao Xi’s remarks: Although after the outbreak of the Iran conflict the gold price saw a sharp pullback, and selling pressure accelerated as Turkey and Gulf countries dumped gold, the underlying reason is not that the bull market has ended or that the outlook has turned bearish; rather, it’s because oil exports were obstructed and they need to make up for expenses. And as a result, gold is now playing the role of a high-liquidity asset, which also increases gold’s appeal as a hard currency.
Gold is an asset with no liabilities; unlike government bonds of various countries, buying gold means directly holding the asset in full. But buying U.S. Treasuries, in essence, is providing a loan to the U.S. government. As military spending increases, debt and budget deficits keep expanding, so gold’s appeal will continue to rise. De-dollarization will also become an inevitable trend; gold will become a core alternative choice.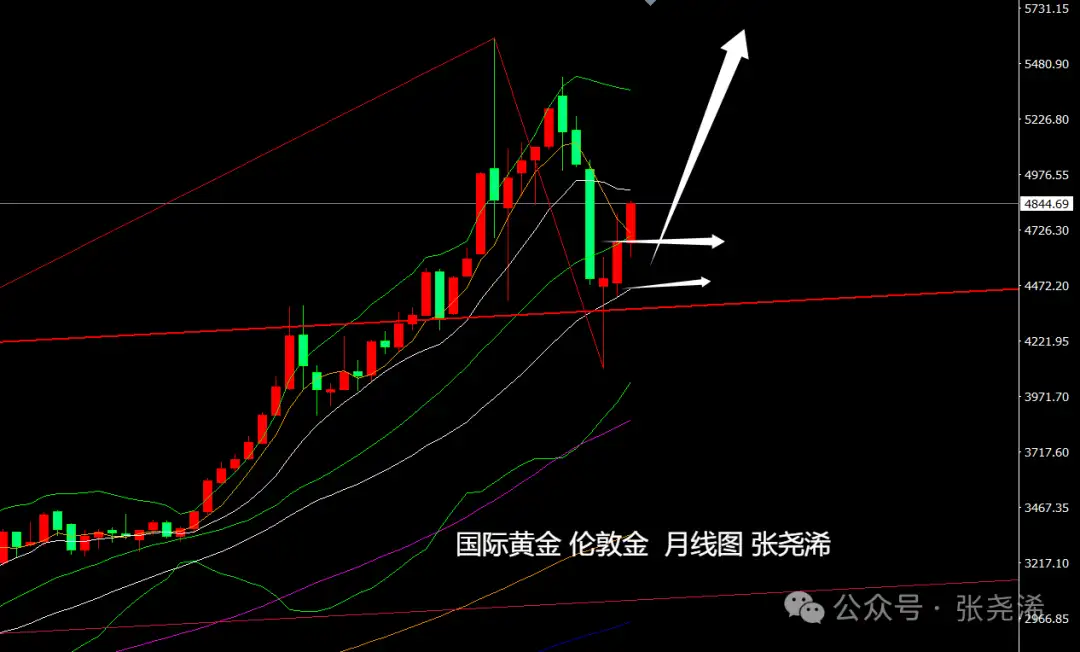
Therefore, setting aside the current geopolitical conflict, in the medium term I still expect the gold price to break above 6000 dollars per ounce.
Even if we don’t set aside the geopolitical conflict, the Iranian conflict will ultimately come to an end—just a matter of time. In the short term, rising energy prices trigger a surge in inflation expectations, causing rate-cut expectations to turn into rate-hike expectations; coupled with a liquidity crisis, gold and silver become the easiest assets to liquidate, triggering a wave of selling.
But in the mid-to-long term, the war leads to a supply crisis, which also weighs on the economy and creates recession concerns, and it also leads to stagflation risks—perhaps these are already on the way. This is favorable for gold and silver’s long-term rise. So by the end of this year, the gold price still has hope of testing above 6000 dollars.
Silver is expected to test above 150 dollars.
Technically, on the monthly timeframe, the March closing price of gold is above the rising trendline, maintaining a bullish outlook. The month’s opening price also remains above this rising trajectory. As long as the later trend does not close below this trendline, expectations for new highs will still remain.
On the weekly timeframe, the gold price this week is currently continuing the bullish pattern of the rebound from a recent bottom seen in the prior week, and it is strengthening again. It is currently trading above the midline, and momentum for the bulls is increasing. If this week closes above this level, or if it is above the resistance of the 10-week moving average at more than 4900 dollars, then expectations for new highs will be in place for the next move. Conversely, it would delay the range-and-adjustment cycle and continue waiting for bullish momentum to arrive.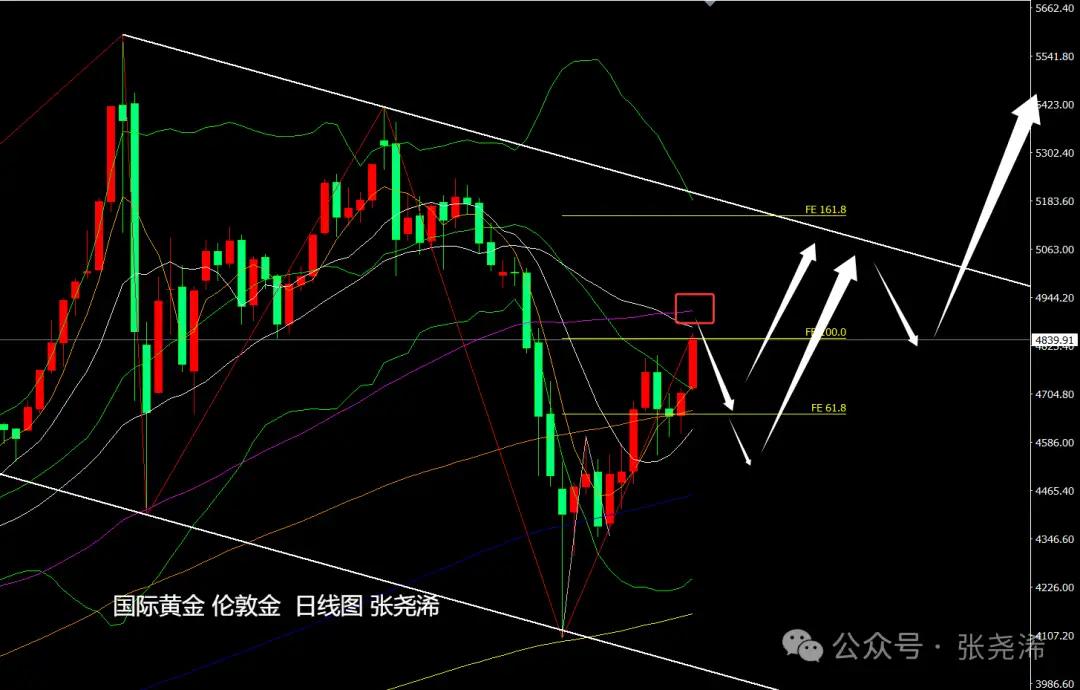
On the daily chart, gold’s price action currently has strengthening bullish momentum. It is trading above the 100-day moving average and the midline during the day. But the ZZ indicator shows that the rebound has topped out, implying that the intraday rebound has hit near the resistance zone and be alert to pullback risk. Watch for resistance adjustments around the 60-day moving average resistance or near 5100 dollars. However, the direction is still upward; after adjustments, or once it breaks above the 5200-dollar threshold, it will once again surge to break to new highs.
Gold: Support to watch below at around 4780 dollars or 4700 dollars; Resistance to watch above at around 4900 dollars or 4960 dollars;
Silver: Support to watch below at 75.25 dollars or 74.30 dollars; Resistance to watch above at 78.50 dollars or 80.20 dollars;
Note:
Gold TD = (international gold price × exchange rate) / 31.1035
International gold moves by 1 dollar; gold TD is about 0.25 yuan movement (theoretically).
U.S. futures gold price = London spot price × (1 + gold swap interest rate × number of days to futures maturity / 365)
Follow me—so your gold trading ideas become clearer!
Review historical cause and effect, interpret the current environment, and look ahead to future directions. Adhere to the principle of bold forecasting and cautious trading.–Zhang Yao Xi
The views and analysis above only represent the author’s personal thoughts, for reference only, and do not constitute trading advice or a basis for trading. If you act on this information, you bear all risks and profits/losses at your own responsibility.
You decide your own money。