Futures
Access hundreds of perpetual contracts
TradFi
Gold
One platform for global traditional assets
Options
Hot
Trade European-style vanilla options
Unified Account
Maximize your capital efficiency
Demo Trading
Introduction to Futures Trading
Learn the basics of futures trading
Futures Events
Join events to earn rewards
Demo Trading
Use virtual funds to practice risk-free trading
Launch
CandyDrop
Collect candies to earn airdrops
Launchpool
Quick staking, earn potential new tokens
HODLer Airdrop
Hold GT and get massive airdrops for free
Launchpad
Be early to the next big token project
Alpha Points
Trade on-chain assets and earn airdrops
Futures Points
Earn futures points and claim airdrop rewards
More
Zhang Yao Xi: Oil Outlook Rises Again, Inflation Concerns Weigh on Gold Prices Short-term, Bull Market Prospects Remain
Zhang Yaoxi: Crude Oil Outlook Rises Again Amid Inflation Concerns; Gold Prices Face Short-Term Pressure but Still Have Bullish Prospects
On the previous trading day, Thursday (March 12): Despite Iran’s new Supreme Leader vowing revenge and blocking the Strait, oil prices surged regardless of reserves releases! This led to a continued strengthening of the US dollar, fueling inflation worries and also reducing expectations for Fed rate cuts, which pressured gold prices downward.
Revisiting the 30-day moving average support, volatility has increased compared to previous days. Based on the support levels and oscillation trends, a bullish outlook is still possible, maintaining a recent sideways trading pattern. However, before stabilizing above $5,200, the trend remains relatively weak and downward. Therefore, trading strategies include waiting for a further pullback to around $4,870 near the 60-day moving average support or waiting for a return above $5,200 to follow the trend. Until then, expect sideways consolidation.
Regarding specific movements, gold opened in Asia at $5,177.22 per ounce, initially forming a bottom and oscillating before rebounding in the midday session. It reached an intraday high of $5,191.42 during the European session and then entered a narrow range. At the US open, gold prices declined again, continuing downward to a daily low of $5,054.98, before rebounding to close at $5,079.17. The daily range was $136.44, with a net decline of $98.05, or 1.89%.
Looking ahead to Friday (March 13): International gold continued its rebound from the late-day low yesterday, supported by buying interest and a weakening US dollar index early in the session. However, the dollar index and crude oil prices are still expected to rebound in the short term, which will limit gold’s upside. Therefore, before gold reclaims $5,200, there remains a risk of further sideways decline.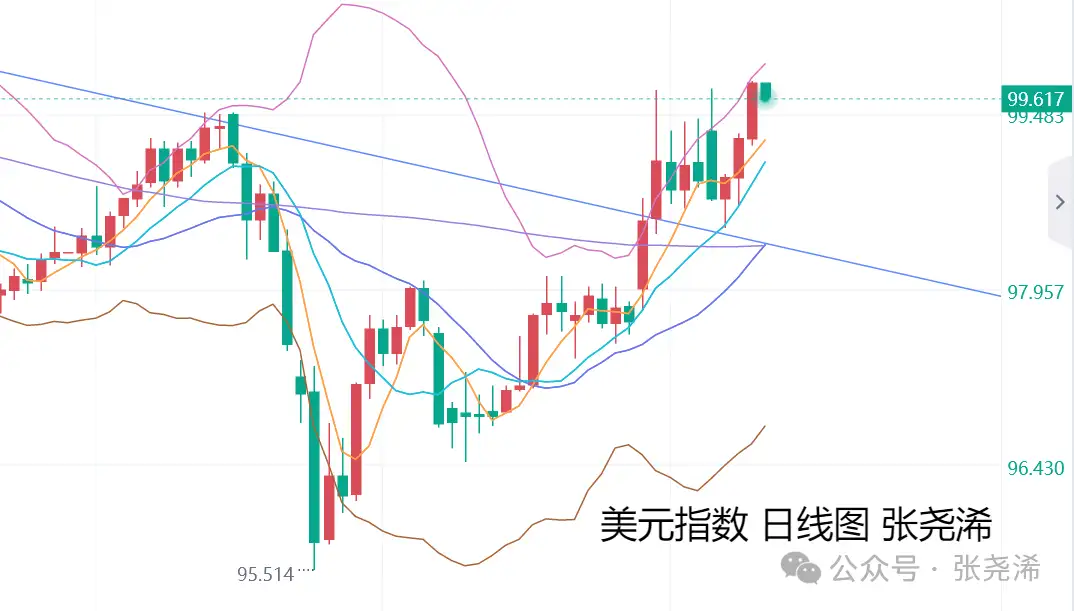
Today’s data focus includes the US January Core PCE Price Index Year-over-Year, US January Durable Goods Orders Month-over-Month, and initial March 1-year inflation expectations, among others. The market generally expects these to be bearish for gold. Even if positive, these are January data; considering oil prices are rising in March and inflation expectations are heating up, the positive impact on gold will be limited. The intraday trend is still expected to be weak, with oscillations offering both long and short opportunities.
From a long-term fundamental perspective, according to Zhang Yaoxi: Iran’s Supreme Leader Mujeetaba issued his first statement, saying he will not abandon revenge and that the Strait of Hormuz will remain closed. This will keep the market eager for higher oil prices and increase inflation concerns, weakening the Fed’s easing monetary policy expectations.
However, even if inflation surges like during the pandemic, it is unlikely to cause a sustained trend in gold prices. The US economy is slowing, with M2 money supply growth stagnating around 4% over the past year, so inflation is unlikely to rise as expected. Even if inflation increases, it probably won’t lead to rate hikes and may boost gold’s commodity attributes, causing it to oscillate or strengthen. Investors will also turn to gold as an inflation hedge.
Even if rates are raised, it will impose significant costs on US residents’ real income and purchasing power. Weak economic data will limit gold’s downside. Historically, rate hikes have not caused gold to enter a bear market but have instead maintained it within a range or during a bullish correction. A larger rate cut cycle is expected later, which will again drive gold into a bull market.
Looking back, from 2020 to 2022, crude oil prices surged from near zero to nearly $130, US inflation rose from 1.23% to 8%, and the Fed raised rates seven times significantly. During that period, gold mostly oscillated around $400 before continuing its upward trend.
Therefore, under the current long-term geopolitical uncertainties and ongoing central bank purchases, along with the possibility of rate cuts, gold still has bullish prospects. The corrections and declines in the first half of the year can be viewed as entry points.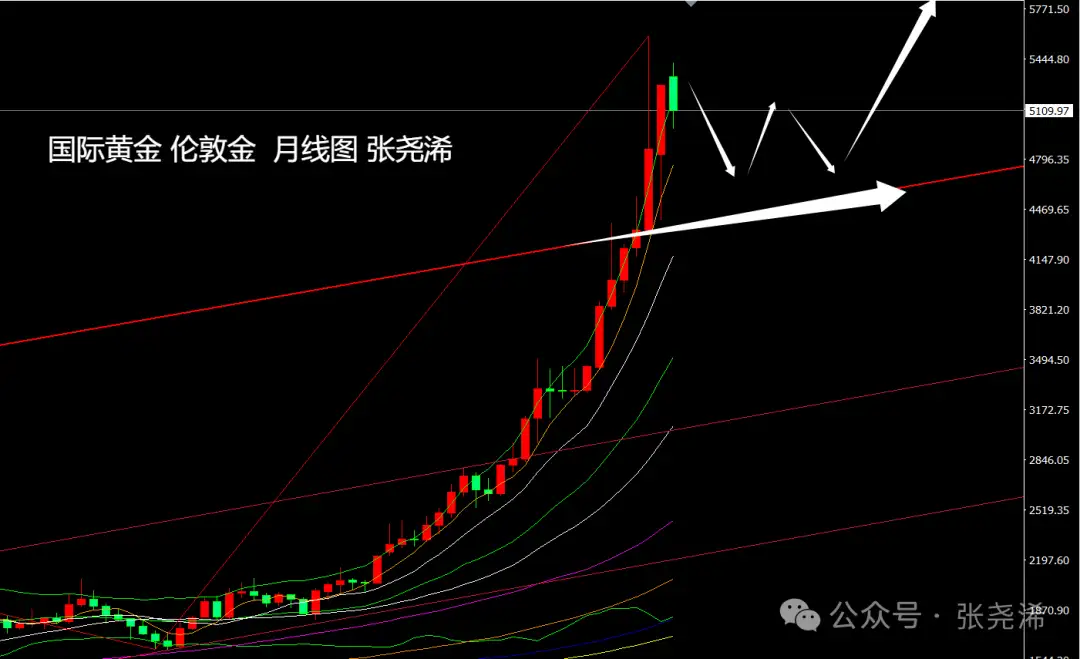
Technically, on the monthly chart, gold has shown weakness this month but remains above the 5-month moving average and the upward trendline broken in January. This suggests a still-strong bullish outlook. Even if the month ends with a sideways or bearish pattern, the trend will likely remain above the trendline with wide oscillations, followed by another rally.
Conversely, if the price breaks below the trendline support and closes below $4,300, it would signal the end of the bull market, potentially dropping to $3,500 or even lower, around $3,000. Currently, this scenario seems less likely.
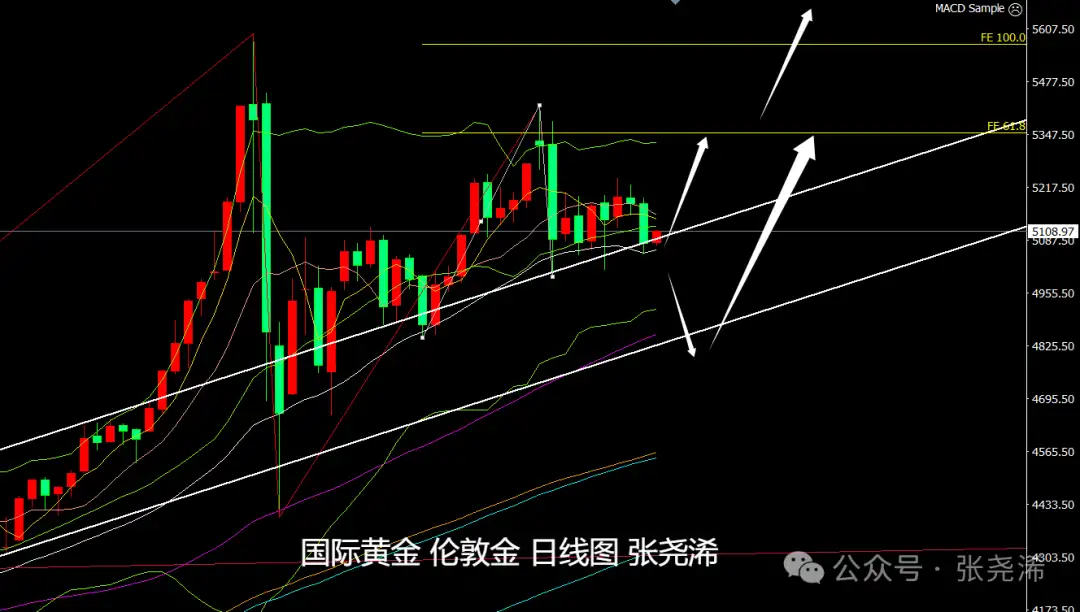
On the daily chart, gold has fallen below short-term and mid-term moving averages, with a bearish bias. In trading, a rebound to the mid or short-term moving average resistance can be viewed as a short opportunity. Support is mainly at the 30-day moving average; touching it could be a buy signal. If prices break above resistance and return above $5,200, look for bullish targets at $5,350 or $5,560. If the 30-day support is broken and a close below it occurs, consider long-term positions at $4,870 or $4,750.
Gold: Support levels at $5,065 or $5,015; resistance at $5,135 or $5,170.
Silver: Support at $83.25 or $81.15; resistance at $86.08 or $87.45.
Note:
Gold TD = (International gold price × exchange rate) / 31.1035
A $1 fluctuation in international gold price roughly causes a $0.25 change in Gold TD (theoretical).
US futures gold price = London spot price × (1 + gold swap rate × days to expiry / 365)
Follow me for clearer gold trading ideas!
Reviewing historical cause and effect, interpreting current environments, and projecting future trends—adopting bold predictions with cautious trading principles. – Zhang Yaoxi
The above opinions and analyses are solely the author’s personal views, for reference only, not trading advice. Trade at your own risk.
You decide your own money.