Cardano (ADA) Price Analysis: Daily Chart Consolidates Around $0.44 as Market Awaits a Breakout
Overview of Cardano ADA Recent Price Trends
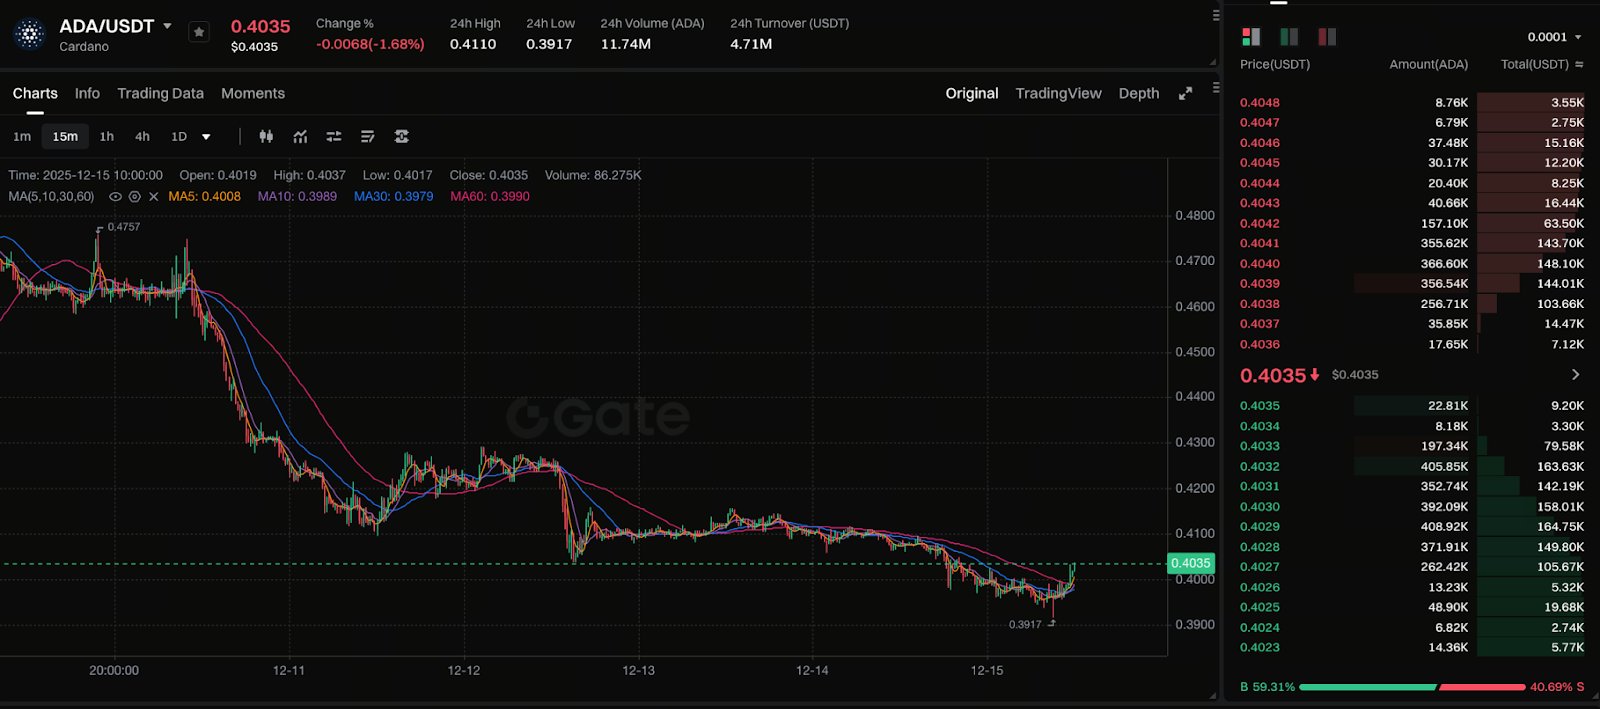
Chart: https://www.gate.com/trade/ADA_USDT
Cardano (ADA) has recently displayed a neutral daily pattern against a backdrop of overall market volatility, with prices fluctuating around the $0.44 pivot point. ADA briefly climbed above $0.44 and showed minor stabilization, but repeatedly encountered resistance in the $0.46–$0.47 range. This ongoing struggle highlights the short-term battle between bullish and bearish forces.
Data from multiple sources indicates that, while ADA’s short-term technical structure leans slightly bullish, medium-term downward pressure remains unresolved. As a result, current price action resembles range-bound consolidation rather than a confirmed uptrend, with market participants largely awaiting a decisive directional signal.
Technical Analysis Focus: $0.44 Key Pivot and Short/Medium-Term Trends
From a technical perspective, ADA’s daily chart reveals a critical confrontation near $0.44:
- The 20-day EMA is positioned around $0.44, serving as a short-term support/resistance pivot.
- Prices remain below both the 50-day and 200-day EMAs, signaling a continued bearish bias for the medium to long term.
- Intraday price behavior shows upper resistance pressure and firm support below.
Short-term EMA arrangements previously hinted at a brief bullish setup, but persistent medium-term EMA resistance suggests this is more of a rebound than a true trend reversal. Sustained price action above $0.46, followed by a breakout past $0.50, could signal an improvement in the medium-term outlook.
Market Sentiment and Macro Factors
In addition to technical factors, market sentiment has a clear impact on ADA’s price. Currently, sentiment is cautious, with traders tending to wait on the sidelines amid uncertain trends. Short-term indicators such as RSI remain in neutral territory, showing no clear signs of overbought or oversold conditions. This reflects a lack of momentum for strong directional moves in the short term.
Broader fluctuations in crypto market risk appetite also weigh on ADA. On the macro front, global financial market trends and Bitcoin price stability influence the performance of altcoins. As a result, ADA’s short-term direction remains closely linked to overall market sentiment, not just technical setups.
Support and Resistance: Key Levels for Traders
Within the current price structure, the following levels are critical:
- Support: The $0.42–$0.43 range is an important short-term support. A break below this could trigger further downside pressure.
- Resistance: The $0.46–$0.47 zone is a concentrated short-term resistance area. A breakout here may attract stronger bullish participation.
- Medium-term resistance: The 50-day and 200-day EMAs at $0.50 and $0.67, respectively.
These support and resistance levels are essential references for traders developing entry and stop-loss strategies. If prices close above resistance zones with increased volume, the likelihood of a trend reversal rises.
Possible Future Scenarios: Breakout or Range-Bound Movement
Based on current technical and sentiment analysis, ADA may follow two possible paths:
Scenario 1: Breakout
If ADA breaks through and holds above the $0.46–$0.47 resistance zone, and ultimately closes over $0.50, this could mark a shift from a short-term rebound to a more sustained uptrend.
Scenario 2: Range-Bound Consolidation
If repeated resistance tests fail, prices may continue to oscillate within the $0.42–$0.47 range. During consolidation, it’s important to watch for risks of support breakdowns, which could push prices lower to test stronger support levels.
Conclusion: Risk Management and Trading Strategy Advice
Overall, ADA’s current trend is neutral to slightly bullish, with prices consolidating around the $0.44 pivot. In this environment, traders should employ more cautious strategies:
- Short-term traders: Focus on buy-low, sell-high opportunities within the $0.42–$0.47 range.
- Swing traders: Wait for more definitive breakout signals before increasing position size.
- Risk management: Set clear stop-loss levels to guard against directional losses from potential breakouts.
In summary, the market is still awaiting a stronger trend signal. Identifying key support and resistance levels is crucial for capturing profits in the current range-bound environment.
Share
Content
Overview of Cardano ADA Recent Price Trends
Technical Analysis Focus: $0.44 Key Pivot and Short/Medium-Term Trends
Market Sentiment and Macro Factors
Support and Resistance: Key Levels for Traders
Possible Future Scenarios: Breakout or Range-Bound Movement
Conclusion: Risk Management and Trading Strategy Advice


Related Articles

2025 BTC Price Prediction: BTC Trend Forecast Based on Technical and Macroeconomic Data

Flare Crypto Explained: What Is Flare Network and Why It Matters in 2025

Pi Coin Transaction Guide: How to Transfer to Gate.com

How to Use a Crypto Whale Tracker: Top Tool Recommendation for 2025 to Follow Whale Moves

What is N2: An AI-Driven Layer 2 Solution