This article offers a comprehensive comparison of FUSE and LINK, two innovative blockchain interoperability solutions in the cryptocurrency market. It evaluates their investment potential by analyzing historical price trends, supply mechanisms, and institutional adoption, highlighting which may be the better buy currently. Targeted at investors keen on understanding market positions, the article addresses queries on price predictions, institutional adoption, and technical development, while also discussing associated risks. Readers can expect insights into how to strategically allocate their portfolios between FUSE and LINK, tailored to varying investment strategies and risk appetites.
Introduction: FUSE vs LINK Investment Comparison
In the cryptocurrency market, the comparison between FUSE and LINK has always been an unavoidable topic for investors. The two not only show significant differences in market cap ranking, application scenarios, and price performance, but also represent different crypto asset positioning.
Fuse Network (FUSE): Since its launch in 2019, it has gained market recognition for its mission to bring the power of mobile payments to communities worldwide.
ChainLink (LINK): Since its inception in 2017, it has been hailed as a decentralized oracle network, and is one of the cryptocurrencies with the highest global trading volume and market capitalization.
This article will comprehensively analyze the investment value comparison between FUSE and LINK, focusing on historical price trends, supply mechanisms, institutional adoption, technological ecosystems, and future predictions, attempting to answer the question investors care about most:
"Which is the better buy right now?"
I. Price History Comparison and Current Market Status
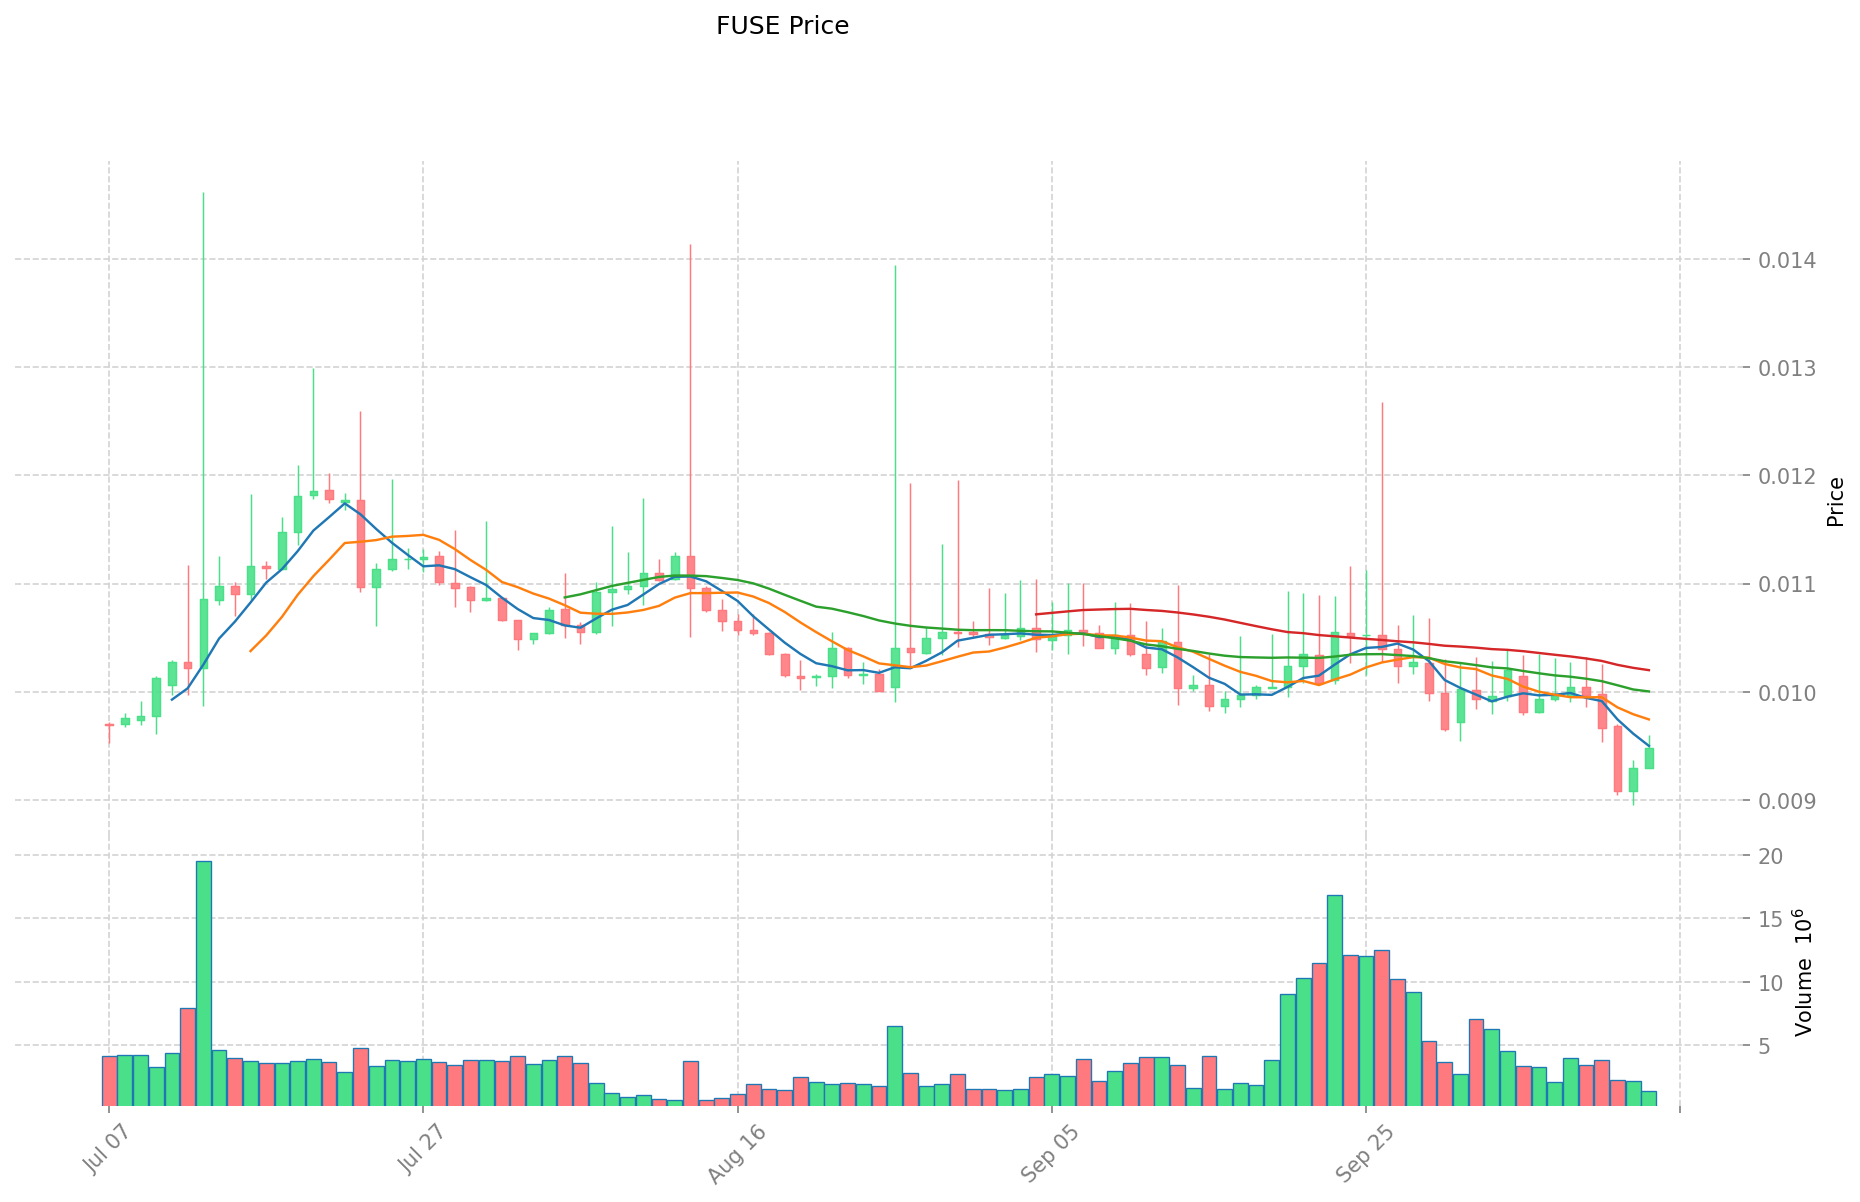
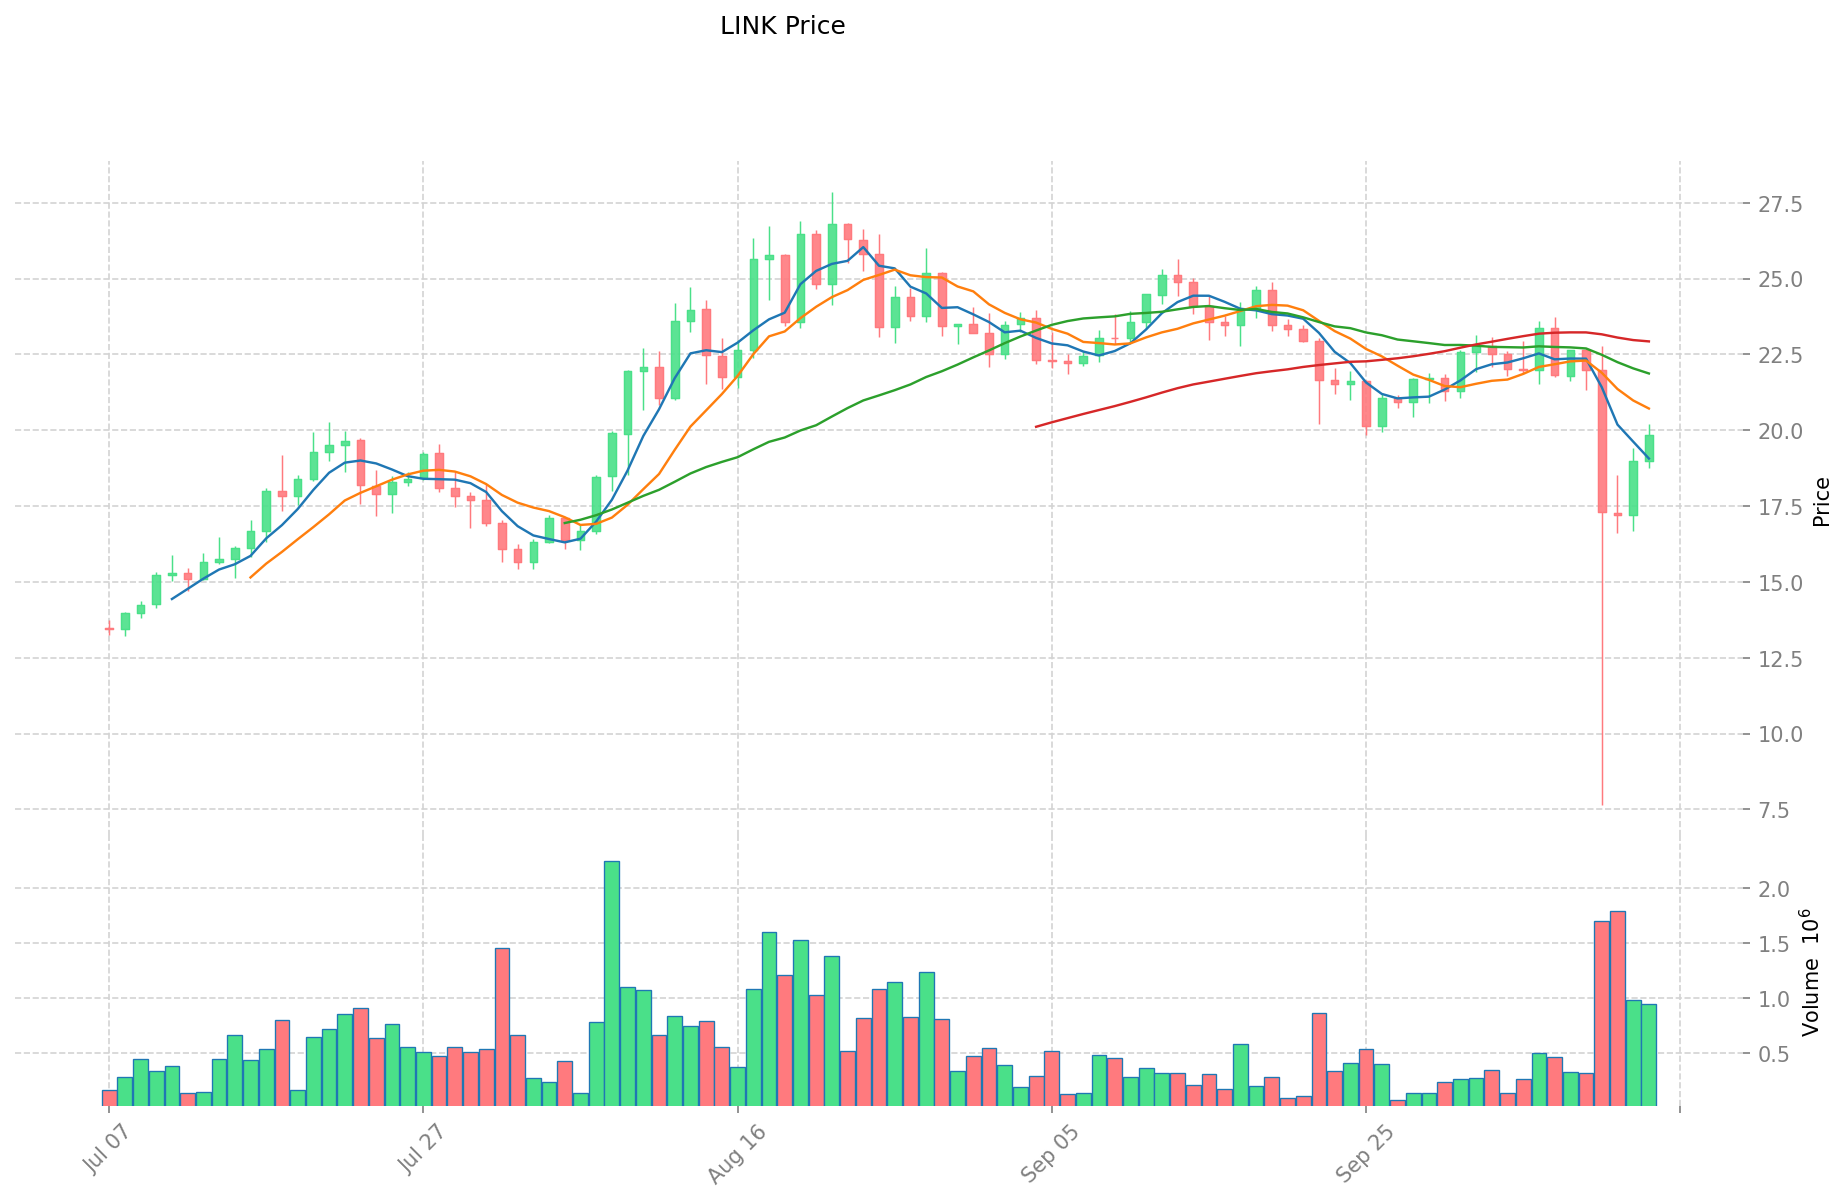
FUSE (Coin A) and LINK (Coin B) Historical Price Trends
- 2021: LINK reached its all-time high of $52.7 on May 10, 2021, marking a significant milestone.
- 2022: FUSE experienced a sharp decline, dropping from its all-time high of $2.13 on January 21, 2022.
- Comparative analysis: During the market cycle, FUSE fell from its peak of $2.13 to its current price of $0.00948, while LINK has shown more resilience, currently trading at $19.845.
Current Market Situation (2025-10-14)
- FUSE current price: $0.00948
- LINK current price: $19.845
- 24-hour trading volume: FUSE $12,974.06 vs LINK $18,381,839.45
- Market Sentiment Index (Fear & Greed Index): 38 (Fear)
Click to view real-time prices:
- View FUSE current price Market Price
- View LINK current price Market Price
II. Core Factors Affecting the Investment Value of FUSE vs LINK
Supply Mechanisms Comparison (Tokenomics)
- FUSE: Fixed total supply of 1 billion FUSE tokens, with approximately 60% currently in circulation
- LINK: Maximum supply of 1 billion LINK tokens, with about 60% currently in circulation
- 📌 Historical Pattern: Limited token supply models typically create scarcity over time, potentially supporting long-term price appreciation during periods of increased demand.
Institutional Adoption and Market Applications
- Institutional Holdings: LINK has significantly stronger institutional backing, being held by major investment firms like Grayscale and used by Google Cloud, Oracle, and AWS
- Enterprise Adoption: LINK leads in enterprise integration with over 2,000 projects utilizing its oracle services, while FUSE focuses on payment solutions and financial inclusion for SMEs
- Regulatory Attitudes: Both tokens operate under similar regulatory frameworks as utility tokens, though LINK's wider adoption has given it more regulatory visibility and established status
Technical Development and Ecosystem Building
- FUSE Technical Upgrades: Development of Fuse v2 to address scalability issues; introduction of FuseBox for middleware solutions
- LINK Technical Development: Continuous expansion of oracle networks; implementation of CCIP (Cross-Chain Interoperability Protocol); development of Chainlink VRF
- Ecosystem Comparison: LINK has a more extensive ecosystem across various sectors including DeFi, insurance, and gaming, while FUSE focuses primarily on payment solutions and financial services
Macroeconomic Factors and Market Cycles
- Performance During Inflation: LINK has historically shown resilience during inflationary periods due to its utility value and institutional backing
- Monetary Policy Effects: Both tokens are affected by broader crypto market reactions to interest rate changes, with LINK showing stronger correlation to traditional market movements
- Geopolitical Factors: FUSE's focus on financial inclusion may benefit from increased cross-border payment demand in emerging markets, while LINK's oracle services maintain critical infrastructure value regardless of regional conflicts
III. 2025-2030 Price Prediction: FUSE vs LINK
Short-term Prediction (2025)
- FUSE: Conservative $0.009006 - $0.00948 | Optimistic $0.00948 - $0.0120396
- LINK: Conservative $11.9538 - $19.923 | Optimistic $19.923 - $28.29066
Mid-term Prediction (2027)
- FUSE may enter a growth phase, with estimated prices $0.00659306745 - $0.01492115265
- LINK may enter a bullish market, with estimated prices $17.28459711 - $32.5526578905
- Key drivers: Institutional capital inflow, ETF, ecosystem development
Long-term Prediction (2030)
- FUSE: Base scenario $0.01398033349167 - $0.016217186850337 | Optimistic scenario $0.016217186850337+
- LINK: Base scenario $39.347305033595625 - $52.725388745018137 | Optimistic scenario $52.725388745018137+
View detailed price predictions for FUSE and LINK
Disclaimer: This analysis is for informational purposes only and should not be considered as financial advice. Cryptocurrency markets are highly volatile and unpredictable. Always conduct your own research before making any investment decisions.
FUSE:
| 年份 |
预测最高价 |
预测平均价格 |
预测最低价 |
涨跌幅 |
| 2025 |
0.0120396 |
0.00948 |
0.009006 |
0 |
| 2026 |
0.01237377 |
0.0107598 |
0.008177448 |
13 |
| 2027 |
0.01492115265 |
0.011566785 |
0.00659306745 |
22 |
| 2028 |
0.014303486331 |
0.013243968825 |
0.01059517506 |
39 |
| 2029 |
0.01418693940534 |
0.013773727578 |
0.01336051575066 |
45 |
| 2030 |
0.016217186850337 |
0.01398033349167 |
0.009506626774335 |
47 |
LINK:
| 年份 |
预测最高价 |
预测平均价格 |
预测最低价 |
涨跌幅 |
| 2025 |
28.29066 |
19.923 |
11.9538 |
0 |
| 2026 |
33.5084937 |
24.10683 |
13.2587565 |
21 |
| 2027 |
32.5526578905 |
28.80766185 |
17.28459711 |
45 |
| 2028 |
38.3501998378125 |
30.68015987025 |
19.63530231696 |
54 |
| 2029 |
44.17943021316 |
34.51517985403125 |
23.47032230074125 |
74 |
| 2030 |
52.725388745018137 |
39.347305033595625 |
33.445209278556281 |
98 |
IV. Investment Strategy Comparison: FUSE vs LINK
Long-term vs Short-term Investment Strategies
- FUSE: Suitable for investors focused on payment solutions and ecosystem potential
- LINK: Suitable for investors seeking stability and inflation-resistant properties
Risk Management and Asset Allocation
- Conservative investors: FUSE: 10% vs LINK: 90%
- Aggressive investors: FUSE: 30% vs LINK: 70%
- Hedging tools: Stablecoin allocation, options, cross-currency portfolio
V. Potential Risk Comparison
Market Risks
- FUSE: Higher volatility due to lower market cap and trading volume
- LINK: Potential overvaluation risks due to high institutional adoption
Technical Risks
- FUSE: Scalability, network stability
- LINK: Oracle node centralization, security vulnerabilities
Regulatory Risks
- Global regulatory policies may have different impacts on both tokens
VI. Conclusion: Which Is the Better Buy?
📌 Investment Value Summary:
- FUSE advantages: Focus on financial inclusion, potential for growth in emerging markets
- LINK advantages: Strong institutional backing, wide adoption in various sectors
✅ Investment Advice:
- Novice investors: Consider a higher allocation to LINK for its established market position
- Experienced investors: Balanced portfolio with both LINK and FUSE, adjusting based on risk tolerance
- Institutional investors: LINK may be more suitable due to its liquidity and established use cases
⚠️ Risk Warning: Cryptocurrency markets are highly volatile. This article does not constitute investment advice.
None
VII. FAQ
Q1: What are the main differences between FUSE and LINK in terms of market position?
A: FUSE is focused on mobile payments and financial inclusion for communities worldwide, while LINK is a decentralized oracle network with a much larger market cap and trading volume. LINK has stronger institutional backing and wider adoption across various sectors.
Q2: How do the price predictions for FUSE and LINK compare for 2030?
A: For 2030, FUSE's base scenario predicts a price range of $0.01398033349167 - $0.016217186850337, while LINK's base scenario predicts $39.347305033595625 - $52.725388745018137. LINK is expected to have a significantly higher price and potential growth rate.
Q3: What are the key factors affecting the investment value of FUSE and LINK?
A: Key factors include supply mechanisms, institutional adoption, market applications, technical development, ecosystem building, and macroeconomic factors such as inflation and monetary policy.
Q4: How do FUSE and LINK compare in terms of institutional adoption?
A: LINK has significantly stronger institutional backing, being held by major investment firms like Grayscale and used by tech giants such as Google Cloud, Oracle, and AWS. FUSE has less institutional adoption, focusing more on SMEs and community-based financial solutions.
Q5: What are the main risks associated with investing in FUSE and LINK?
A: For FUSE, risks include higher volatility due to lower market cap and trading volume, as well as scalability and network stability issues. For LINK, potential risks include overvaluation due to high institutional adoption and concerns about oracle node centralization.
Q6: How should investors allocate their portfolio between FUSE and LINK?
A: Conservative investors might consider allocating 10% to FUSE and 90% to LINK, while more aggressive investors could allocate 30% to FUSE and 70% to LINK. The exact allocation should be based on individual risk tolerance and investment goals.
* The information is not intended to be and does not constitute financial advice or any other recommendation of any sort offered or endorsed by Gate.


