SuXia_sDiscussionOnS
vip
Age0Year
Peak Tier0
No content yet
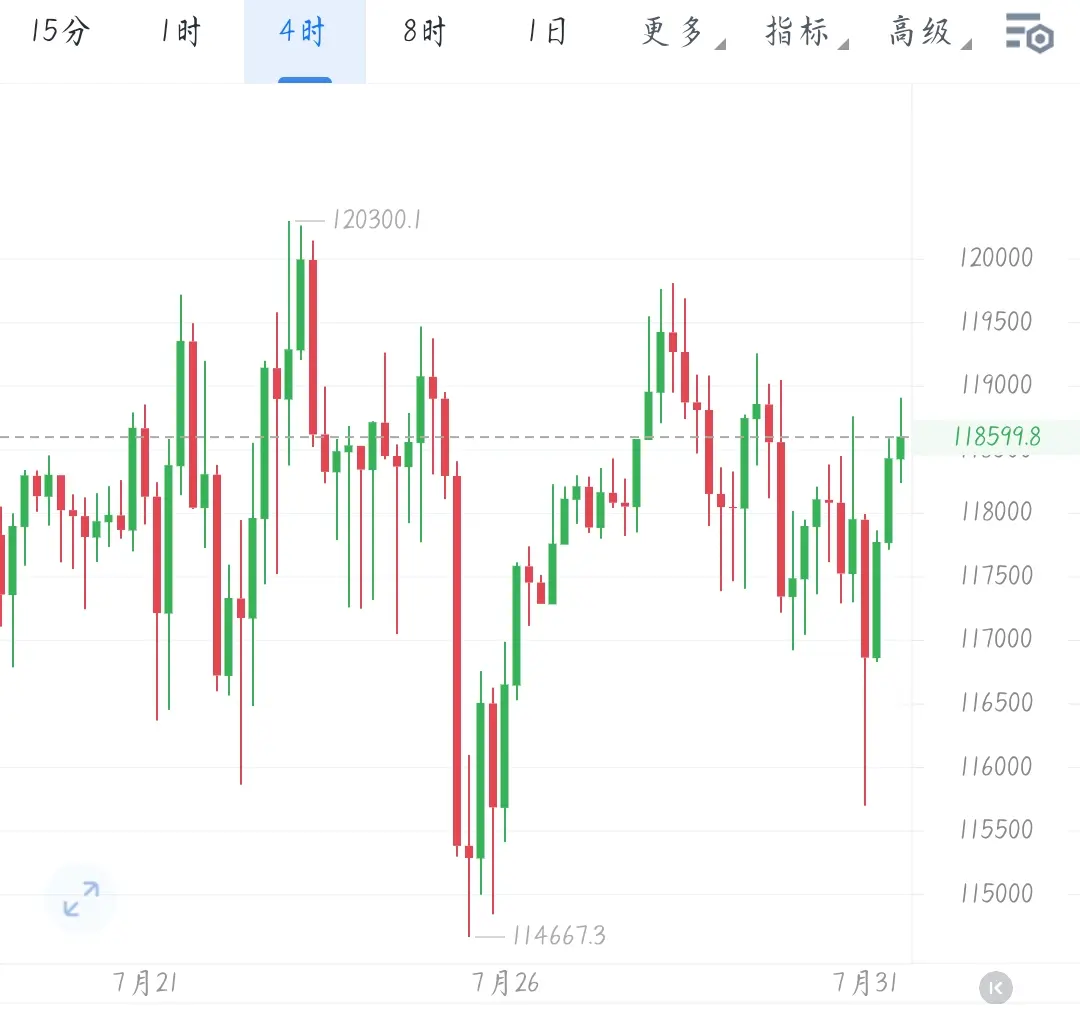
In the late afternoon, BTC fluctuated narrowly in the range of 114000-116000, with long and short forces in a stalemate. From the perspective of technical indicators, the Bollinger Bands on the hourly chart are all moving downwards simultaneously, indicating a short-term trend that leans towards adjustment, with long positions not yet recovering. However, the narrowing of the Bollinger Bands suggests that the oscillation pattern may soon break out. In terms of operation, one can go long near 114200, targeting a price level of 116200-117200.
BTC-0.59%
View Original
  • Reward
  • Comment
  • Share
From the technical pattern of the four-hour chart, the dominance of short positions remains evident after BTC surged and then pulled back. The price is pressured by the middle band of the Bollinger Bands during the rebound, and a long bearish line appears accompanied by higher trade volumes, indicating insufficient strength for a bullish counterattack.

Currently, it is important to focus on the breakthrough situation of the middle band of the Bollinger Bands. If the price continues to be suppressed by the middle band, it is highly likely to test the support level of 117000 downwards. Once th
BTC-0.59%
ETH-2.64%
View Original
post-image
  • Reward
  • Comment
  • Share
  • Topic
    1/3
  • Pin
Trade Crypto Anywhere Anytime
qrCode
Scan to download Gate app
Community
English
  • 简体中文
  • English
  • Tiếng Việt
  • 繁體中文
  • Español
  • Русский
  • Français (Afrique)
  • Português (Portugal)
  • Bahasa Indonesia
  • 日本語
  • بالعربية
  • Українська
  • Português (Brasil)