Futures
Access hundreds of perpetual contracts
TradFi
Gold
One platform for global traditional assets
Options
Hot
Trade European-style vanilla options
Unified Account
Maximize your capital efficiency
Demo Trading
Introduction to Futures Trading
Learn the basics of futures trading
Futures Events
Join events to earn rewards
Demo Trading
Use virtual funds to practice risk-free trading
Launch
CandyDrop
Collect candies to earn airdrops
Launchpool
Quick staking, earn potential new tokens
HODLer Airdrop
Hold GT and get massive airdrops for free
Pre-IPOs
Unlock full access to global stock IPOs
Alpha Points
Trade on-chain assets and earn airdrops
Futures Points
Earn futures points and claim airdrop rewards
BTC has broken below a key support level! 74400 is just the beginning—Is this wave a shakeout or a trend reversal?
Current Price: 74443.31
Compared with yesterday’s high-level consolidation and fluctuations, BTC has already shown signals of structural weakening. It’s not the price moving down that’s frightening—what’s scary is that the bulls’ rhythm is being disrupted, and the market is transitioning from “bullish on consolidation” to a “weak structural” phase.
This is not a simple pullback; the direction choice has already started to tilt.
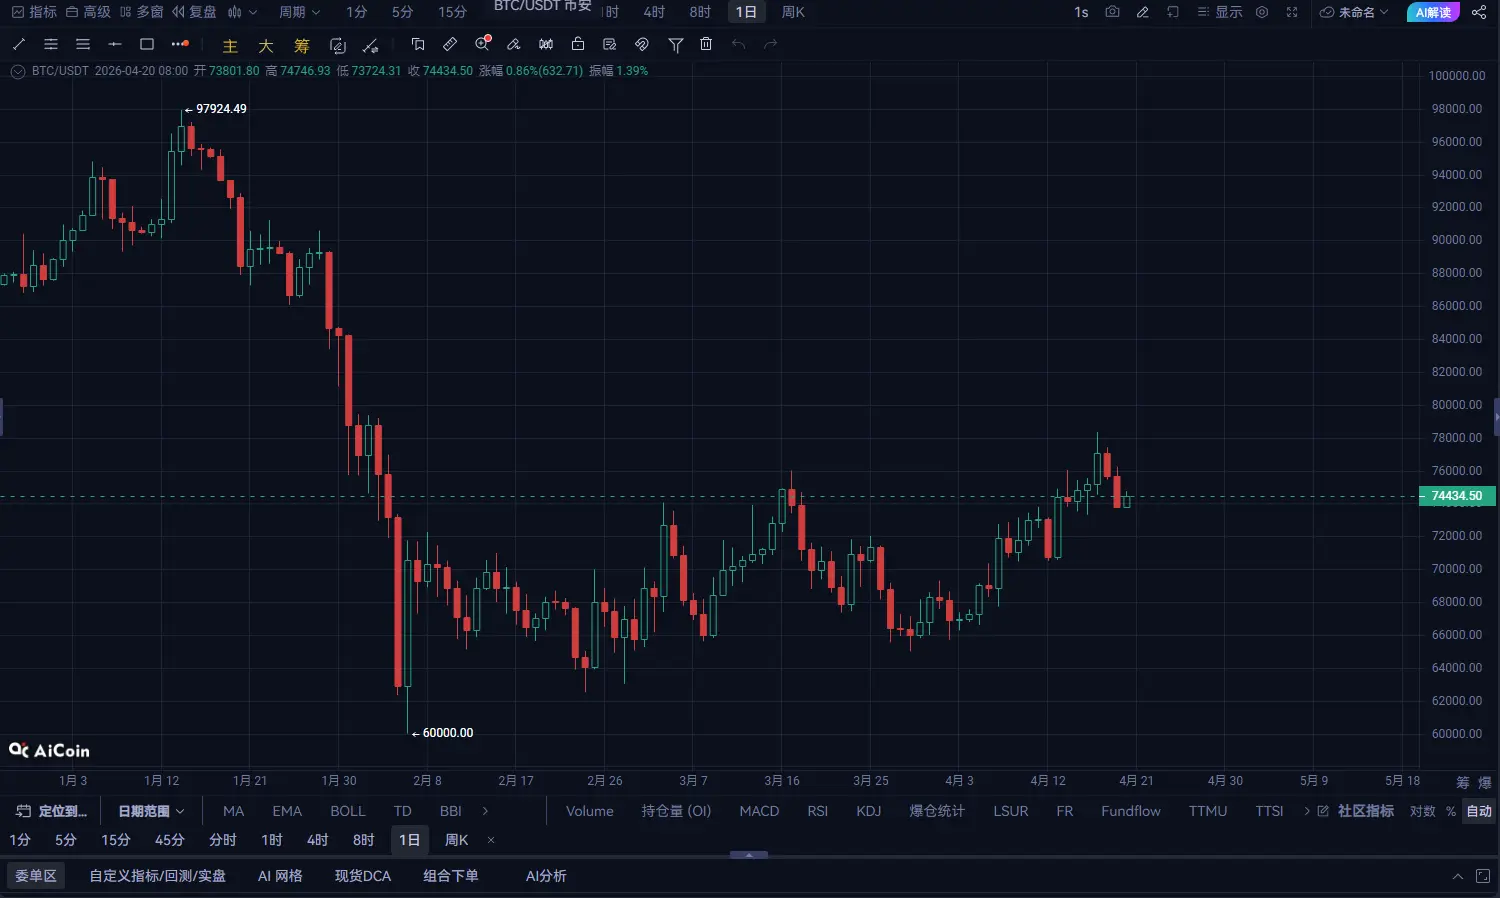
I. Daily timeframe: After stalling and drifting sideways at high levels, weakness sets in—pullback signals are being confirmed
The daily chart is currently releasing several key signals:
After continuous consolidation at high levels, a solid bearish candle appears → bears start taking over the rhythm
Unable to break through the previous high, forming a phased top structure
The MACD red histogram keeps shrinking, approaching a death cross
RSI breaks below 60 → bullish momentum clearly decreases
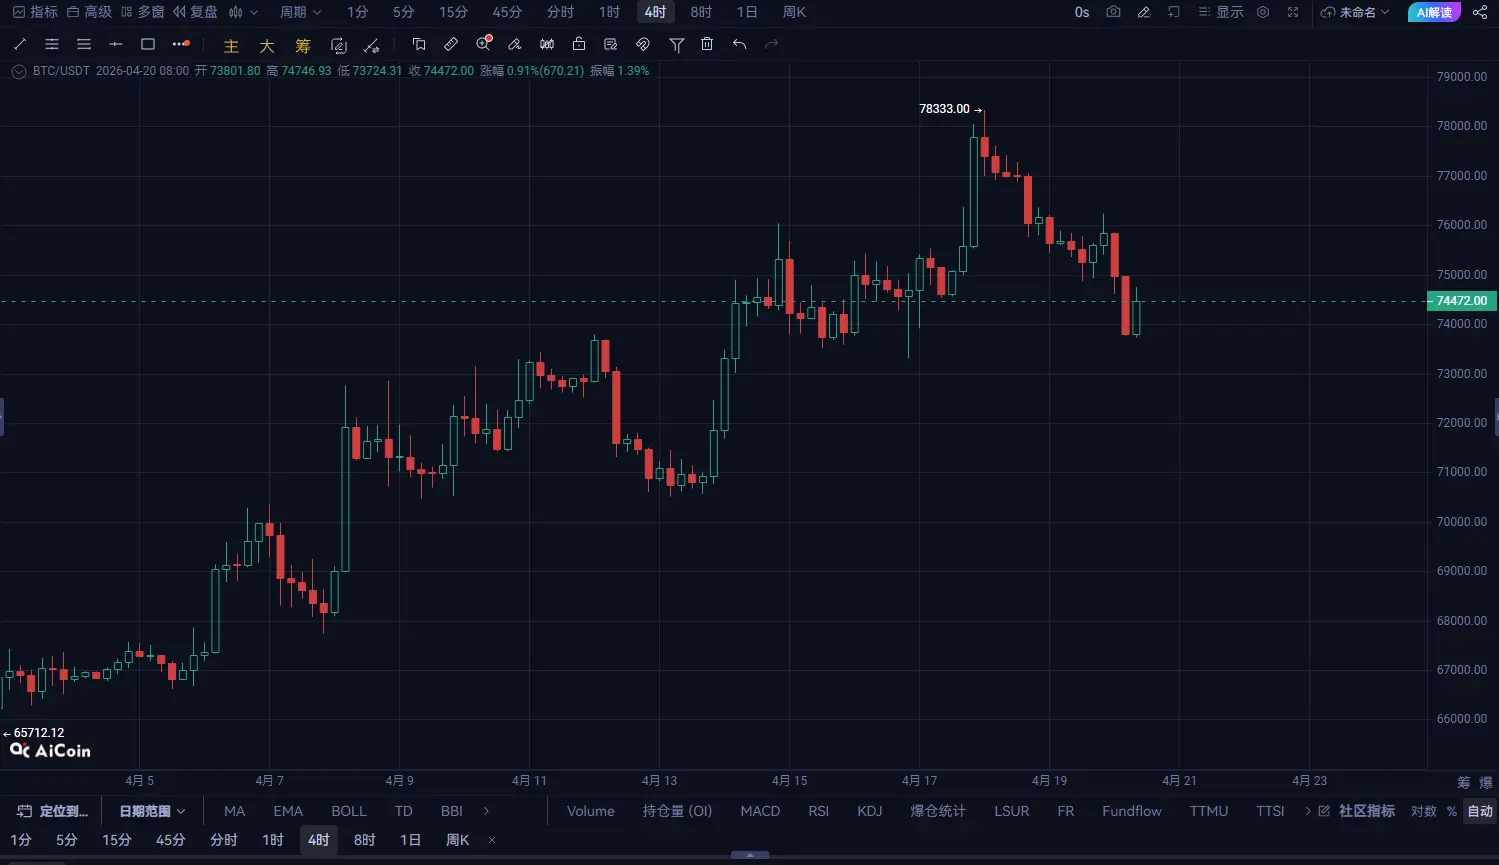
II. 4-hour timeframe: Breaks below the box—downtrend structure is established
The 4-hour chart is currently the clearest signal source:
Breaks below the lower edge of the prior consolidation range (75000-78000)
High points keep moving lower, while lows continue to be refreshed
The moving average system forms a bearish alignment
Technical indicators:
After the MACD death cross, it moves below the 0 axis → the bearish trend is confirmed
Bollinger Bands open downward → volatility is released
Price drops on expanding volume, rebounds on shrinking volume → a standard bearish rhythm
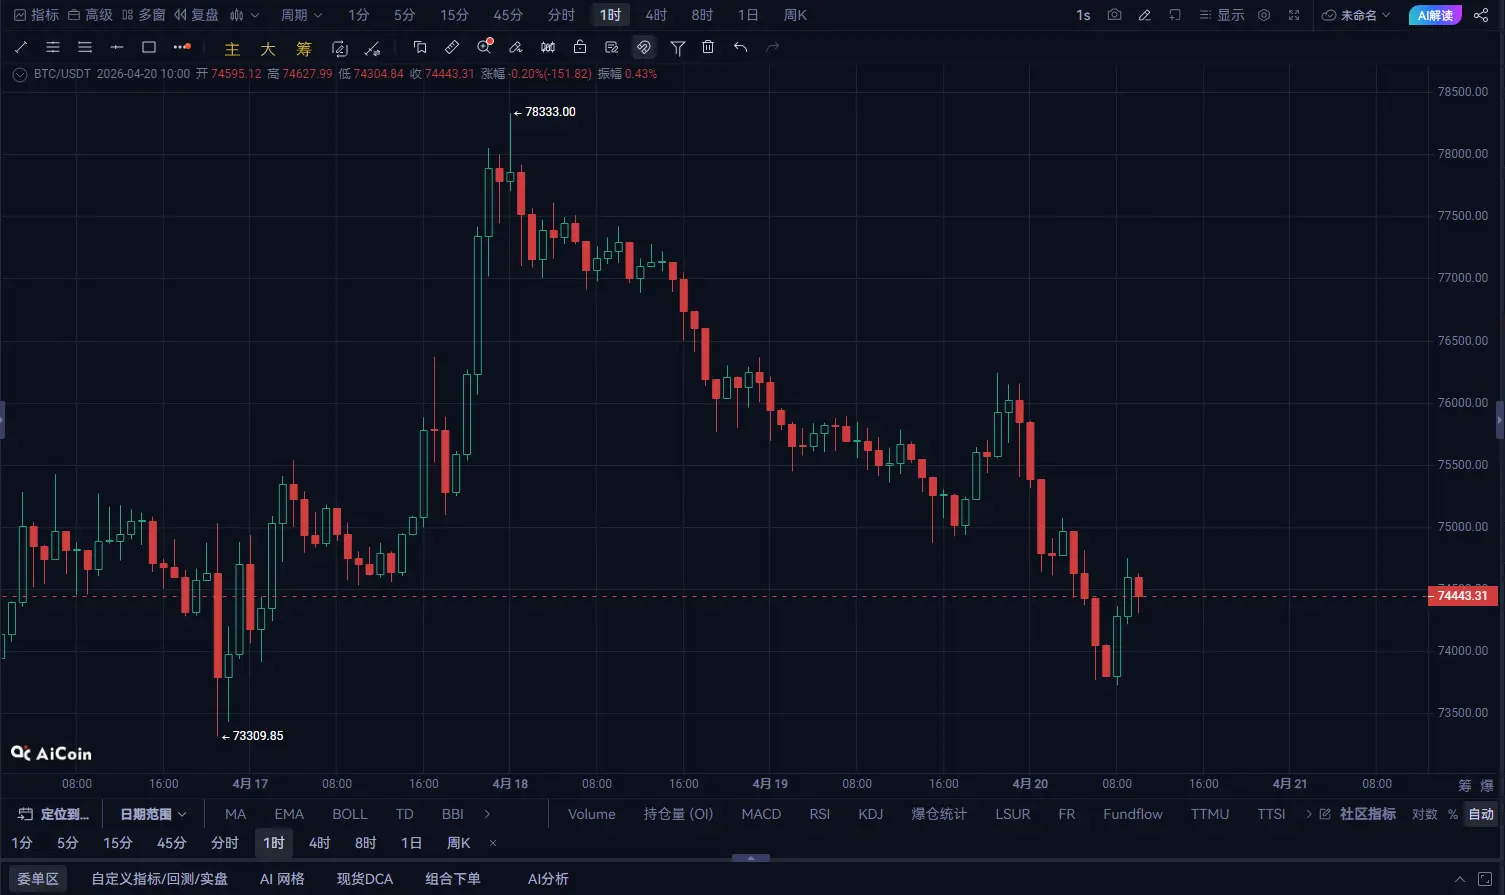
III. 1-hour timeframe: Bears dominate—entering a rhythmic decline
The short-term structure is very clear:
Bearish alignment of moving averages (MA20/MA60 suppressing)
Rebounds lack strength and keep getting suppressed
MACD keeps increasing volume in the bearish zone
Typical rhythm:
Drop → weak rebound → break below the low again
IV. Structural summary: BTC enters the “trend-switch window”
The three-cycle confluence signals are already very obvious:
Daily: upward momentum fades
4-hour: breakdown turns into bearishness
1-hour: bearish continuation
This means:
The market is transitioning from a bullish structure to a bearish structure
【BTC Today Short Position Strategy】
Entry (short) price: 74443
First exit point: 73690
Second exit point: 72937
Stop-loss point: 75547