Trade
Trading Type
Spot
Trade crypto freely
Alpha
Points
Get promising tokens in streamlined on-chain trading
Pre-Market
Trade new tokens before they are officially listed
Margin
Magnify your profit with leverage
Convert & Block Trading
0 Fees
Trade any size with no fees and no slippage
Leveraged Tokens
Get exposure to leveraged positions simply
Futures
Futures
Hundreds of contracts settled in USDT or BTC
Options
HOT
Trade European-style vanilla options
Unified Account
Maximize your capital efficiency
Demo Trading
Futures Kickoff
Get prepared for your futures trading
Futures Events
Participate in events to win generous rewards
Demo Trading
Use virtual funds to experience risk-free trading
Earn
Launch
CandyDrop
Collect candies to earn airdrops
Launchpool
Quick staking, earn potential new tokens
HODLer Airdrop
Hold GT and get massive airdrops for free
Launchpad
Be early to the next big token project
Alpha Points
NEW
Trade on-chain assets and enjoy airdrop rewards!
Futures Points
NEW
Earn futures points and claim airdrop rewards
Investment
Simple Earn
Earn interests with idle tokens
Auto-Invest
Auto-invest on a regular basis
Dual Investment
Buy low and sell high to take profits from price fluctuations
Soft Staking
Earn rewards with flexible staking
Crypto Loan
0 Fees
Pledge one crypto to borrow another
Lending Center
One-Stop Lending Hub
VIP Wealth Hub
Customized wealth management empowers your assets growth
Private Wealth Management
Customized asset management to grow your digital assets
Quant Fund
Top asset management team helps you profit without hassle
Staking
Stake cryptos to earn in PoS products
BTC Staking
HOT
Stake BTC and earn 10% APR
GUSD Minting
Use USDT/USDC to mint GUSD for treasury-level yields
More


- Trending TopicsView More
227.59K Popularity
24.11K Popularity
4.06K Popularity
3.74K Popularity
3.8K Popularity
- Pin
November 22 | BTC trend analysis
Core Viewpoints
Current Price: $84,960 (As of November 22, 10:14 AM)
Short-term Outlook: The technical indicators show a clear bearish trend, but the deeply oversold condition suggests the possibility of a rebound. The RSI on the daily chart has dropped to 23 (deeply oversold area), while the ADX above 43 indicates that the strong downward trend continues. The derivatives market shows that bulls are still under pressure, with 77% of liquidations in the last 24 hours being long positions.
Key Support:
Key Resistance:
Technical Analysis
Multi-Cycle Trend Status
Key Price Structure
Currently, BTC is in a strong downtrend, having confirmed a “death cross” signal (50-day EMA crossing below 200-day EMA), technically entering the confirmation phase of a bear market. The price is at the lower band of the Bollinger Bands on both the 4-hour and daily charts, indicating an extreme oversold condition.
Liquidation Risk Analysis: The total liquidation volume in the last 24 hours reached $880 million, with 77% being long liquidations. The forward-looking liquidation map shows a cumulative long exposure of $1.28 billion below $82,000, while there is only $1.9 billion of short exposure above $87,000, creating a clear asymmetric downside risk.
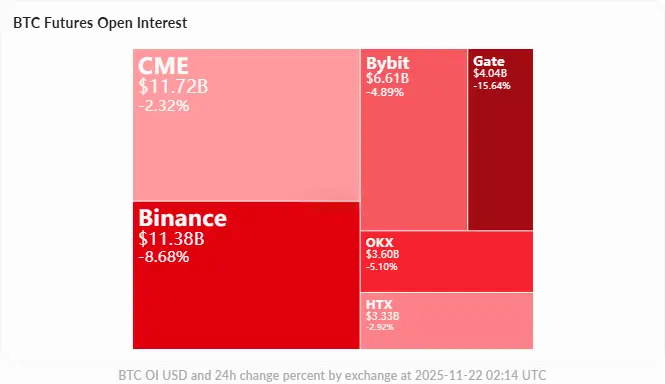
Derivatives Market: The open interest has decreased by 10.42% over the past 24 hours, and the funding rate remains positive at +0.0038% (longs pay shorts), reflecting a bearish market sentiment, with overly leveraged longs facing ongoing cost pressures.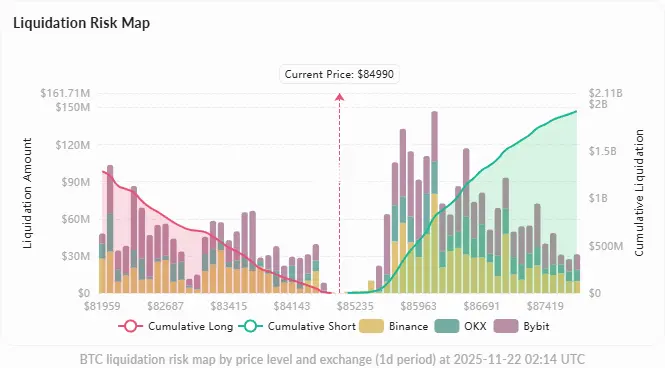
Market Drivers
macroeconomic environment pressure
The uncertainty of the Federal Reserve's policy has become a major drag factor. The probability of a rate cut in December has plummeted from 98% a month ago to about 40%, as officials express concerns over stubborn inflation and the resilience of the labor market. This “hawkish turn” has triggered a sell-off in risk assets, with the correlation between BTC and tech stocks reaching a six-month high of 80%.
Institutional Capital Flow
The US Bitcoin ETF saw an outflow of $903 million (the second largest in history), with BlackRock's IBIT experiencing a single-day outflow of $1.6 billion. The futures open interest has decreased by 35% from the October peak of $94 billion, with forced liquidations and institutional rebalancing putting pressure on prices.
Technical deterioration
BTC has fallen below the 50-week moving average (approximately $85,000), which is a classic bear market signal. The Fear and Greed Index has dropped to 15/100 (extreme fear), with a monthly decline of about 23%, marking the worst performance since June 2022.
Social Sentiment Analysis
Despite the obvious bearish signals from a technical perspective, social media sentiment remains relatively optimistic. Well-known supporters like Michael Saylor continue to promote the “buy the dip” philosophy, describing volatility as “a gift from Satoshi to his loyal followers.” The narratives of institutional adoption and long-term value storage remain strong in the community, with most discussions viewing the current pullback as a buying opportunity rather than a structural reversal.
Trading Strategy Recommendations
Rebound Trading (Medium Probability)
Trend continuation (high probability)
Key Observations
Conclusion: The short-term outlook for BTC remains bearish, with strong downward momentum pointing to a test of the $82,000 support level. However, the deeply oversold conditions and on-chain capital outflow patterns suggest that if $84,701 holds, the probability of a rebound to $86,000 is increasing.